
Abstract
COREX is an industrially and commercially proven smelting reduction process. The shaft furnace (SF) for the direct reduction of iron ore is one of the two major reactors of COREX. In the new design of COREX-3000 SF in Baosteel, China, a new technique called areal gas distribution (AGD) has been adopted. With the installation of two AGD beams, the cross-sectional area varies in a complicated manner, which will affect the burden descending behaviour. This work uses a slot model to investigate the solid flow behaviour in the SF by discrete element method. The applicability of the discrete element method model is validated. The results confirm that the flow profile in SF with AGD evolves from a flat to wave and finally to W profile as the solids descend. A triangle shaped free area is observed under the AGD beam, which is the main channel for gas flow into the shaft centre. Increasing the discharging rate has an effect of decreasing the quasi-stagnant zone size, but does not affect the macroscopic motion of particles and flow pattern above the bustle. The cross-section of AGD channel increase with the increase in the discharging rate. Under the asymmetric condition, the solid flow pattern is asymmetric. The influence of AGD on macro- and microscope properties of solid flow in SF is also evaluated. This investigation reveals that AGD beams affect the particle uniform descending in bustle zone and increase the complexity of normal force distribution.
Introduction
Environmental pressure and the increasing scarcity of good quality coking coal has led to the development of smelting reduction process such as COREX, FINEX, HIsmelt and HIsarna in recent decades. 1,2 Of these, COREX is an industrially and commercially proven smelting reduction process developed by Siemens VAI for the cost efficient and environment friendly production of hot metal from iron ore and coal. 3–5
The most innovative feature of the COREX process is the separation of the iron reduction and smelting into two separate reactors, namely, shaft furnace (SF) and melter–gasifier as shown in Fig. 1, which were described elsewhere. 6–10 Both of these reactors are typical counter current devices in which reducing gases flow upward through the particle bed while the charged solid particles descend from the top to the bottom. The particles’ motion has significant effect on the flow of other phases and further on the smooth and efficient operation in these reactors. Therefore, the transient features of solids in COREX process is a hot research in recent years. 11–15 In the new design of COREX SF in Baosteel, China, a new technique called areal gas distribution (AGD) has been adopted. Two AGD beams are installed in the furnace to modify gas distribution with the purpose of improving iron ore reduction in the central part of the SF. The reduction rate has been improved in the plant operation. However, the cross-sectional area varies in a complicated manner, which will affect the burden descending behaviour. Hence, it is necessary to investigate the solid flow in new design COREX SF.
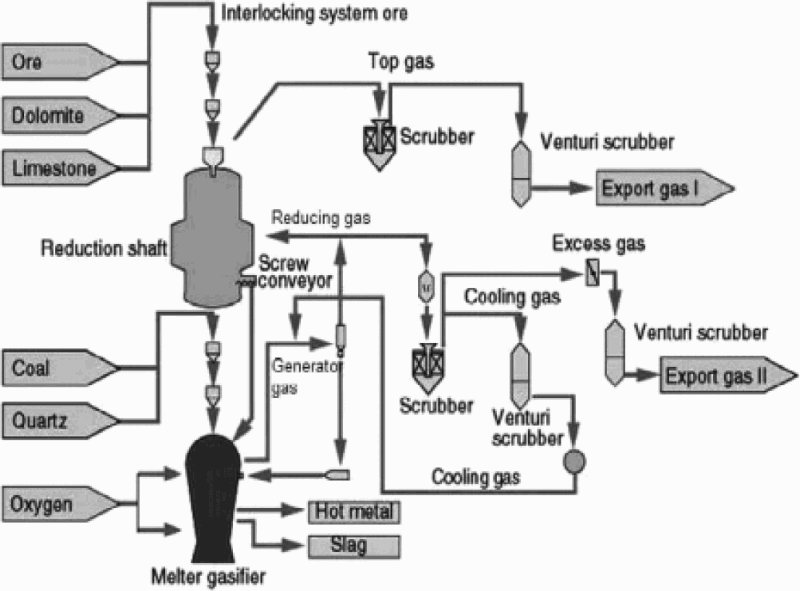
Schematic diagram of COREX process
In the past, experimental investigation of the solid particles behaviour in COREX SF with cold model has been carried out. Lee 16 investigated the solid flow profile and timeline of packed beds in SF with and without a guiding cone. Zhao 17 simulated the solid flow in COREX SF using a scaled experimental model. However, the furnace structure used in their work is the traditional furnace type. The authors 18 analysed the solid flow in the new design COREX SF by a cold model and evaluated the influence of AGD on burden descending behaviour. 19 However, the results obtained so far about SF solid flow are largely macroscopic, and the properties and microstructure at a particle scale for this particulate system are difficult to be obtained even with well controlled physical models. To overcome this problem, the discrete element method (DEM) 20 has recently been used to study the solid descending behaviour in COREX SF, such as particle descending velocity in bottom part of SF 21 and the asymmetric solid flow. 22 While these studies provide useful information, most of the work focus on the solid flow in traditional SF, and there is little information about the effect of AGD on burden descending behaviour inside the SF. Hou et al. 23 established a DEM model to investigate the gas–solid flow in reduction shaft of COREX, and the effects of stickiness between particles and different designs of the SF on solid flow are illustrated. Nevertheless, the effect of AGD on solid flow is mainly reflected in the variation of the distribution of particle velocities, such as the translational and angular velocities. Little information about the solid flow patterns, streamlines and distribution of normal contact force in the new design SF is available.
In this work, solid flow behaviour in new design COREX SF is numerical studied by DEM. The simulation model is validated by comparing computed results with published experimental data. Then, the macro- and microscope properties of solid flow in new design SF are investigated under different conditions, and the effect of AGD on solid flow is also examined specifically.
Theoretical treatments
Discrete element method
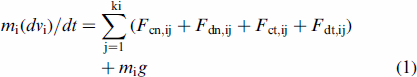
In DEM, every single particle in a considered system undergoes translational and rotational motion. The forces and torques considered include those originating from the particle's contacts with neighbouring particles, walls and surrounding fluids. The interaction force between two particles represented by spring damper friction plate is shown in Fig. 2.
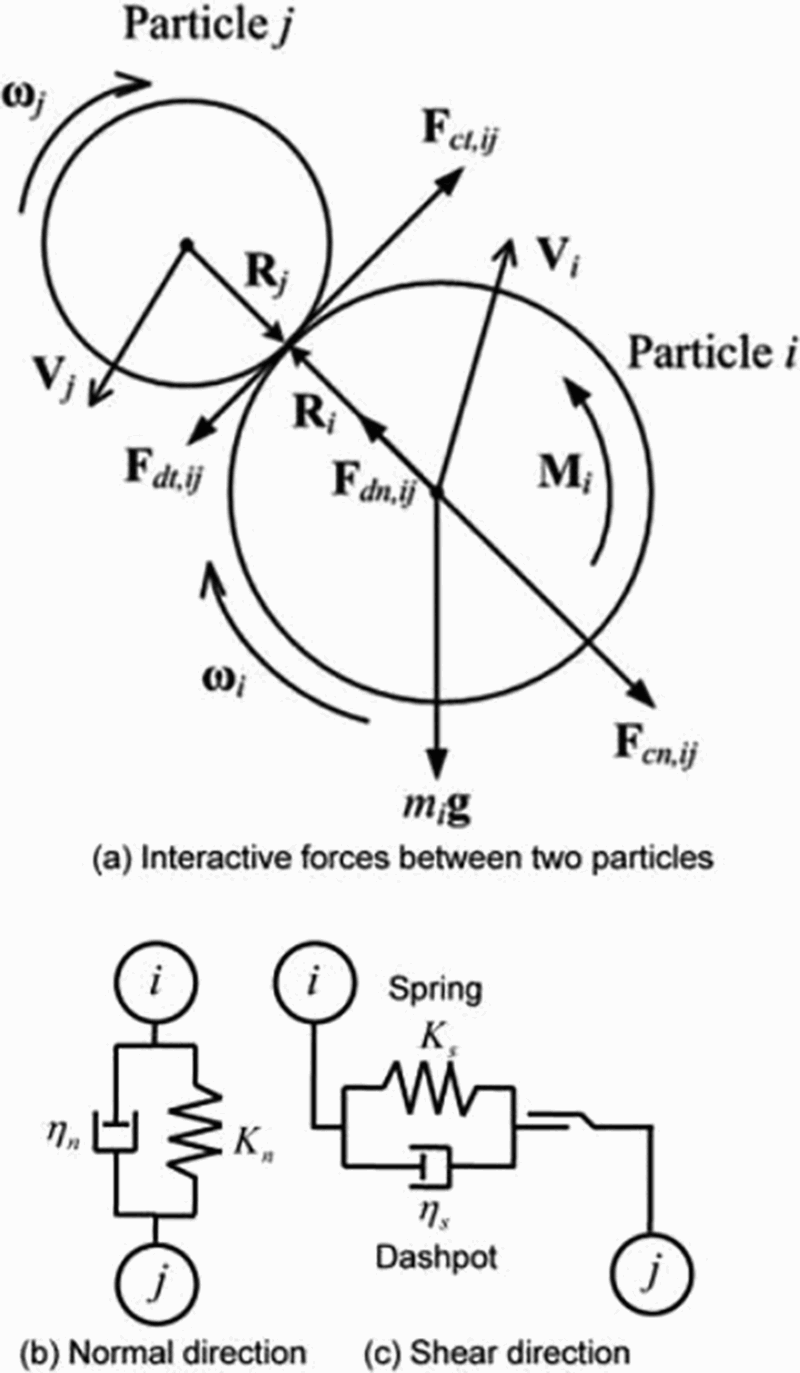
Depiction of interaction forces between two particles
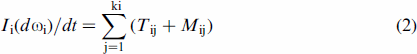
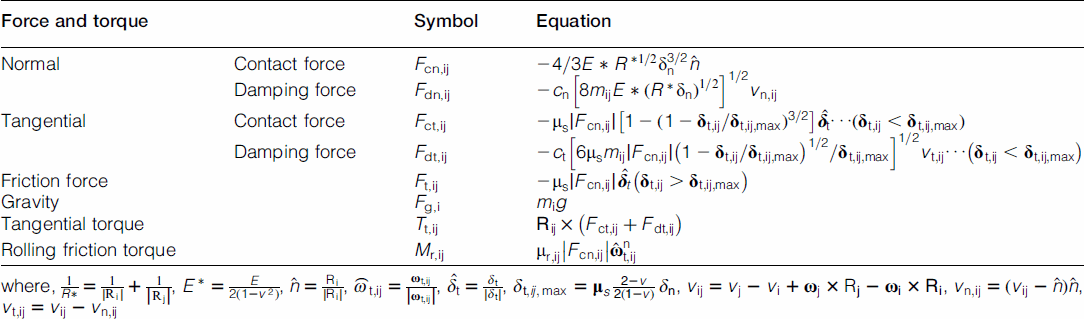
Components of forces and torques acting on particle i
Simulation conditions
COREX SF is charged with mixture burden of pellet, ore, flux and a little coke from distributor. As the burden sizes range widely, it will take numerous times to carry out the simulation if the actual sizes of burden are used. Thus, the simulation selects pellet as the object because the quantity of pellets is larger than the others. Besides, in order to reduce the number of particles and hence the computational cost, using a large particle size and a scaled down model is a common practice in process modelling by DEM. 21–25 Thus, a slot model with five particle diameter 5d p thick is used to investigate the solid flow behaviour. The main dimensional parameters for the new design SF model are given in Fig. 3, which is 1/20 of a practical COREX-3000 SF. A simulation is started with the random generation of certain number of uniform spheres without overlaps, followed by a gravitational settling process for 3.5 s. Then, the particles are discharged at a preset rate from the screw region. The top surface of burden decreases with burden discharging at screw outlets. When the top surface of burden reaches stock line level, burden is charged alternately. The material properties used in the simulation are listed in Table 2. The particle discharging rate is set as four particles every 100 time steps from screw discharging region, which is equivalent to 0.251 kg s− 1.
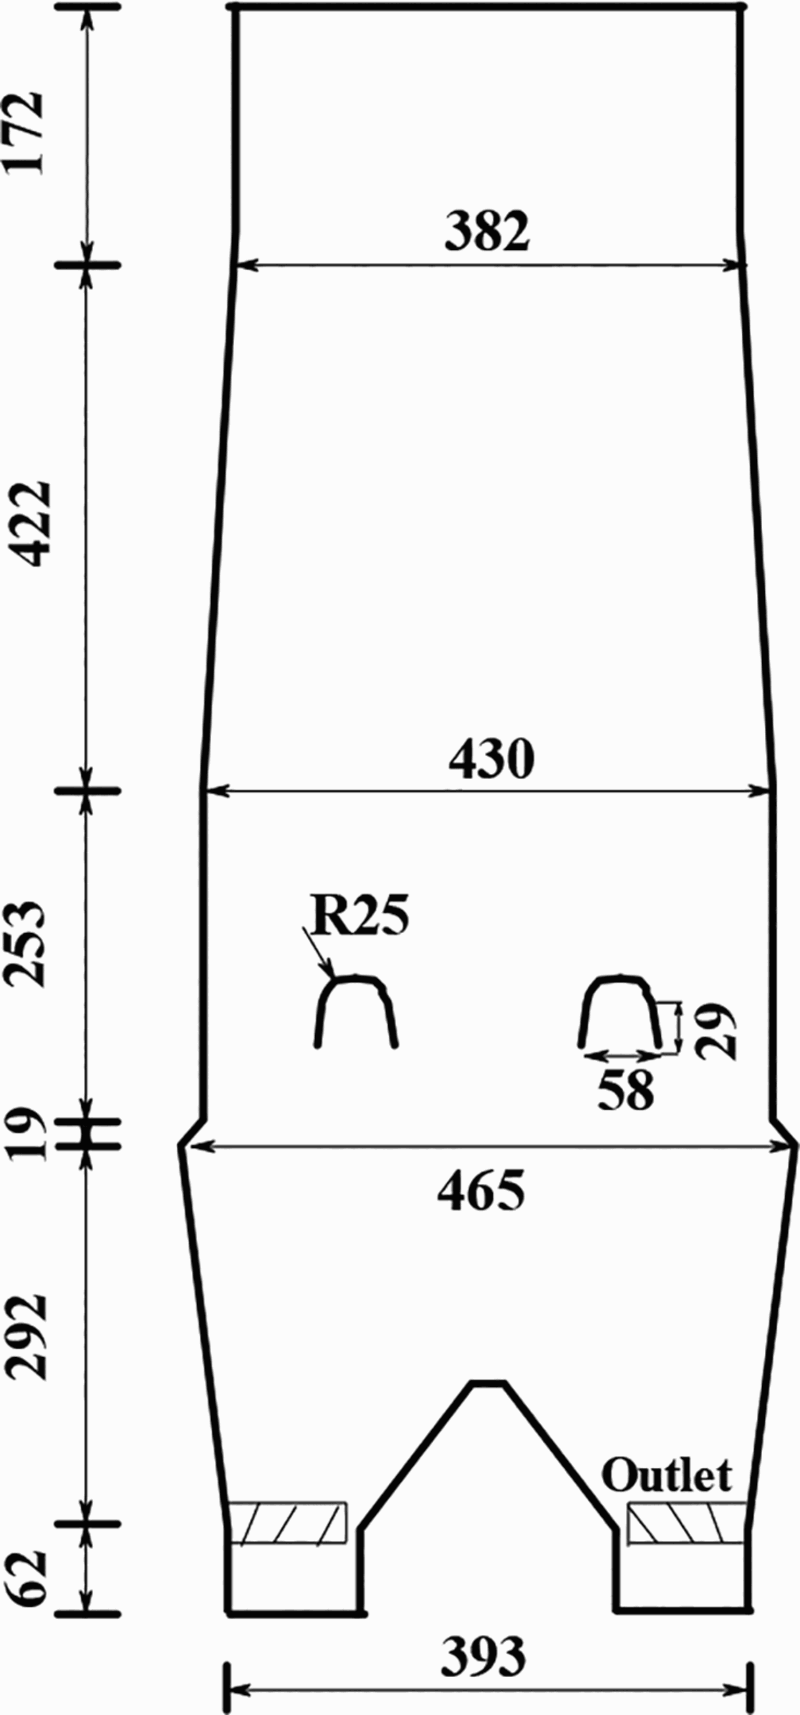
Schematic diagram of calculation region of COREX shaft furnace/mm
Particle properties and simulation conditions
Results and discussion
Model validity
The validation of the present model is performed by comparing the predictions of the model with published experimental results of Lee. 16 Fig. 4 shows a visual comparison of computed solid flow patterns in traditional SF with experimental result. As particles were charged through chutes on the packed bed in previous experiment, the initial profiles are not as flat as the modelling results. However, both for the calculated and experimental results, uniform descending occurred in the upper shaft. Meanwhile, the computed solid flow patterns in the lower part of SF are mostly in agreement with the experimental profiles. Generally speaking, despite the moderate differences in profiles in the upper shaft, the simulated burden descending behaviours are basically consistent with the experimental data, which proves the applicability of the current model for prediction of the solid flow inside COREX SF under various conditions.
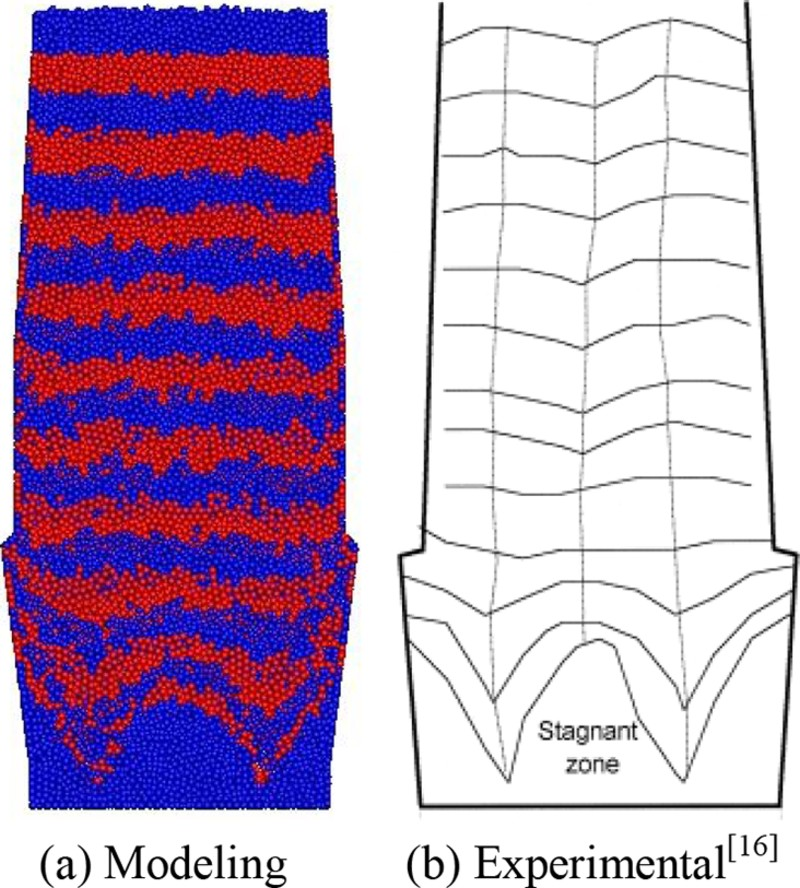
Comparison between a model prediction and b experimental 16 measurement
Typical solid flow patterns
Discharging and charging had been run over until achievement of steady flow for the current simulation condition with a discharge rate of 0.502 kg s− 1 (i.e., eight particles per 100 time steps). As schematically shown by dashed lines in Fig. 5, four flowing zones are identified: man made stagnant zone (IV) is set in lower central part, plug flow zone (I) in the upper of the shaft, funnel flow zone (II) occurs directly above the tips of solid outlet and the quasi-stagnant zone (III), regarded as a sluggishly descending zone, 26,27 located in the lower part of the furnace between the funnel flow zone and furnace wall. A unique feature is that a triangle shaped void is observed under the AGD beam. The similar phenomena is also found in our previous work. 18 For the new design SF with AGD, the reducing gas is blown into the furnace through the AGD inlets and slots. As the triangle shaped void is created under the beams, the gas can flow from AGD inlets into the shaft centre via the voids. This is the principle of AGD as shown in Fig. 6.
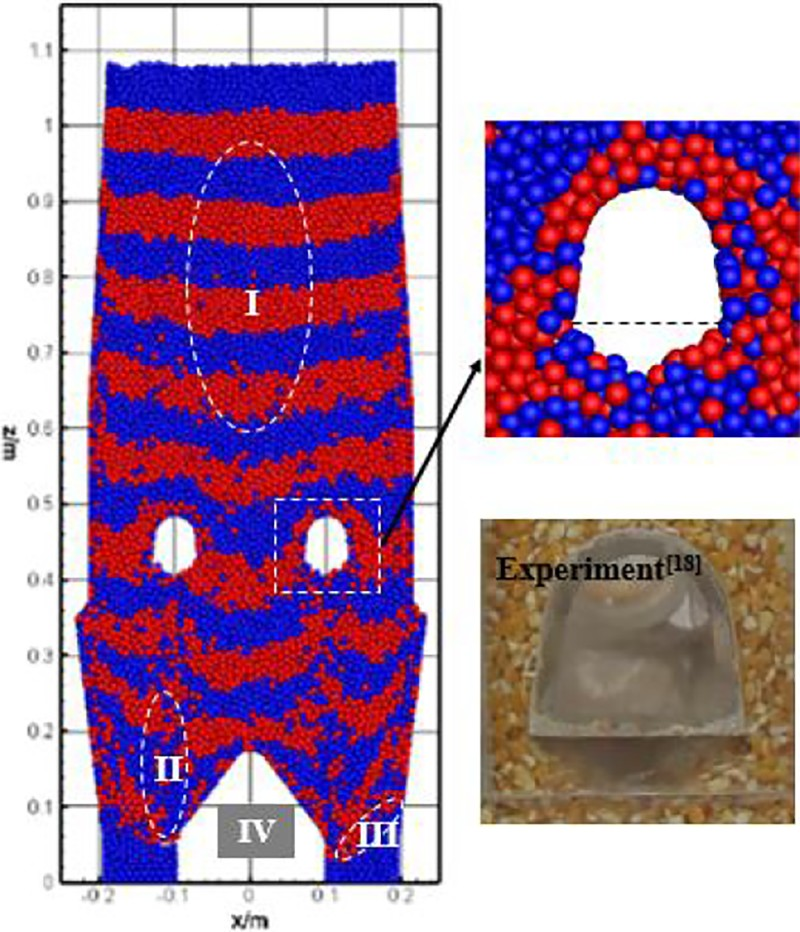
Solid flow patterns for discharge rate 0.502 kg s − 1
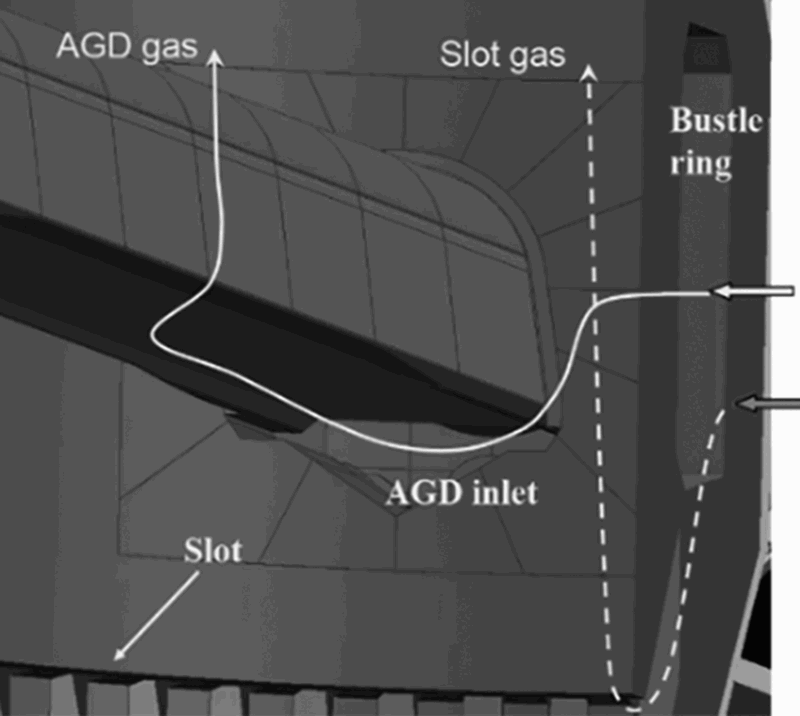
Working principle of AGD
Figure 7 shows the streamlines and timelines of tracer particles. The red crosses and open circles in this figure represent initial and disappearing positions of particles respectively. According to the calculated results, the tracers supplied at the midway of the bed top move downwards to enter the bustle zone, then the flow becomes irregular around the AGD beams due to the reduction of the flow area. The particles charged almost parallel to the wall descend linearly along the wall; however, the particles charged into the centre move downwards till the guiding cone and then approach to the outlets. The broken lines in Fig. 7 represent timelines from charging, and the numerical number corresponds to the elapsed time from charging. It can be seen that, in the plug flow zone of the upper part of the vessel, the descending of burden is uniform and a ‘flat’ flow pattern is observed. This pattern continues till the bustle level. Then, the flow pattern in bustle zone turns to ‘wave’ shape just above the AGD beams. After passing through the AGD beams, a rudiment of ‘W’ shape profile appears. As descending and discharging proceeds, the solid flow pattern is gradually changed to a full ‘W’ shape in the bottom of the furnace.
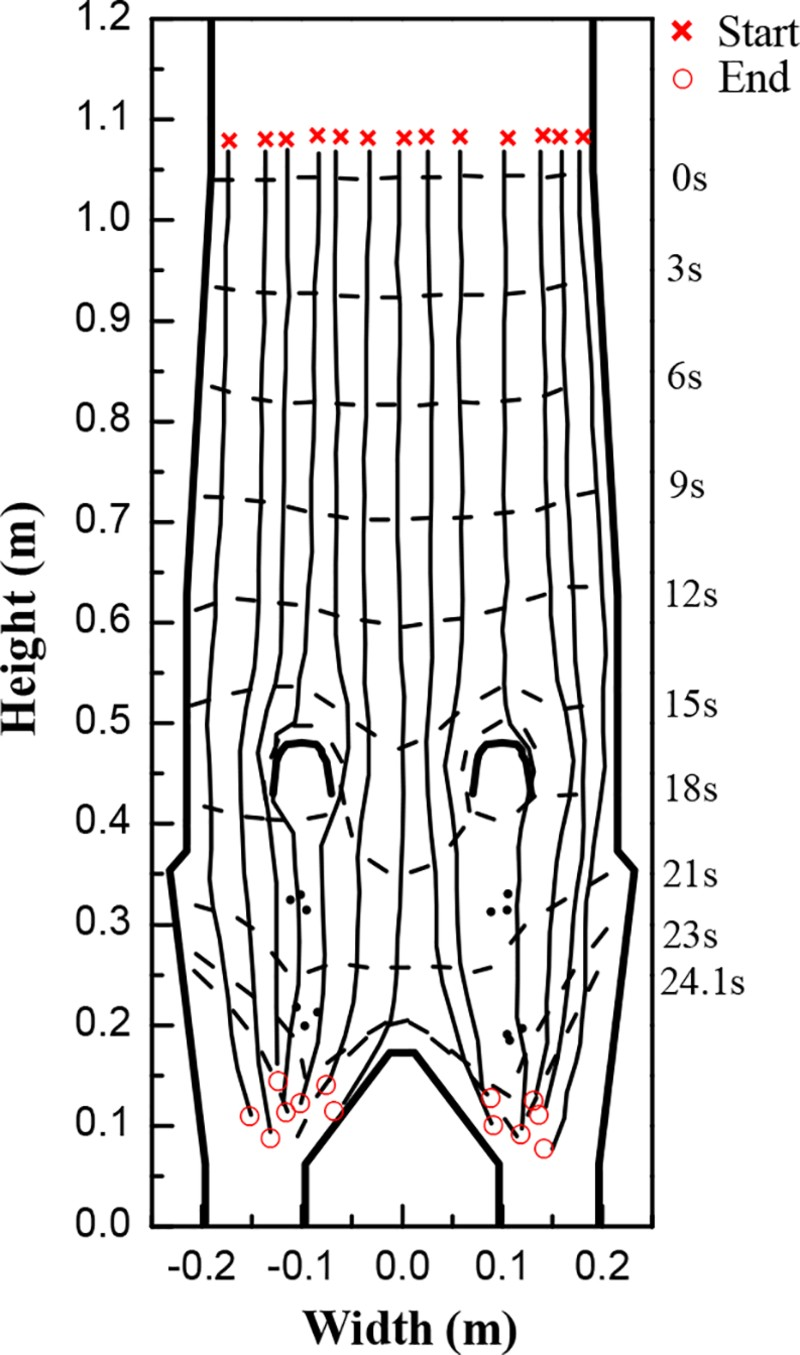
Streamlines and timelines of burden
It should be pointed out that the geometric design of the screw dischargers directly affects the solid flow patternsin the furnace. Kou et al. simulated the effect of screw flight diameter on particle descending velocity along the radius during discharging process and found that the particle descending velocity was the largest in tips of screw and reduced from the centre to the wall areas when the first flight is a little large. Optimising the screw fight diameter near the centre could achieve a uniform descending velocity. 21 Generally, increasing the pitch of screw, decreasing the shaft diameter, increasing the screw diameter or a combination of these could increase the screw capacity in the radial direction and achieve a uniform flow pattern. 28–30 The effect of geometric design of screws, especially the matching of screws and inner structure of furnace, such as AGD beams installed in bustle, on solid flow inside the entire furnace is being investigated specifically and will be reported hopefully in the near future.
Effect of discharging rate
The solid flow in COREX SF is mainly caused by the mechanical working of the screw. A previous study 18 has shown that the height of quasi-stagnant zone descreases with increasing solid flowrate. The present simulation result also confirms this finding. As shown in Fig. 8, the solid flowrate has a strong effect on the behaviour of solid flow in the bottom of SF. With increasing solid discharging rate, the height of quasi-stagnant zone becomes lower. The macroscopic motion of particles and shape of patterns above the bustle do not change with increasing discharging rate under the current conditions. However, when particles move toward the outlet with a high rate, the velocities of solid particles within the furnace are necessarily increased. This behaviour can be seen in terms of the probability density distributions of individual particle velocities.
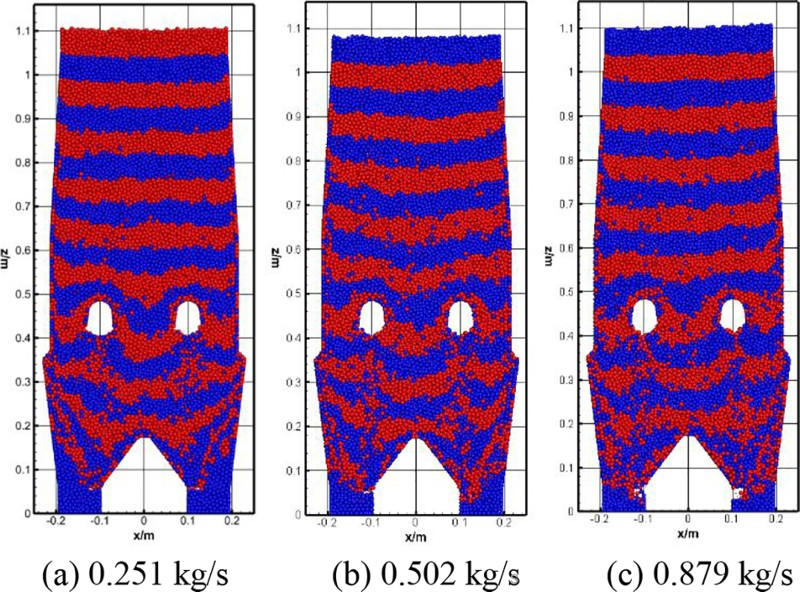
Figure 9a
shows the probability density distribution of the vertical velocities (z direction) for particles located below the bustle level. It can be observed that the magnitude of the vertical velocity varies in a large range. The peak value decreases, and the distribution becomes flatter and shifts to the left with an increase in discharging rate, which indicates that the number of ‘motionless’ or inactive particles are decreased, and more particles become active and have relatively high vertical velocities. Besides, during the discharging, particles below the outlet would move upward under the pressure from the near part of the packed bed, which reflects the positive vertical velocity in Fig. 9a
. The upward motion were also observed below the outlet in the previous DEM model
31
and physical experiments.
32
Fig. 9b
presents the probability density distribution of the particle horizontal velocities (x direction) for different discharging rates. The curve behaves as a Gaussian distribution because of the symmetry in geometry. It becomes flatter with increasing solid flowrate, showing that more particles obtain higher horizontal velocities. The result is consistent with the change of the quasi-stagnant zone. Thus, as discharging rate increases, the height of the quasi-stagnant zone reduces and more particles flow toward the tip of outlet with increased horizontal velocities. To examine the effect of discharging rate on the force distribution, the total normal contact forces acting on particle i, defined by 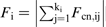
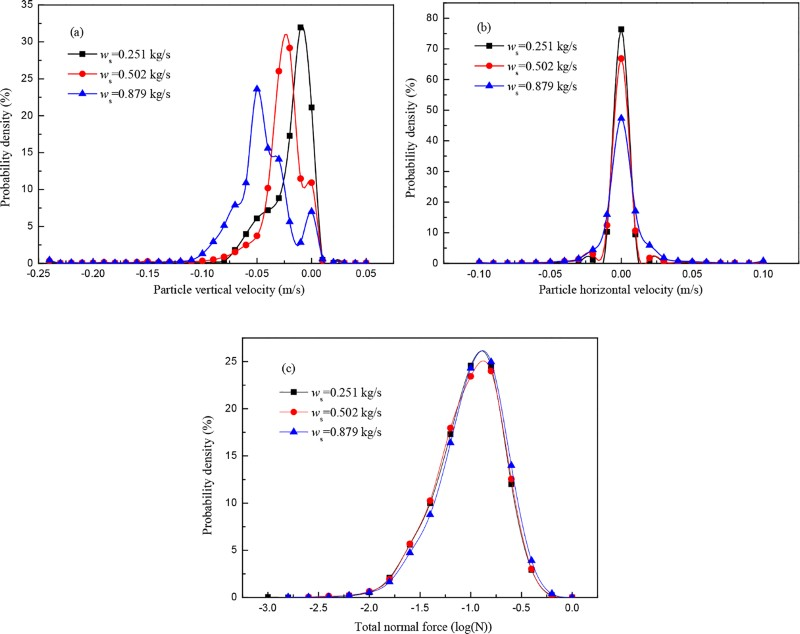
Probability density distributions of a particle vertical velocity, b particle horizontal velocity and c normal contact force in lower part of COREX SF for different particle discharging rates
As previously stated, triangle shaped voids are observed downstream of the AGD beams. The void (called as AGD channel later) is the main channel for the reducing gas from bustle to flow to the shaft centre. The influence of discharging rate on the size of AGD channel is shown in Fig. 10. The gas distribution channel with higher discharging rate is bigger than that with lower discharging rate, and therefore, the cross-section of AGD channel increases with the increase in the discharging rate. Figure 11 shows an approximate linear relationship between the cross-section of AGD channel and discharging rate. This linear relationship may be helpful to correlate the discrete particle simulations to large scale operations, which will be investigated in future works.
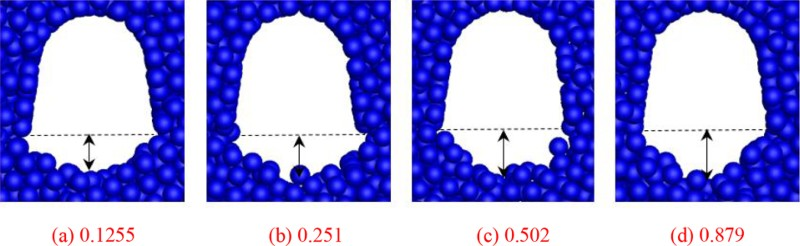
Influence of discharging rate on AGD channel size: a 0.1255, b 0.251, c 0.502, d 0.879 (Unit: kg/s)
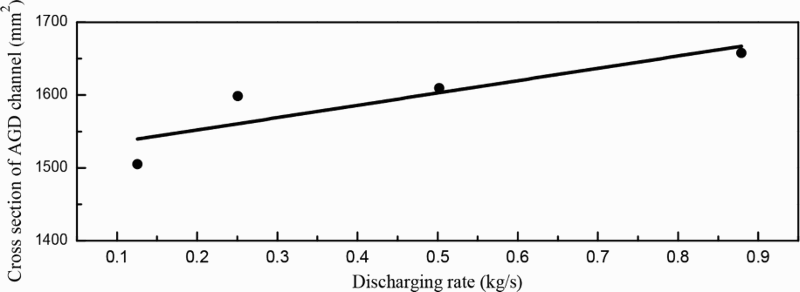
Relationship between cross-section of AGD channel and discharging rate
Asymmetrical behaviour of solid motion
Asymmetric flow behaviour is the condition where uneven flow occurs within the vessel. 33,34 In COREX SF, asymmetric flow can be caused by the uneven working of screw dischargers around the SF circumference related to maintenance outage of screw or burden sticking above the screw. 35 Uneven screw working causes different solid flow conditions within COREX SF and represents a serious operational problem. In this work, the asymmetric flow is simulated in the DEM model.
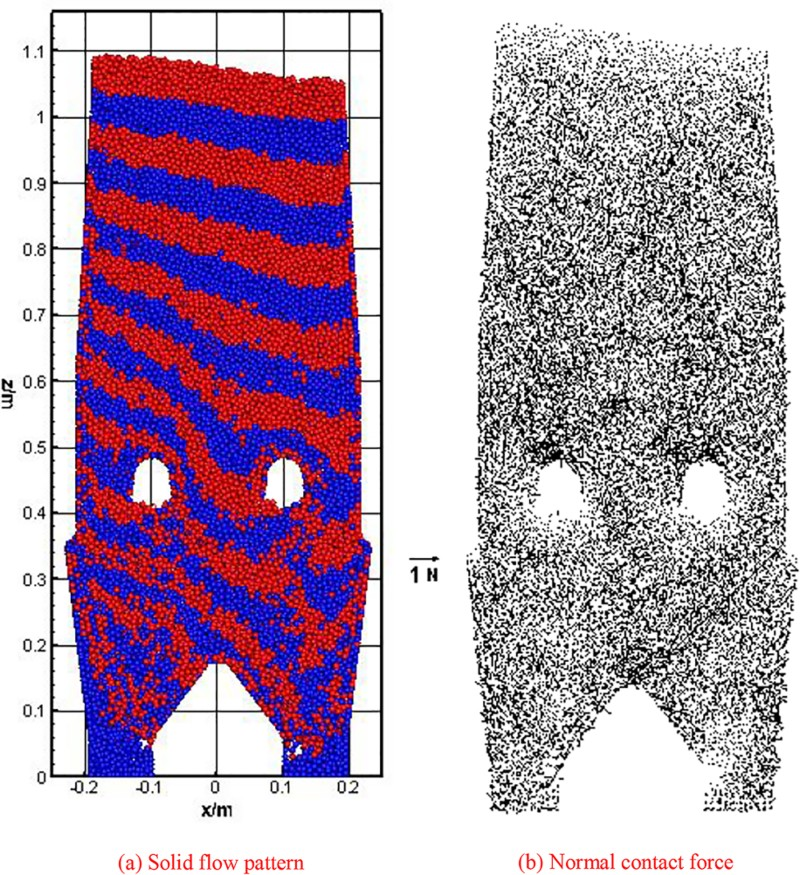
Figure 12 shows the particles descending behaviour in new design COREX SF under non-uniform condition. Under the extreme condition that no burden are discharged from the left outlet, the solid flow patterns are significantly changed, as seen in Fig. 12a . There exists a very big stagnant zone on the left side. The particles descend from the top and move to the right outlet. A triangle shaped void is created under the right beam, while no AGD channel is observed under the left beam due to the ‘motionless’ particles in the left stagnant zone. The normal contact force between particles is large in the stagnant zone where particles stay motionless or move very slowly, and small in the right funnel flow region where particles move rapidly (Fig. 12b ). These phenomena could cause the uneven distribution of reducing gas in bustle ring and possibly increase the time of static contact between particles in the left stagnant zone. As a result, the choking of gas slots and the formation of clustering may be induced. The effect of particle descending speed and gas distribution on the chocking of gas slots in the bustle zone have been investigated in our semicylindrical cold model, but this is beyond the scope of the present study.
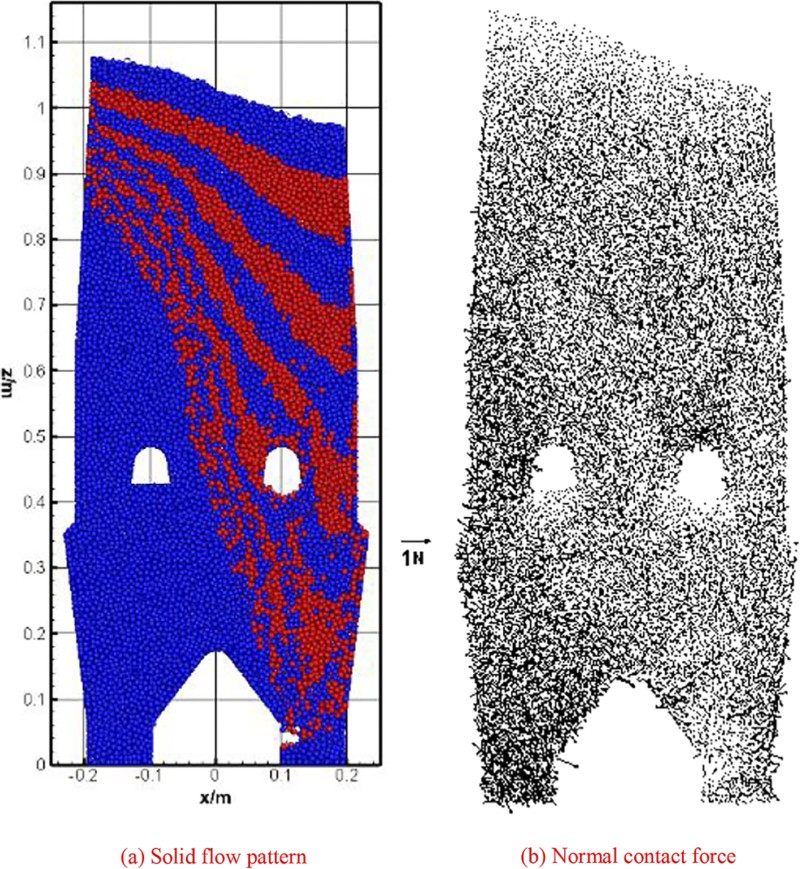
a solid flow pattern; b normal contact forceDescending behaviour of particles under non-uniform discharging rate (0–0.879 kg s − 1 )
The asymmetric flow is further examined under the conditions that particles are discharged from both outlets, but with different discharging rates, as shown in Fig. 13. It can be observed that particles behave differently on each side of the furnace. Particles on the right side descend faster, and the cross-section of AGD channel on the right side is also larger than that on the left due to the large discharging rate. The particle layer from the top is distorted due to the different descending velocities in the two sides. Figure 13b shows the normal contact force. It can be seen that, comparing with the case of Fig. 12b , the asymmetry of normal contact force is slightly reduced.
a solid flow pattern; b normal contact forceDescending behaviour of particles under non-uniform discharging rate (0.502–0.879 kg s − 1 )
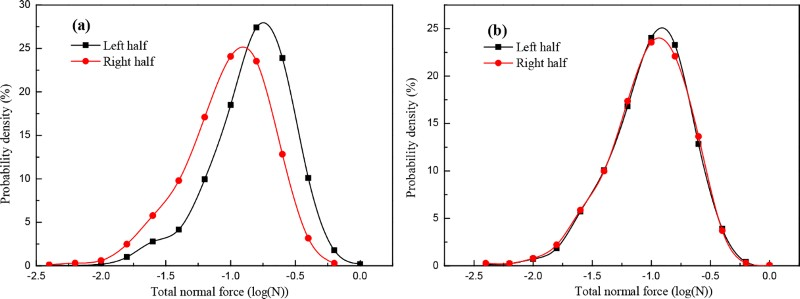
To quantitatively identify the asymmetry of normal contact force shown in Figs. 12 and 13, the probability density distributions of the normal contact forces are calculated on each half of the model. The comparison is made between the left and the right half under different abnormal conditions, as shown in Fig. 14. Under the extreme condition, as seen in Fig. 14a , the peak shifts to the right for the left half, reflecting the stronger particle–particle contact. This result corresponds to the fact that, under abnormal condition, a big stagnant zone is formed in the opposite side of working outlet, and more particles keep direct contact and strong interaction force. However, the effect of abnormal condition on the normal contact force is not so significant for the case of Fig. 13, but obvious in their flow patterns and flow fields.
Effect of AGD beams on solid flow
With the installation of two parallel AGD beams, the cross-sectional area varies in a complicated manner, which could affect the burden descending behaviour. Figure 15 presents the effect of AGD beams on solid flow patterns in COREX SF under discharging rate of 0.251 kg s− 1. For the SF without AGD, uniform descending occurred in the upper shaft and bustle zone, ‘U’ shape profile below the bustle level and ‘W’ shape discharging through the outlets. The solid flow patterns in the plug flow zone of the upper shaft is almost not affected by AGD beams, but it is not the case in the bustle zone. Comparing the patterns in the bustle zone, it experiences a relatively uniform descending through the radial for the case without AGD. However, an area with significantly rapid descending behaviour is observed below the gap between the beams in new design SF, as shown in Fig. 15b . On the contrary, slow moving zones are observed above the beams. Therefore, the solid flow patterns in the new design SF with AGD beams would experience ‘wave’ profile abovethe beams and rudiment of ‘W’ shape below the beams. These changes show that the AGD beams influence the particle uniform descending in the bustle zone.
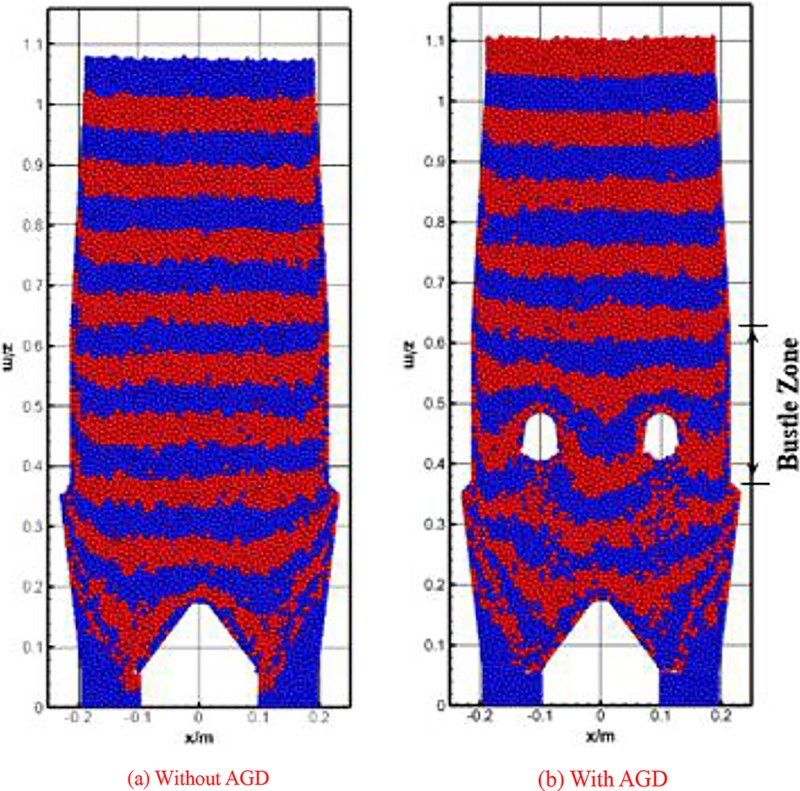
Effect of AGD beams on solid flow pattern, a without and b with AGD
The examination of the microscopic structure of solid flow such as force structure is very useful to understand the complex solid flow behaviour and its underlying mechanisms. Figure 16 shows the effect of AGD beams on distribution of normal contact force. From Fig. 16a , it can be observed that particles exhibit weak force network near the outlet regions (labeled in red rectangle). The main reason is that the particles in this zone flow fast, and there exist more voids and disconnections among particles. The large normal force exists at top of the manmade dead zone (labelled in red circle).This is because particles need to support the particles above them. However, for the furnace with AGD, large normal contact force is observed above the beams and also at the top of the manmade dead zone, where scaffold may be formed. On the contrary, relatively low normal force regions are observed under the AGD beams, which is due to the support to the upper particles by beams. Figure 17 presents the probability density distribution of normal contact force in bustle zone of SF with or without AGD. One can see that the curve moves to right with the introduction of AGD beams, reflecting the stronger particle–particle contact. This result corresponds to the fact that, with AGD installed, slowly moving zones are formed above the beams and more particles keep direct contact and strong interaction force. Meanwhile, the probability of small normal force increases with AGD installed, which is reflected on the left part of these curves. The main reason is due to the fact that triangle shaped free areas are created under the beams, and particles near the channels would experience weak force. These changes show that the introduction of the two beams increases the complexity of normal force distribution. The quite large normal force in local regions above the beams enhances the clustering problem in bustle area.
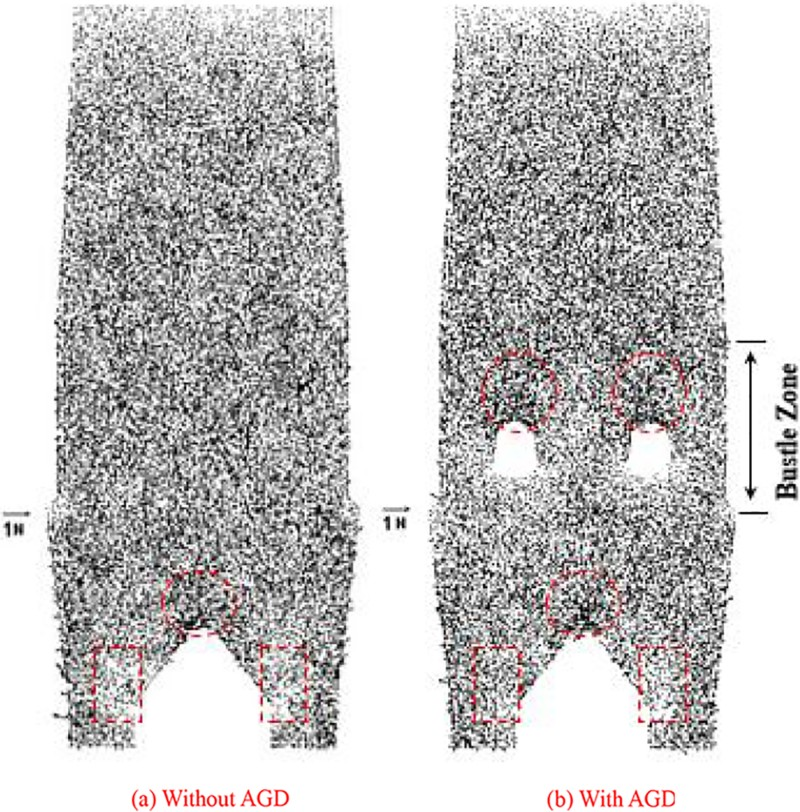
Effect of AGD beams on distribution of normal contact force, a without and b with AGD
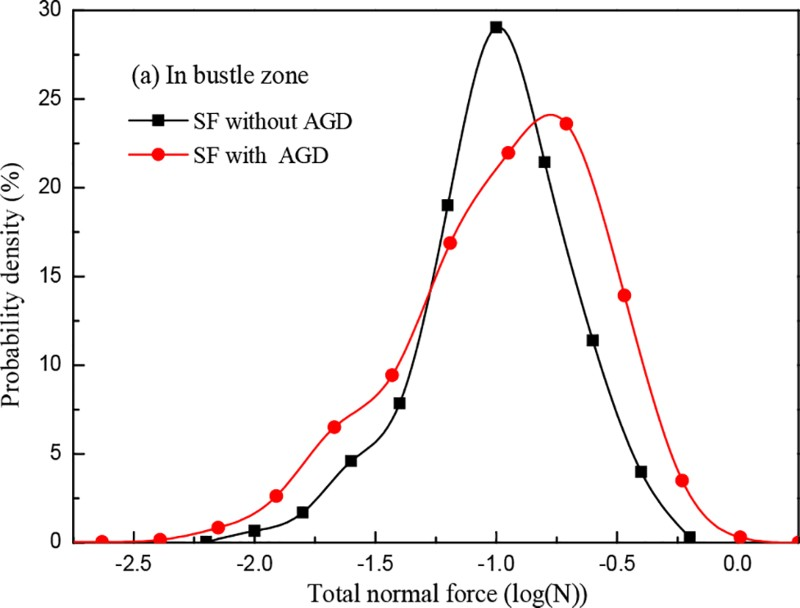
Probability density distribution of normal contact force in bustle zone
Conclusions
Analyses of solid flow in new design COREX SF with AGD are carried out with DEM simulation. The simulation model is validated by comparing computed results with published experimental data. Variation of solid flow caused by different conditions and the effect of AGD on burden descending behaviour are simulated. The following conclusions are obtained.
1. The internal flow structure in SF with AGD can be divided into four distinct zones, including manmade dead man, plug flow, funnel flow and quasi-stagnant zone. Solid flow profile in the shaft shows a clear flat → wave → W type evolvement. Triangle shaped void is created under AGD beams by angle of repose, and the void is the main channel for the reducing gas blasted into shaft centre.
2. Increasing the discharging rate has an effect of decreasing the quasi-stagnant zone size, but does not affect the macroscopic motion of particles and of the flow pattern above the bustle. The cross-section of AGD channel increases with the increase in the discharging rate.
3. Under the abnormal condition that no burden is discharged from the left outlet, the solid flow pattern is significantly changed, and the normal force distribution shows a sensible difference between the left and the right half of the SF. While for the case with different discharging rates, the microscopic analysis shows that the effect of abnormal condition on the force distribution is not significant but obvious on the flow patterns.
4. The solid flow in SF without AGD shows a flat → U → W pattern and uniform descending occurs in the bustle zone. However, the solid flow pattern in SF with AGD experiences a ‘wave’ and rudiments of ‘W’ shape in this region. Areal gas distribution beams influence the uniform descending in the bustle zone. Besides, the introduction of two beams increases the complexity of normal force distribution. The quite large normal force in local regions above beams aggravates the clustering problem in the bustle area.
Areal gas distribution is a new technique of COREX-3000 SF. It has been proven to modify gas distribution and improve reduction efficiency of iron ore in practice. However, as discussed above, it affects the solid flow significantly. Further simulation will be carried out to investigate the optimisation design of AGD beams, such as the optimisation of cross-section structure, cross layout of two beams, single beam and so on, in a three-dimensional actual size model. This will also take into account the effect of geometric design of screws on solid flow. Work on these aspects is in progress and will be reported hopefully in the near future.
Footnotes
Acknowledgements
The authors would like to thank the National Key Technology R&D Program during the ‘12th Five-Year Plan’ of China (grant no. 2011BAE04B02) and the National Natural Science Foundation of China (grant no. 51174053) for their financial support.