
Abstract
In the present study, the effects of Al content on the evolution of inclusions formed in Fe–16Mn–xAl–0.6C high Mn TWIP steels were investigated experimentally and discussed based on the thermodynamic calculation with FactSage. The results showed that with the increase of Al content from 0.002 to 2.1 wt-% in the steels, the evolution route of the main oxide inclusions is MnO → Al2O3 → MgAl2O4 → MgO, the main sulphide inclusion is changed from MnS to MgS, and the dominant stable inclusion changes along the route of MnO → Al2O3/MnS → MnS → AlN. The main inclusion types in thermodynamic calculation results with FactSage are consistent with the observed results in the present experimental steels.
Introduction
With the increase demand for high quality steels for automobile production, 1 the automobile industry is facing higher steel requirements (which accounts for ∼70% of car weight). 2–3 The high Mn twin induced plasticity (TWIP) steels, which show good mechanical properties, such as high strength, excellent ductility and high energy absorption capacity, have received considerable attention in recent years. 4–6 The addition of Al into TWIP steels not only reduces the specific weight but also increases the stacking fault energy. 7–9 Furthermore, the Al addition also effectively suppresses delayed fracture in press formed parts. 10–15 Up to now, three main types of high manganese TWIP steel (Fe–Mn–C, Fe–Mn–Al–C and Fe–Mn–Al–Si) have been extensively investigated. 16 The typical Al content in the Fe–Mn–Al–C system is 1.5 wt-%. 17–18 Since the Al addition has many advantages, the Fe–Mn–C system is gradually being replaced by the Fe–Mn–Al–C system; thus, it is necessary to investigate the evolution of inclusions in the process.
At present, the research on high Mn TWIP steel has mainly focused on the effect of heat treatment on mechanical properties and the fracture mechanism, 19–20 and studies on inclusion and inclusion precipitation behaviour in high Mn TWIP steel have been rarely reported. Gigacher et al., 21 Grajcar et al. 22 and Park et al. 23 have investigated the inclusions in 0.05C–15(∼25)Mn–3Al–3Si and Fe–xMn–yAl (x = 10, 20 wt-%, y = 1, 3, 6 wt-%) steels respectively, and they revealed that the inclusions are classified into seven types according to chemistries and morphologies: (i) single Al2O3 particles, (ii) single AlN or AlON particles, (iii) MnAl2O4 single galaxite spinel particles, (iv) Al2O3(-Al(O)N) agglomerate, (v) single Mn(S,Se) particles, (vi) oxide core with Mn(S,Se) skin (wrap), and (vii) Mn(S,Se) core with Al2O3(-Al(O)N) aggregate (or bump). Park et al. 23 also investigated the effect of Al content on the volume fraction of inclusions and found that when the Al content is 3 wt-%, the volume fraction of inclusions in steel is the maximum.
Although some research has been conducted to investigate the inclusion formation in high Mn TWIP steels for different component systems, the study on the effect of Al content on the formation and evolution of non-metallic inclusions has not been reported. Therefore, the formation and evolution behaviour of inclusions in Fe–16Mn–xAl–0.6C TWIP steel containing different Al contents were studied. The thermodynamic calculations for the inclusion formation were also performed for the further understanding of the inclusion evolution behaviour.
Experimental
High Mn TWIP steel preparation
The sample steels were produced as follows: (i) electrolytic iron, electrolytic manganese (>99.9 wt-% purity reagent grade), carbon powder and aluminium powder were melted in a 50 kg vacuum induction furnace (Fig. 1) to produce a nominal composition of Fe–16Mn–xAl–0.6C (x = 0.002, 0.033, 0.54, 2.1 wt-%) alloys. In addition, a small amount of CaO was added into the vacuum induction furnace as a slag former. (ii) During melting, the furnace was first evacuated to 500 Pa and then filled with pure argon gas to 66 kPa. The crucible used in the experiment was MgO crucible, which contains >99 wt-% MgO. (iii) After the Fe–Mn–Al–C alloys were melted at 1873 K, small samples (φ40 × 80 mm) were obtained through the observation hole for analysing the contents of C, Mn and Al in the molten steel. (iv) Then, the compositions of the molten steels were adjusted and confirmed accurately according to the above analysis results. (v) Finally, the molten steel was poured into a casting mould and then naturally cooled in the air.
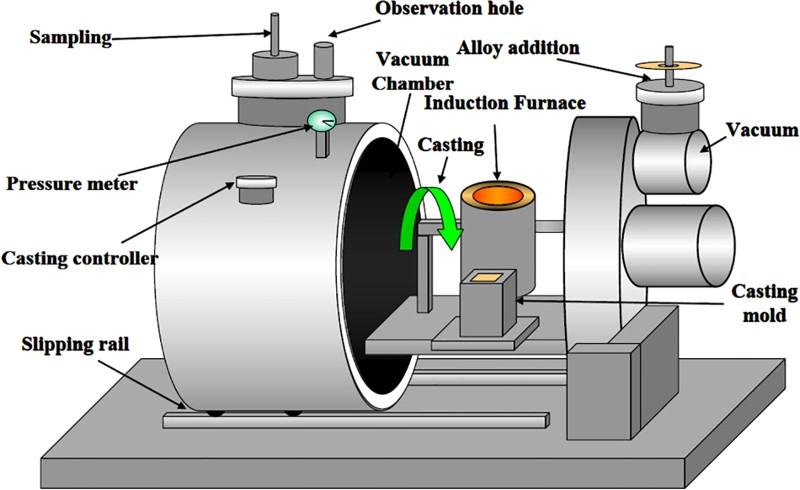
Schematic figure of experimental apparatus
Chemical analysis and microscopic observation
After the ingots were completely cooled, samples with the size of 20 × 20 × 10 mm were cut from the longitudinal planes of symmetry of ingots, at the positions of 1/4 of longitudinal and transverse directions. Then, the contents of Mn, total Al and soluble Al in the samples were determined using inductively coupled plasma atomic emission spectroscopy. The contents of O and N in the samples were analysed by non-scattered infrared ray detector after being extracted by the gas impulse melting method. The contents of C and S in the samples were analysed by high frequency infrared absorption method. Table 1 shows the chemical compositions of the samples.
Chemical compositions of steels/wt-%
After standard polishing procedure for metal graphical analysis, the numbers, types, chemical compositions, morphologies and size distributions of the residual particles on the polished cross-sections of the samples were analysed using a scanning electron microscope (SEM; EVO MA25, Carl Zeiss, Oberkochen, Germany) attached with an automated EDS (energy dispersive spectroscopy; Oxford Instruments, UK), which was programmed to detect non-metallic inclusions of an area of 10 × 10 mm2. The programme also provided EDS mapping of inclusions with regards to elemental analysis set at 15 kV, 15 mA and with 10 mm working distance.
For further interpretation of the formation mechanism of inclusions, FactSage thermochemical software was used to perform the thermodynamic calculations of the steels.
Results and discussion
Change of chemical compositions of steels
The chemical compositions of the steels are shown in Table 1, where the contents of Al vary from 0.002 to 2.1 wt-%; the contents of C, Mn, P and N remain nearly constant; and the contents of S and O in steels decrease with increase of Al content. When the Al is 0.002 wt-%, the contents of S and O in steel are 0.0034 and 0.0015 wt-% respectively. When the Al is 2.1 wt-%, both contents of S and O are < 0.0005 wt-%. The decrease of O content is caused by the increase of Al content. With the decrease of O content, S in the molten steel can be removed to a lower content by reaction with CaO. In addition, MgO in the crucible can be reduced by Al to generate the dissolved Mg in the molten steel, which promotes the reaction between S and Mg. Thus, the content of S is decreased with the increase of Al content.
Compositions and morphologies of inclusions in high Mn TWIP steels
The inclusions in each steel sample were analysed using a SEM equipped with an automated EDS, and the numbers of inclusions that were analysed in steels H000, H003, H054 and H210 are 3019, 2089, 3138 and 4067 respectively.
Steel containing 0.002 wt-% Al
The typical inclusions in steel H000 are single MnO particles, single MnS particles, complex MnO/MnS particles and complex Al2O3/MnS particles, as shown in Figs. 2 and 3. The complex Al2O3/MnS particles are mainly composed of irregular Al2O3 in the centre with MnS peripheral (Fig. 3).
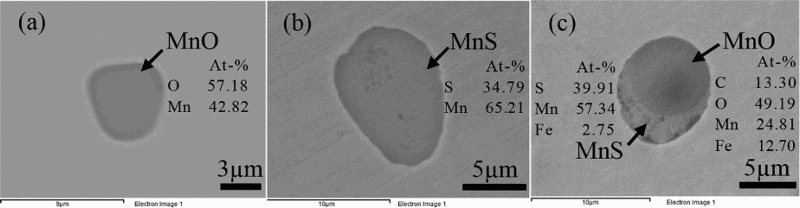
Morphologies and chemical compositions of inclusions: a single MnO particle, b single MnS particle and c complex MnO/MnS particle in steel H000
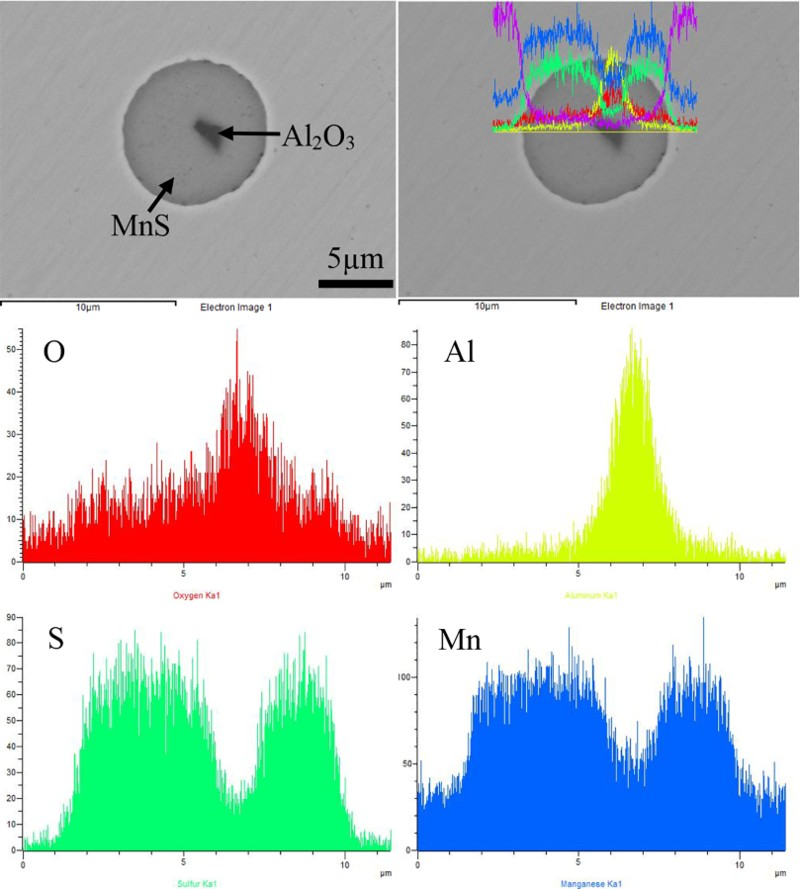
Morphology and line scanning result of complex Al2O3/MnS particle in steel H000
Steel containing 0.033 wt-% Al
The typical inclusions in steel H003 are single MnS particles, single Al2O3 particles, complex Al2O3/MnS particles and complex MnO/MnS particles. The morphology and chemical composition of MnS in steel H003 is similar to those of MnS formed in steel H000. However, the single Al2O3 particles are first formed in steel H003, and the size of Al2O3 in the core of the complex Al2O3/MnS particles in steel H003 is larger than that in steel H000, as shown in Fig. 4.
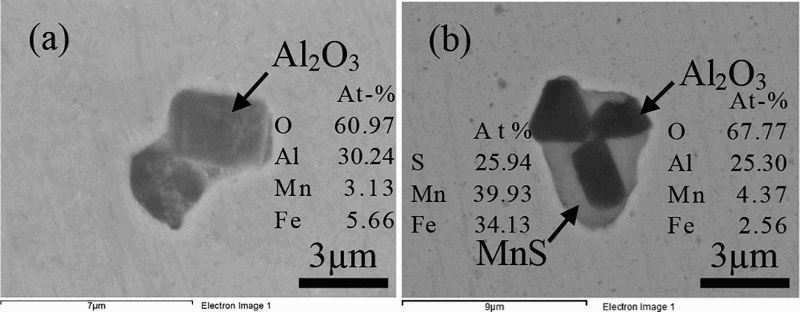
Morphologies and chemical compositions of inclusions: a single Al2O3 particle and b complex Al2O3/MnS particle in steel H003
Steel containing 0.54 wt-% Al
Compared with steel H003, the results of scanning micrographs and EDS spectra reveal that the main types of inclusions in steel H003 and H054 are similar to each other, which contain single MnS particles, single Al2O3 particles and complex MnS/Al2O3 particles. However, there are some Mg containing inclusions formed in steel H054, which include complex MgAl2O4/MnS particles and complex MgAl2O4 particles. Typical Mg containing inclusions are shown in Fig. 5. The AlN particles are first formed in steel H054.
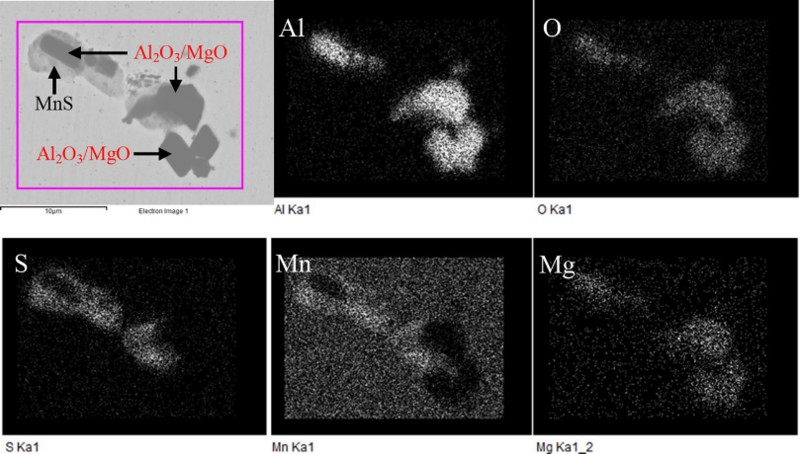
Mappings of typical Mg containing inclusion in steel H054
Steel containing 2.1 wt-% Al
For the 2.1 wt-% Al content sample, there appears a sudden change in the inclusion types. The main inclusion type in steel H210 is single AlN particles. Other inclusions in steel H210 are single MgO particles, single MgS particles and some complex particles such as AlN/MgO/MgS. Figure 6 shows the morphologies and chemical compositions of single particles in steel H210. Figure 7 shows the morphology and line scanning result of complex AlN/MgO/MgS particles.
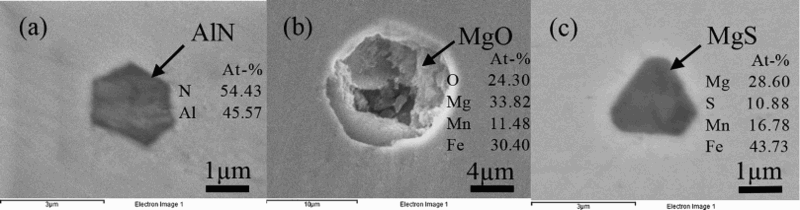
Morphologies and chemical compositions of single particles: a AlN, b MgO and c MgS in steel H210
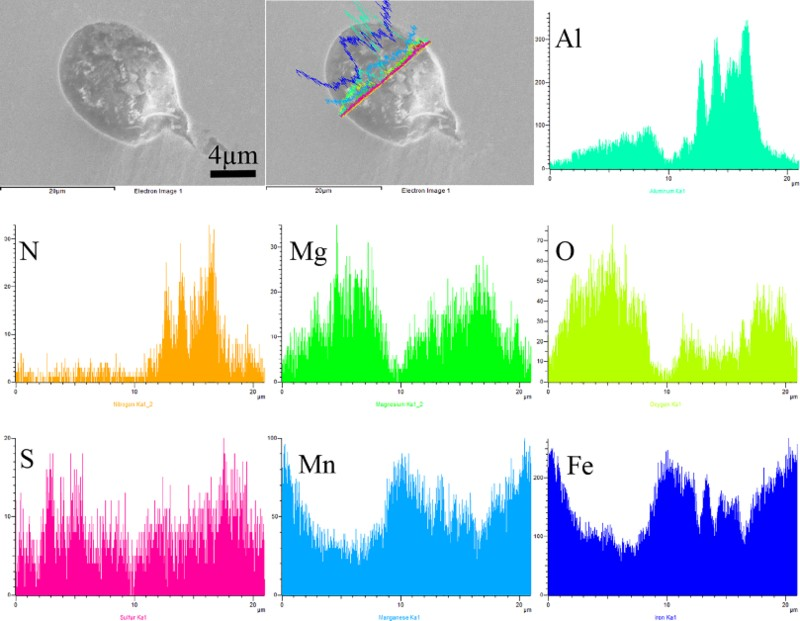
Morphology and line scanning result of complex AlN/MgO/MgS particle
Number density and size distribution of inclusions
Figure 8 shows the change of number density and average size of inclusions with Al content. It can be observed that when Al changes from 0.002 to 0.54 wt-%, the number density of inclusions increases from 46 to 63 mm− 2. However, when Al reaches 2.1 wt-%, the number density of inclusions decreases from 63 to 56 mm− 2.
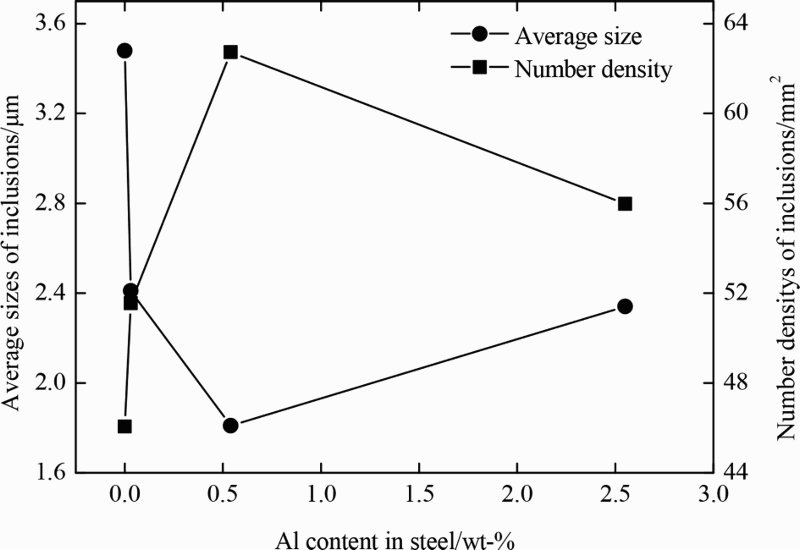
Change of number density and average size of inclusions with Al content
Meanwhile, the average size of inclusion decreases from 3.48 to 1.81 μm when Al increases from 0.002 to 0.54 wt-%; however, when Al content reaches 2.1 wt-%, the average size of inclusions increases to 2.34 μm. The reason for the change will be illustrated in the ‘Thermodynamic calculation results and discussion’ section from the thermodynamic calculation results.
The size distributions of inclusions in steels with different Al contents are shown in Fig. 9. It is seen that there are quite a few inclusions larger than 6 μm in steel H000, and the average size of inclusion reduces with the addition of Al, where most of inclusions are smaller than 4 μm as shown in steels H003, H054 and H210.
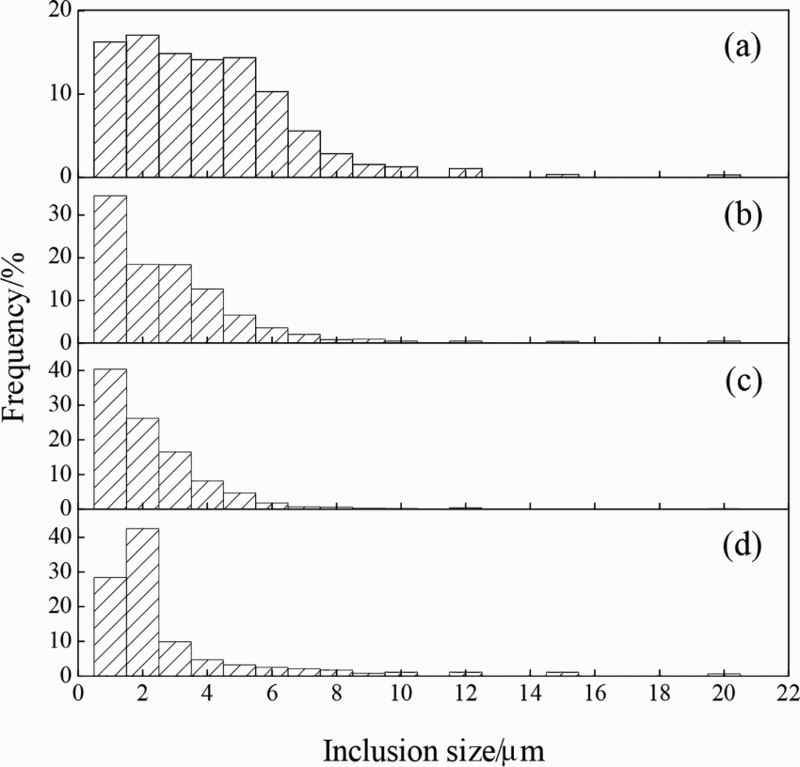
Change in size distribution of inclusions with Al content in steels a H000, b H003, c H054 and d H210
In steel H000, the inclusions sizes are mostly distributed in the range of 0–6 μm, with the frequency of 86.7%. The frequency of inclusion sizes in the range of 0–4 μm decreases to 62.3%. However, the frequency of inclusions with the size larger than 7 μm is 7.5%, which is higher than those of other steels.
In steel H003 and H054, the size distributions of inclusions are basically consistent, and the sizes of inclusions are mainly distributed between 0 and 4 μm, with frequencies of 84.0% in steel H003 and 91.2% in steel H054 respectively. In steel H210, the frequency of inclusions sizes in the range of 0–4 μm decreases to 85.6%.
Figure 10 shows the relationship between Al content and the area ratio of inclusions in the steels. The area ratio first decreased with the addition of Al and then increased. When Al changes from 0.002 to 0.54 wt-%, the area ratio of inclusions decreases sharply from 0.068 to 0.03%. When Al content reaches 2.1 wt-%, the area ratio of inclusions increases to 0.058%. The reason will be illustrated in the ‘Thermodynamic calculation results and discussion’ section.
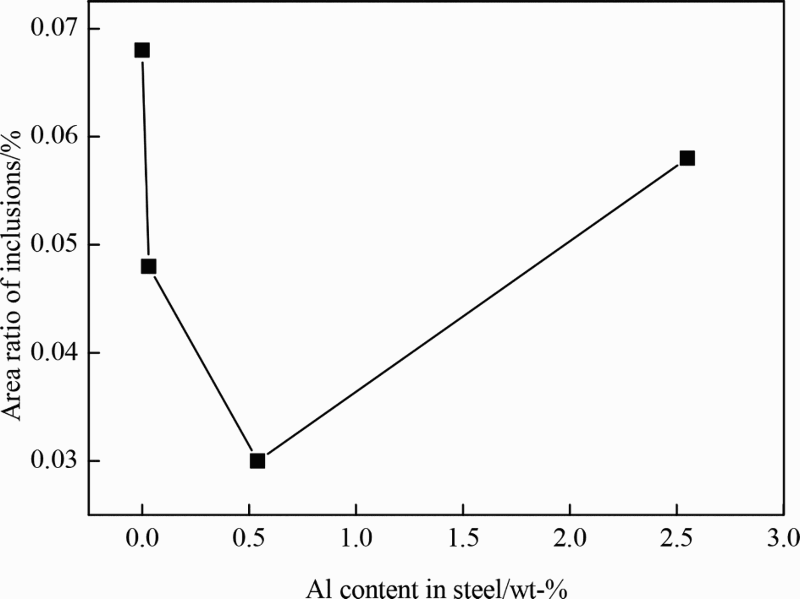
Relationship between Al content and area ratio of inclusions in steels
Effect of Al content on evolution of inclusion types
Figure 11 shows the average compositions of inclusions in the steels H000, H003, H054 and H210. As seen in Fig. 11, average Al content gradually increases in the inclusions with the increase of Al content in the steels and then decreases when Al content reaches 0.54 wt-%. This variation of Al content in the inclusions is due to the deoxidisation ability of Al in molten steel. Jung et al. 24 revealed that when the dissolved Al content in molten steel reaches 0.05 wt-% at 1873 K, it has the strongest deoxidation ability. Therefore, when the Al content is 0.03 wt-% in steel, its deoxidation ability is stronger than those with the Al contents of 0.002 and 0.54 wt-%; thus, it has the higher average Al content in the inclusions. In contrast, when the Al content in steel is further increased to 2.1 wt-%, AlN tends to be formed, which can be clearly identified in the variation of the average N content in the inclusions. The formation of large amounts of AlN inclusions accounts for the increase of the average Al content in the inclusions when Al content reaches 2.1 wt-% in the steel.
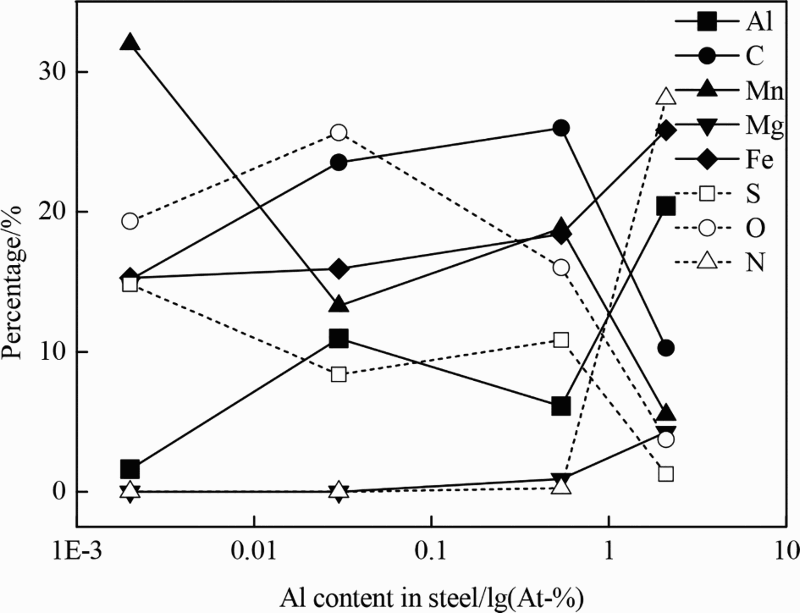
Change in average composition of inclusions with Al content
The inclusions formed in the Fe–16Mn–xAl–0.6C high Mn TWIP steels can be classified into 14 types according to their compositions. Figure 12 shows the evolution of inclusion types in the steels. When the Al content is 0.002 wt-% (sample H000), the oxide inclusions are mainly MnO and also contain a small amounts of Al2O3, whereas the sulphide inclusions are mainly MnS. The frequencies of MnO, MnS and complex MnO/MnS inclusions are 36.22, 24.74 and 35.37% respectively.
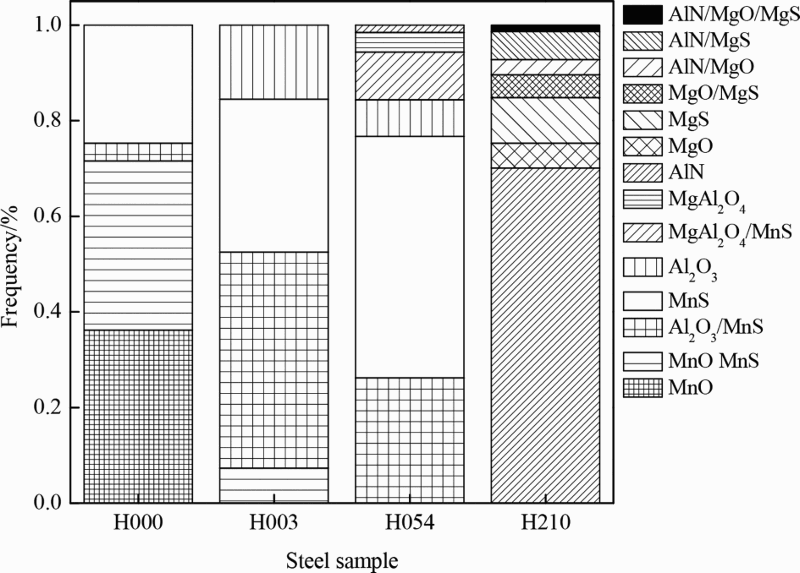
Evolution of inclusion types in steels
When the Al content reaches 0.03 wt-% (sample H003), the oxide inclusions change from MnO to Al2O3, whereas the sulphide inclusions are still MnS. Compared with steel H000, the frequency of complex Al2O3/MnS inclusions greatly increases from 3.68 to 45.19%.
When the Al content changes to 0.54 wt-% in the steel (sample H054), the inclusion types are similar to those in steel H003. The main inclusion types are Al2O3, MnS and complex Al2O3/MnS inclusions. However, compared with steel H003, the frequency of MnS inclusion increases from 31.98 to 50.51%, and the oxide inclusions change from Al2O3 to MgAl2O4. The variation is because the reaction between the added Al with MgO in the crucible generates Mg that is dissolved in the molten steel.
When the Al content reaches 2.1 wt-%, the main inclusions are AlN, the oxide inclusions change to MgO and the sulphide inclusions become MgS. The reason will be illustrated in the next section.
As shown in Figs. 11 and 12, with the increase of Al content in steel, the evolution of the dominant oxide inclusions is MnO → Al2O3 → MgAl2O4 → MgO. The evolution of the sulphide inclusions is MnS → MgS. In addition, the evolution of the main inclusion type is MnO → Al2O3/MnS → MnS → AlN.
Thermodynamic calculation results and discussion
Generation of dissolved Mg in steels
There is no Mg addition in the smelting process of the steels; however, Mg in the steel H210 reaches 0.0038 wt-% due to the reaction of the added Al with MgO in the crucible. In addition, the average Mg content in the inclusions is 4.26 wt-% in H210, whereas it is only 0.92 wt-% in H054. There are no Mg containing inclusions in the samples of H000 and H003. As shown in Table 1 and Fig. 11, the Mg contents in the inclusions and steels increase gradually with the increase of Al addition.
To investigate the generation of the dissolved Mg and the Mg containing inclusions, thermodynamic calculation of the reaction of Al and MgO has been carried out. The reduction of MgO by Al takes place in two stages.
25
At the first stage, the MgO is reduced to produce dissolved Mg and MgAl2O4 spinel.

At the second stage, the spinel is further reduced by Al.

Thus, the reaction of Al and MgO can be expressed by the following equation.
On the present conditions, 

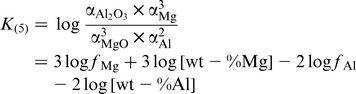


Table 2 shows the interaction coefficients of elements at 1873 K. When the Al content is 2.1 wt-%, the theoretical equilibrium value of Mg content in steel is 0.044 wt-%. However, the actual Mg content in steel is only 0.0038 wt-%. The main reason is that the boiling point of Mg is ∼1380 K, 29 and thus, the actual equilibrium content of Mg in steel will be greatly reduced at 1873 K due to the fast evaporation rate of Mg from the melt surface. Therefore, in steels H000 and H003, there are no Mg containing inclusions. In steel H054, only a small number of Mg containing inclusions begin to appear, which is mainly MgAl2O4. When Mg content in steel reaches 0.0038 wt-%, many Mg containing inclusions are formed in steel H210, which are mainly MgS and MgO.
Interaction coefficients (
) of elements at 1873 K
Note: the unlabelled interaction coefficients are from Chen. 26
Thermodynamic calculations results with FactSage
In the present study, FactSage thermodynamic software 30–31 was used for the thermodynamic calculations for the evolution of inclusions in the above steel samples. The FTmisc database, FToxid database and FSstel database were employed for the calculation of above samples respectively.
The variation of different inclusion phases was calculated from FactSage 6.4 thermodynamic software using the ‘Scheil–Gulliver cooling’ option, and the results are presented in Fig. 13. Figure 13a shows the precipitation of inclusions in steel H000 during solidification. Since the Mg content in the steel is < 0.0002 wt-% that reaches the instrument detection limit, Mg is not taken into account in the calculation process. Table 3 shows the liquidus temperature and the formation temperature of inclusions in the steels. As shown in Fig. 13a and Table 3, the oxide phase of MnO/Al2O3 is formed at 1854 K, whereas MnS is initially formed at 1512 K.
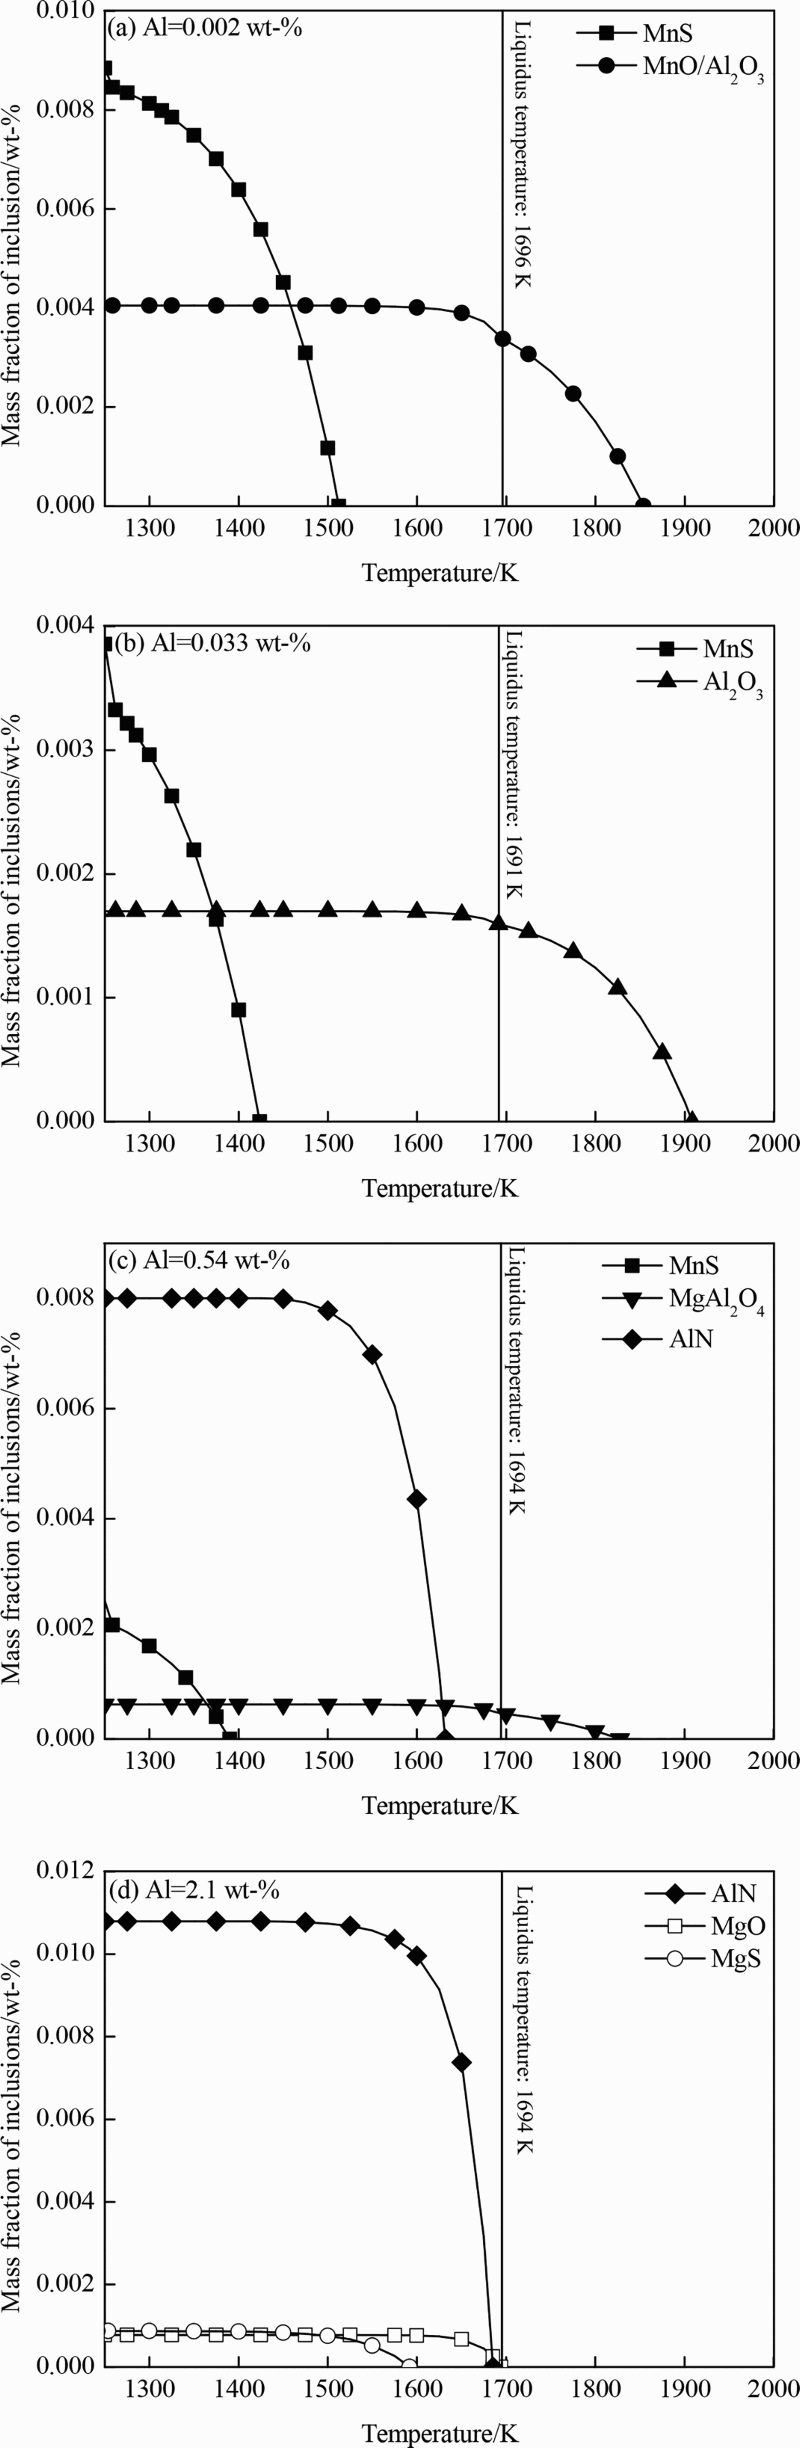
Evolution of inclusions during solidification, calculated from thermodynamic databases a H000, b H003, c H054 and d H210
Liquidus temperature and precipitation temperatures of inclusions in steels
From Fig. 13a , one can see that the oxide phase is MnO/Al2O3 and the sulphide phase is MnS in steel H000. The calculation results are in good agreement with the experimental observation results, except that the MnO and Al2O3 are respectively observed in the experimental results.
Figure 13b shows the evolution of inclusions in steel H003 during solidification. It is shown that the inclusions in steel H003 are MnS and Al2O3. The only difference between the calculation results and experimental observation results is that small amount of MnO is precipitated in the steel H003. This is because the reaction of the dissolved Al and O does not reach the equilibrium during the solidification.
Figure 13c shows the evolution of inclusions in steel H054 during solidification. The inclusions in steel H054 are AlN, MnS and MgAl2O4. The calculation results are in good agreement with the experimental observation results, except for some single Al2O3 particles in the experimental observation results.
From Table 3, it is seen that the precipitation temperature of MnS decreases with the increase of Al in the steels, which is caused by the decrease of S content in the steels. This can explain why the average size and the area ratio of inclusions decrease and the number density of inclusions increases with the increase of Al content in the steels H000, H003 and H054. Since a large part of the inclusions are MnS containing inclusions, higher precipitation temperature should promote the growth of MnS containing inclusions during solidification under the same cooling conditions.
Figure 13d shows the evolution of inclusions in steel H210. At the temperature of 1694 K, MgO begins to precipitate. When the temperature decreases to 1685 and 1592 K, AlN and MgS begin to precipitate respectively. The inclusions in the steel sample H210 are AlN, MgS and MgO. It should be noted that the precipitation temperature of AlN increases with increasing Al content in steel. The calculation results of the steel H210 are in good agreement with the experimental observation results.
The main inclusions in the steel H210 are AlN. The precipitation temperature of AlN is relatively high, which can promote the growth of AlN. Thus, compared with steel H054, the average size and area ratio of inclusions increase, whereas the number density of inclusions decreases.
It should be noted that the dissolved Mg in the steels is generated by the reaction between the dissolved Al in the molten steel with MgO in the crucible. The use of an MgO crucible during the vacuum induction melting of high Al TWIP steel can bring Mg containing inclusions. In addition, the content of N in the high Al TWIP steel should be minimised to reduce the mass fraction of AlN. These impurities could affect the mechanical properties of the high Al TWIP steel.
Conclusions
The effects of Al content on the evolution of inclusions in Fe–16Mn–xAl–0.6C high Mn TWIP steels were investigated by experiment and thermodynamic calculation, and the following conclusions were obtained: The inclusions formed in the Fe–16Mn–xAl–0.6C high Mn TWIP steels can be classified into 14 types according to their chemical compositions. With the increase of Al content from 0.002 to 2.1 wt-% in the steels, the dominant stable inclusions change along the route of MnO → Al2O3/MnS → MnS → AlN; the evolution of main oxide inclusions is MnO → Al2O3 → MgAl2O4 → MgO; the main sulphide inclusions change from MnS to MgS. With the increase of Al content from 0.002 to 0.54 wt-%, the number density of inclusions increases from 42 to 63 mm− 2, the average size of inclusions decreases from 3.48 to 1.81 μm, and the area ratio of inclusions decreases from 0.068 to 0.03%. When the Al content in steel reaches 2.1 wt-%, the number density of inclusions decreases to 56 mm− 2, the average size of inclusions increases to 2.34 μm, and the area ratio of inclusions increases to 0.058%. The dissolved Al can react with MgO in the crucible to generate the dissolved Mg in the molten steel, and the Mg content calculated with thermodynamic increases with Al content. Thus, there are a lot of Mg containing inclusions including MgO, MgS and complex AlN/MgO/MgS inclusions in steel H210. The main inclusion types in thermodynamic calculation results with FactSage are consistent with the observed results in the present experimental steels. The precipitation temperature of AlN increases with increasing Al content in the steels. In addition, the precipitation temperature of MnS decreases with decreasing S content.
Footnotes
Acknowledgement
The financial support from Baosteel Group Corporation is greatly appreciated.