
Abstract
Burden distribution in a blast furnace is vital to its smooth running. However, it is difficult to directly measure the burden distribution for an operating blast furnace. Therefore, mathematical models have been applied to guide the charging process to achieve the desired burden distribution. The accuracies of such models depend on the prediction of falling curve, stockline profile formation, and burden descent mode. In this study, a new stockline profile formation model is proposed in which new equations have been developed for the inner and outer repose angle by considering the influence of the burden flow's vertical and horizontal velocity at the apex of the stockline profile. Validation of this new stockline profile formation model is provided through comparison between calculated results and experimental data for stockline profile. A stepped burden descending strategy, in which the burden would descend through a specified distance after each ring charging process, is proposed corresponding to the successive charging process. The influence of the burden descending strategy on the falling point, the final burden profile and radial depth ratio of ore to coke is also analysed. The result shows that the burden descending strategy greatly affects the final burden distribution, especially in the peripheral region.
Introduction
The iron making blast furnace is a huge counter-current heat exchanger and chemical reactor, in the upper part of which the burden (consisting of layered iron ore as well as coke) meets an ascending gas during its descent. 1 The gas flow pattern, which plays an important role on stable and efficient blast furnace operation, is largely controlled by the burden distribution due to differences in permeability and density of the charged materials. 2,3 In order to achieve the optimised furnace condition, it is important to predict and control the burden distribution.
The classical force theory 5,6 is more widely utilised for predicting burden distribution in operation, compared with the empirical model, 4 discrete element method 7 and neural networks. 8 It is composed of five movement processes, i.e. discharging from the hopper, sliding along the rotating chute, free falling from the chute tip, stacking on the previous burden to form a new burden profile, and descending to form the entire burden structure. In the previous studies, stacking and descending are treated as two independent processes arbitrarily. 9–15 The procedure performs the stacking process ring by ring with a static bottom burden until the sum of the accumulated layer agrees with the total charging volume, and then calculates the descending process and renews the shape of the accumulated layer. Actually, the burden descending behaviour continues throughout the whole iron making process. The arbitrary treatment mentioned above damages the continuity of the charging process and may cause considerable error of the falling point (FP) for stacking process and finally influence the accuracy of the modelled burden structure.
The stockline profile formation model, which is essential for the process of determining the top burden profile during stacking process, greatly influences the prediction of the burden distribution. A key input for this model is the inner and outer repose angle of the raw material layer. Several models 9–17 have been proposed to predict the stockline profile during stacking process, in which the inner and outer repose angle were approximately treated as a function of the burden's natural repose angle, the chute angle, the depth of the falling curve and the radius of the impact point. However, during actual stacking process, the shape of the burden profile formed by the stacking material is closely related to the burden's inherent properties and falling states. The latter depends greatly on the chute angle, the depth of the falling curve and the radius of the impact point.
In this study, new equations for the inner and outer angle of repose will be developed using the burden's vertical and horizontal velocity at the apex of the stockline profile since the kinetic energy of the burden during stacking process has a vital effect on the burden profile 9 and thus leads to the fundament of the new stockline profile formation model. A stepped burden descending strategy, in which the burden would descend through a specified distance after each ring charging process, is proposed to combine the stacking and descending process together in order to maximise the continuity of the charging process. The influence of the continuity on the final burden distribution is also analysed.
Burden distribution model and calculating strategy
Falling curve model
This model is based on the balance of forces on a single particle and has been widely utilised to describe the trajectory of the raw material from the chute to the impact point of the stockline profile. The movement of raw material includes discharge through the hopper, sliding along the rotating chute and free fall from the chute tip. A more detailed description can be seen in a previous study. 11
Novel stockline profile formation model
Raw material falling on the stockline to form a ring shaped heap is shown in Fig. 1a and b .
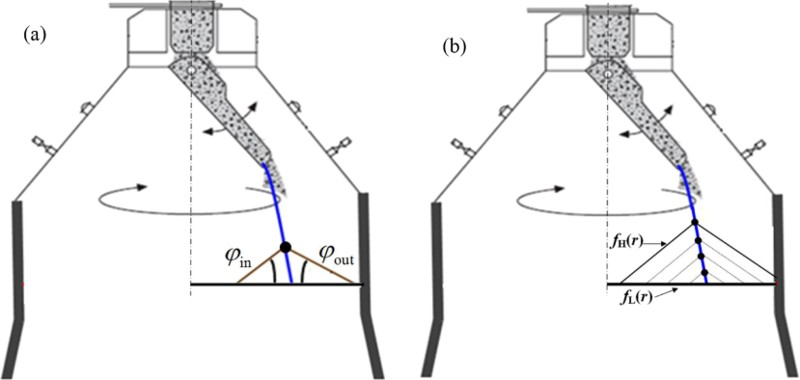
a stock profile formation
It is known that the shape of the burden profile formed by the stacking material is closely related to the burden's inherent properties (natural repose angle,
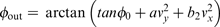
The new stockline profile model assumes: The cross-section of the heap is assumed to be triangular, with the apex of the triangle on the falling curve trajectory. The shape of the triangle is determined by the inner angle of repose ( The distortion and collapse of the burden are neglected; The volume of burden layer is conserved during stockline formation and burden descent; The stacking process is mainly affected by the kinetic energy of the burden, namely, the square of the burden's velocity in the apex of the stockline profile; The vertical velocity (v
y
) has the same influence on the inner and outer repose angle, while the difference between these two angles is caused by the horizontal velocity (v
x
).


Shi et al.
21
compared the predicted results for several previous stockline profile formation models with experimental data and found that the following model is of minimum error:


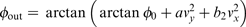
Referring to equation (1), the repose angle in the new stockline profile formation model is shown as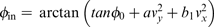


Burden descending model
In this study, solid flow in the upper shaft is assumed to follow potential flow (PF), where the solid velocity is represented as a gradient of a stream function 


Despite its simplicity, PF is known to predict the flow of solid in the shaft part with reasonable confidence. 1
Stepped strategy for burden descending
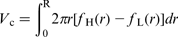
The burden descending process in the previous calculation always performs after the batch stacking process, which is not corresponding to the successive charging process. In this study, the burden will descend through a specified distance after each ring stacking process. The descending velocity is assumed to be constant; thus, the descending volume during the ring charging process (V
r
) can be defined as
MATLAB is used to program the algorithm for burden distribution simulation. The algorithm of the stepped strategy is shown schematically in Fig. 2. At the beginning of the programme, the parameters of the blast furnace, including furnace geometry, charging matrix, properties of the raw material, chute size, location of the chute suspension point, and the location and profile of the initial burden surface, are entered.
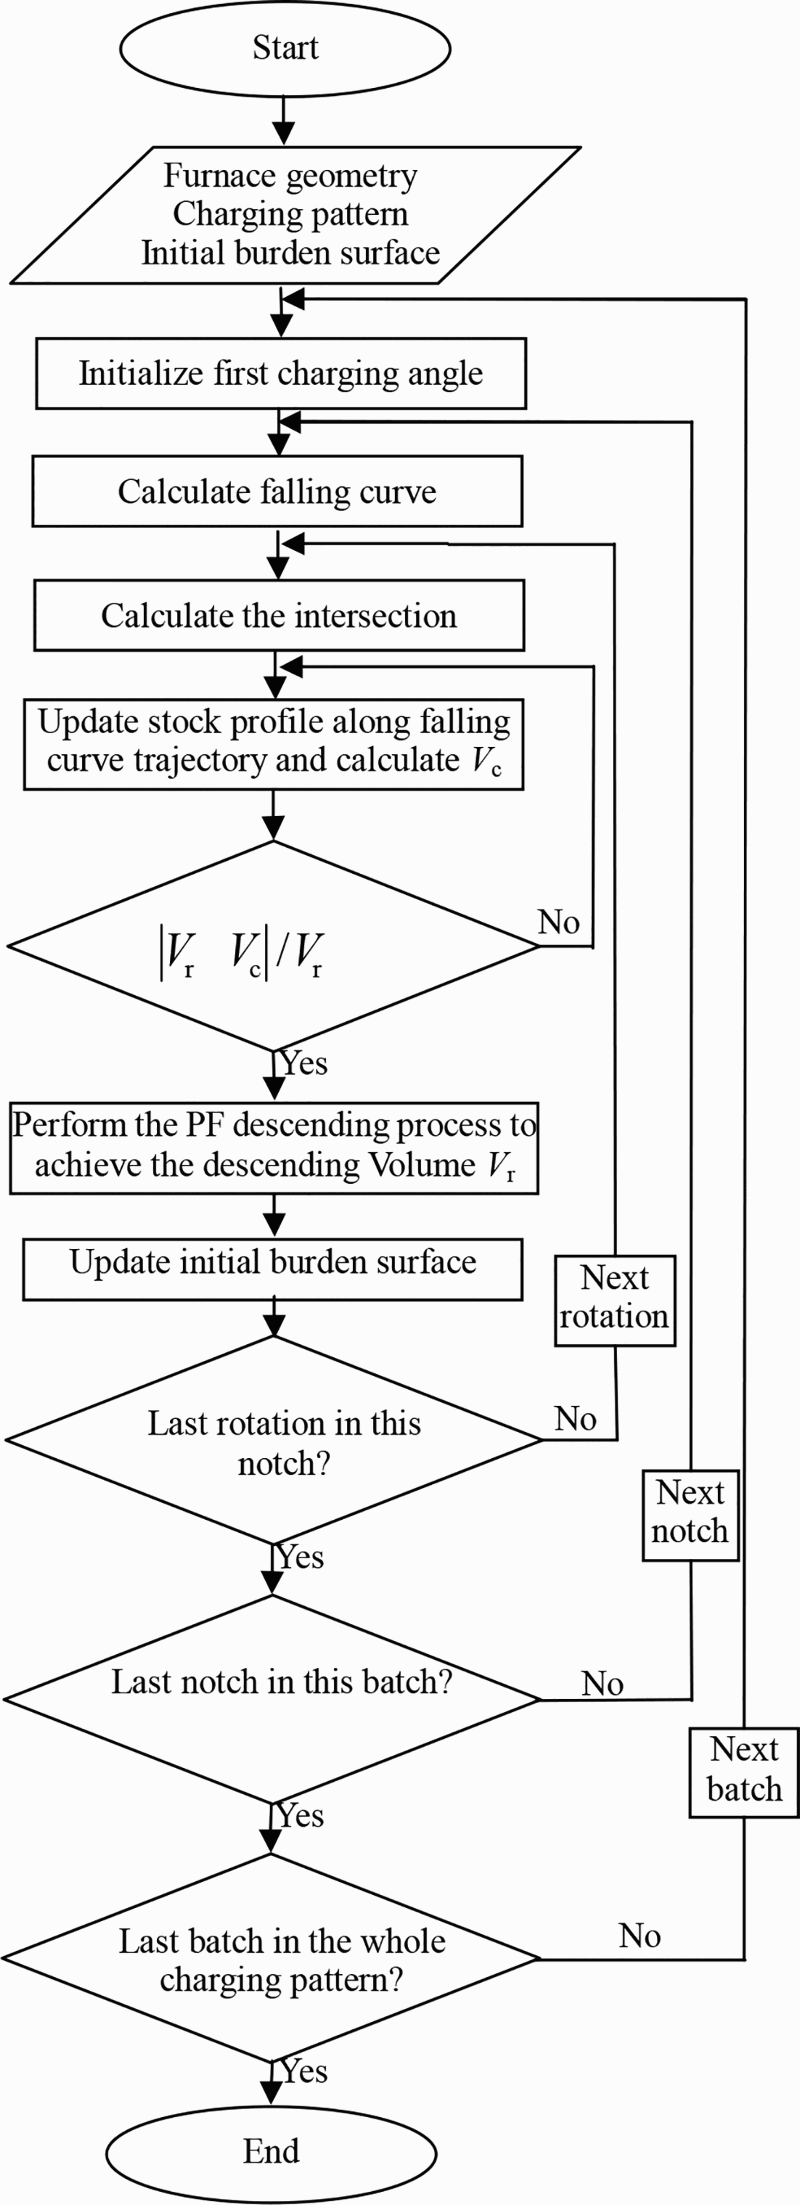
Schematic of calculation procedure for stepped descending strategy
Results and discussion
Experimental data
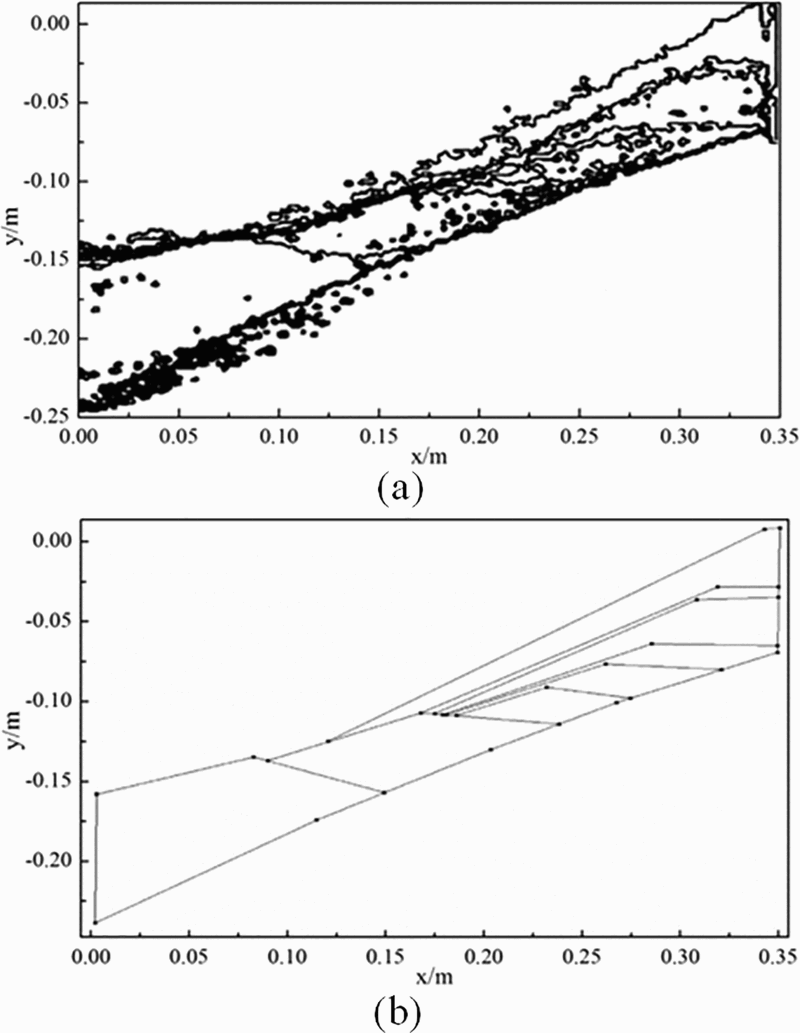
The experimental data of the coke layer from the work of Jiménez et al. 18 are employed to validate the falling curve and stockline profile formation model in this work. Table 1 represents the charging pattern employed in the scaled charging pattern. The pictures of the layer profile after each dump were taken with the charge coupled device camera. The boundary of each ring in the picture is obtained by a reconstruction algorithm as shown in Fig. 3a , 18 and the outline of each ring is digitalised into piecewise linear profile as shown in Fig. 3b . 21 The detailed information of each pile top in Fig. 3b was calculated by the image processing programme with MATLAB as shown in Table 2.
Charging pattern for coke and ore in scaled model 18
Data of coke layer
Validation of falling curve model
The calculated falling curve trajectory of each ring and the measured location of the pile top are shown in Fig. 4. In general, the calculated falling curves agree well with the measured pile tops since all the pile top of the coke layer lie on the corresponding falling curves. Comparisons indicate that the mathematical model can predict the falling curve with acceptable accuracy.
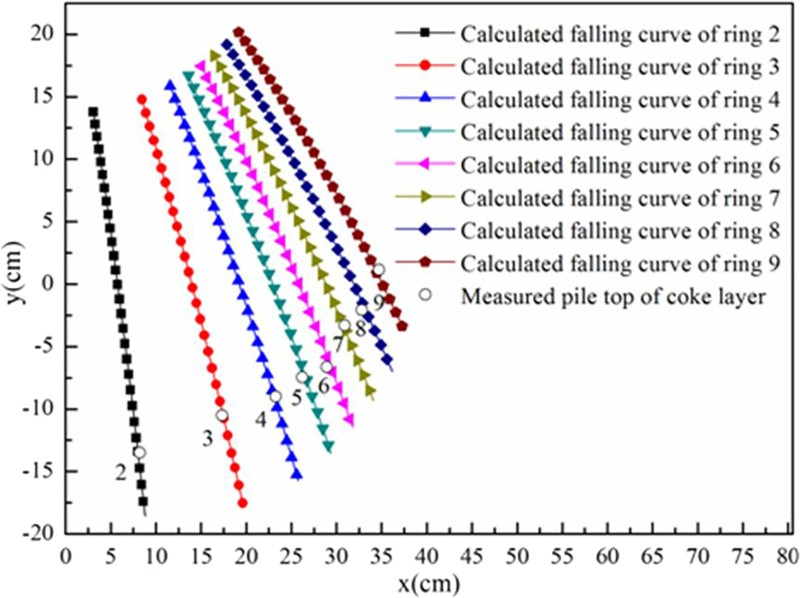
Calculated falling curve and measured pile top location of coke layer
Validation of stockline profile formation model Parameter determination of stockline profile formation models
The parameters in equations (1)–(4) are fitted by least square estimation method in terms of data of Table 2 and are listed in Table 3. It should be noted that the outer repose angle in the last ring is less than zero, which indicates that the near wall part burden profile in this ring is up-inclined. This phenomenon often occurs in the last few rings in which the width of burden flow expands, 19 and part of the raw material may easily meet a collision with the furnace wall before stacking. The initial profile also has a great influence on the stacking process. Concave initial profile may easily cause collapsing and creep phenomenon. This may be the reason that caused an up-inclined direction of the near wall part burden profile in the last ring since there exists a concave initial profile for the last ring as shown in Fig. 3a . In general, the negative repose angle, which is not accepted in normal stacking process, will not be used to parameterise the stockline profile formation model.
Parameterisation of stockline profile formation models
Validation of stockline profile formation model
The stockline profile is formed by successive charge rings with fixed initial profile. The initial profile specified for the simulation of different stockline profile formation model is identical with the stockline profile obtained by the experiment. 18 The development of the stockline profile that is calculated by the above two stockline profile formation models and the measured final profile of the coke layer are shown in Fig. 5.
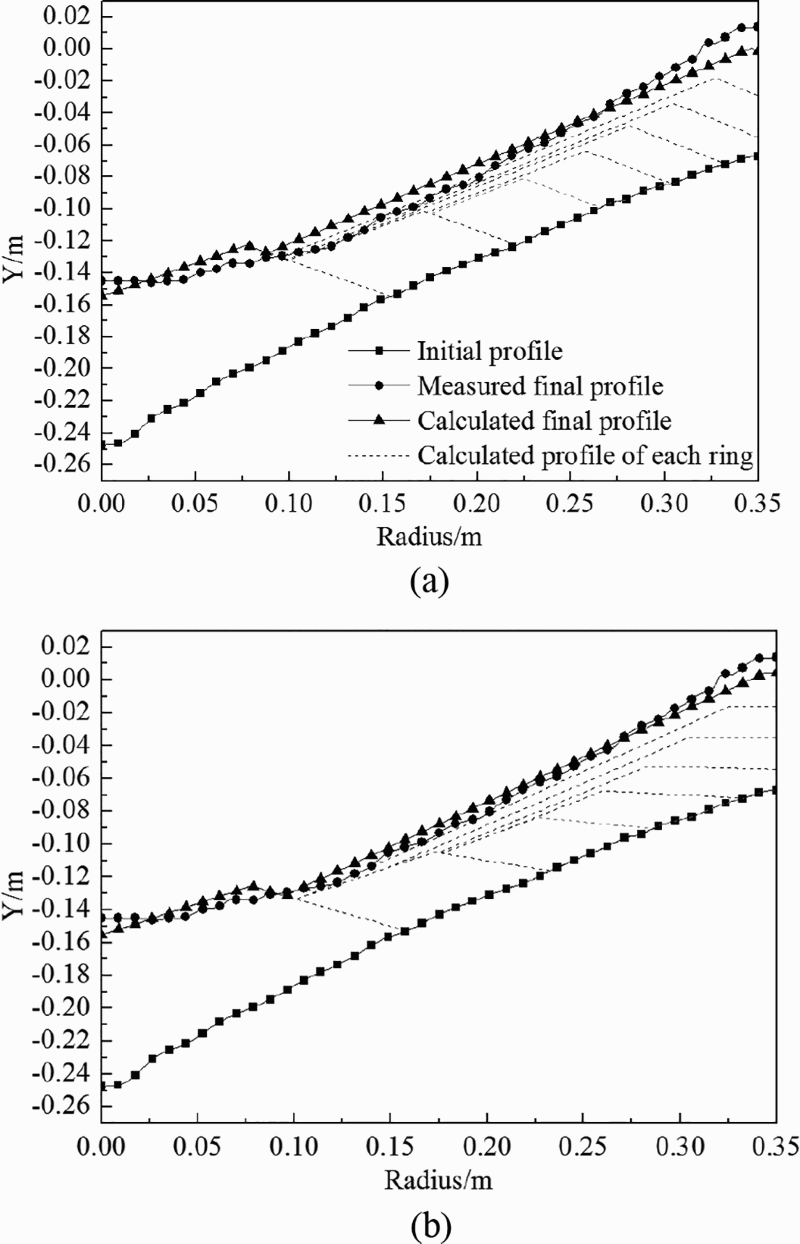
a coke layer calculated by previous study. b coke layer calculated by new model
In Fig. 5, both models predict the overall shape of the measured profile well while the new stockline profile formation model shows increased accuracy. The coke layer modelled in the previous study results in considerable error in the middle [R ∈ (0.1 m,0.2 m)] and peripheral [R ∈ (0.3 m,0.35 m)] region, while in the new model, the error in these region is effectively cancelled.
To quantitatively evaluate the error between the experiment and calculated results along the radius direction, the burden profile evaluation error is established as follows: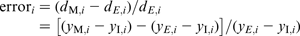
Quantitative error of layer thickness
Effects of burden descending strategy on final modelled results
The entire burden profile was compared according to the descending strategy. Table 5 lists the three different cases of descending strategies, among which the descending volume (peer loop) and time step gradually increase from case 1 to case 3, whereas the corresponding model continuity decreases gradually.
Burden descending strategy used for analysis model
n
i
represents the total number of rotations in the ith batch, n
b represents the total number of batches per whole charging pattern. Since there is always a coke charging batch and an ore charging batch in the charging pattern, n
b is equal to 2 generally. Some approximate treatment on the furnace geometry and the charging pattern are made as follows: The stacking and descending process of the top two layers (the ore layer and the coke layer) is assumed to be accomplished in the furnace throat region where the diameter of the furnace remains constant during the charging process. As it had been mentioned in the ‘Parameter determination of stockline profile formation models’ section that the outer repose angle in the last coke ring is less than zero, which often occurs in the last few rings in which the width of burden flow expands,
19
part of the raw material may easily meet a collision with the furnace wall before stacking. The previous experiment performed the stacking process with a fixed bottom layer. The falling curve may grow longer and worsen the collision phenomenon with the consideration of the burden descending phenomenon during the stacking process. In this section, the chute angle of the charging pattern mentioned in the ‘Experimental data’ section is decreased by 0.05 rad in each ring to avoid the collision phenomenon.
Despite its simplification, the treatments mentioned above still enable us to investigate the influence of the burden descending phenomenon during stacking process on the final burden distribution in a way that is difficult to achieve in the previous burden distribution model. The effects of the burden descending strategy on the final modelled results such as the FP, the top burden profile and the depth ratio of ore to coke are analysed in the following sections.
Effects of burden descending strategy on FP
Figure 6 shows the calculated FP of different descending strategy. The FP of the coke layer in case 3 is not mentioned in Fig. 6a since it is essentially the same as case 2. It is clear that from case 1 to case 3, the calculated FP in each chute inclination angle increases gradually, especially in the ore layer. Significant discrepancy of the FP in the peripheral region may cause considerable calculating error for both the coke and ore layer in this region as shown in Fig. 7.
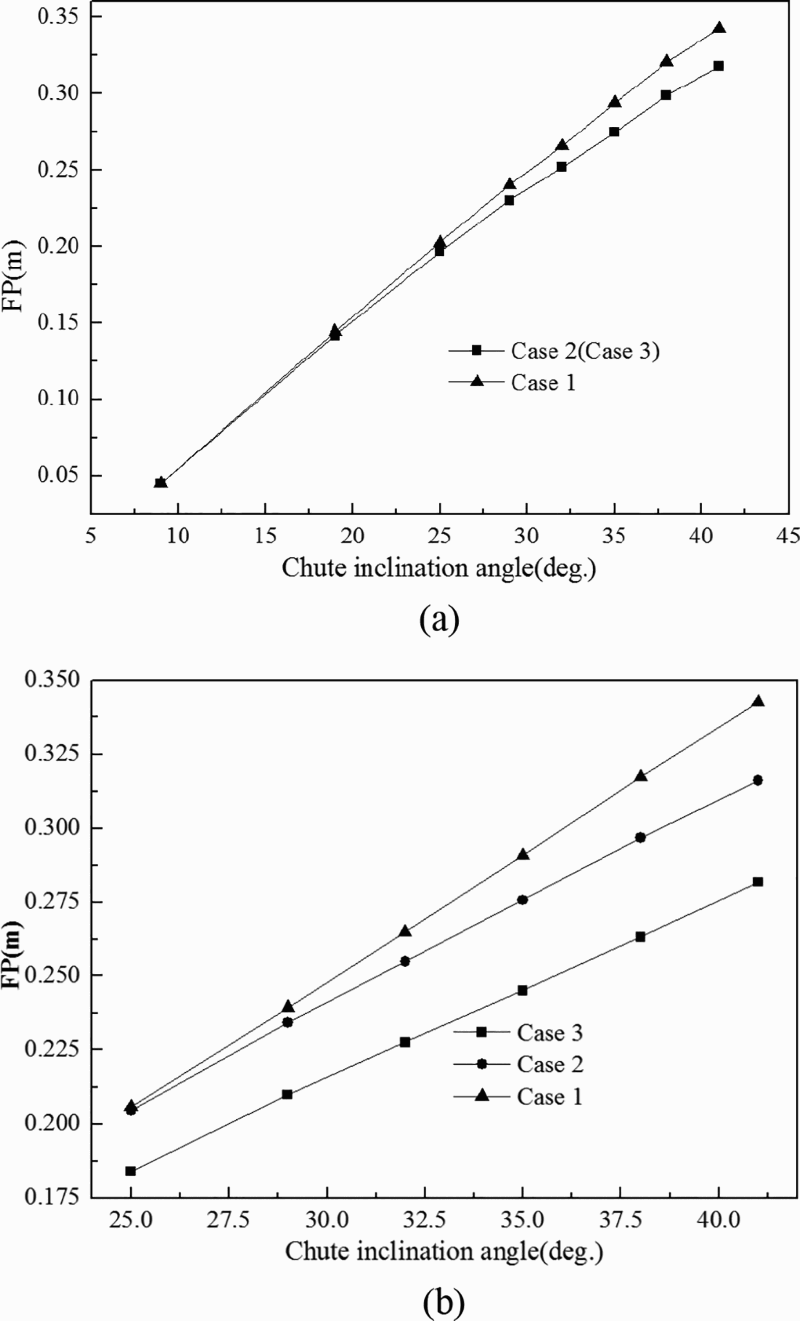
a FP calculated for coke layer. b FP calculated for ore layer
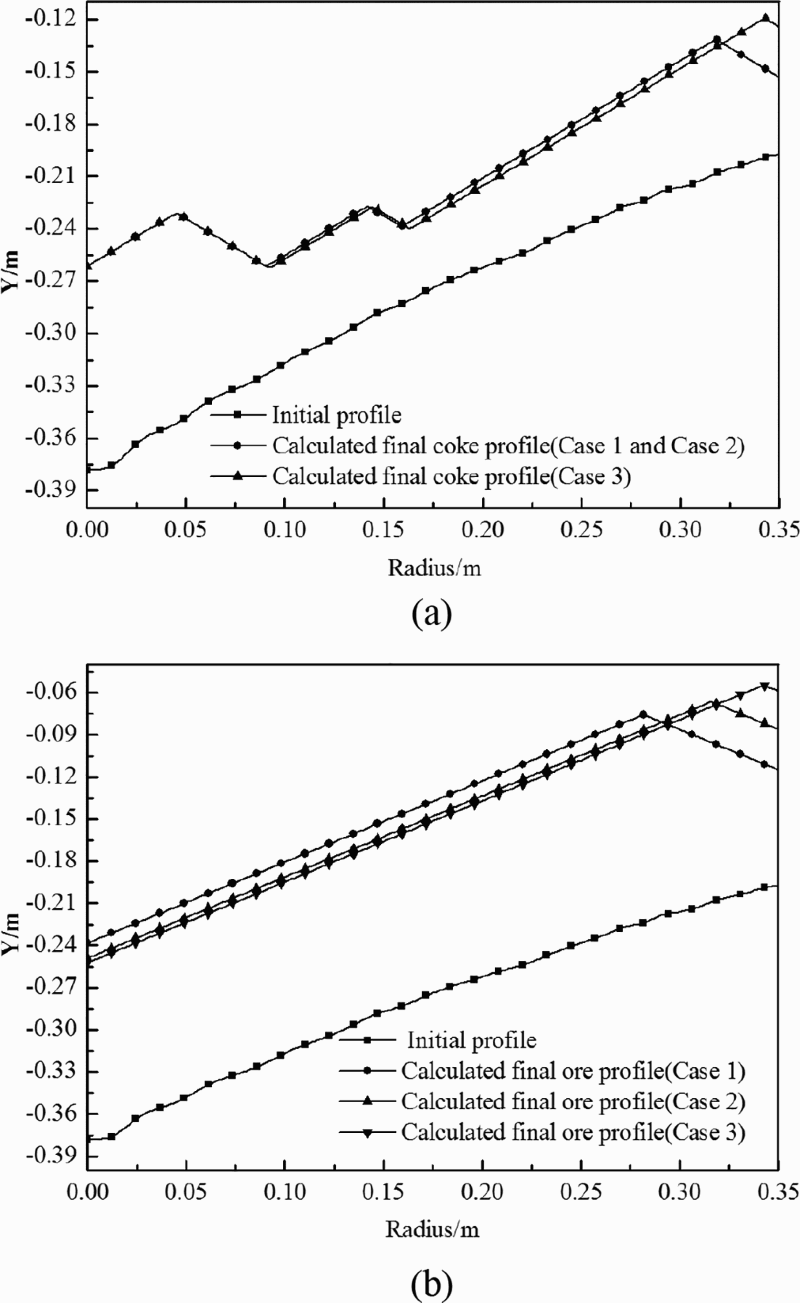
a calculated final burden profile of coke layers. b calculated final burden profile of ore layers
Effects of burden descending strategy on top burden profile
Figure 7 shows the top burden profile for both coke and ore layer. It is clear that the burden descending strategy has great influence on the burden structure, especially in the peripheral region. Raw material trends to sweep to the near wall region with decreasing time step of the burden descending strategy. Thus, a lower level of the near wall burden profile calculated with the previous burden descending strategy (case 2 or case 3) may be caused compared with the experimental result. The phenomena can be obtained in the previous work by Radhakrishnan and Ram. 20
Effects of burden descending strategy on radius Lo/Lc distribution
Figure 8 shows the radius Lo/Lc distribution in different cases. The distribution trends of the radius Lo/Lc in different cases are basically the same, while significant difference occurs in local areas. In the centre region [r/R ∈ (0,0.4)], the burden descending strategy has no significant influence on radius Lo/Lc distribution since there exists no great difference between the Lo/Lc curve of case 2 and case 3. The main difference between these modelled results is in the middle [r/R ∈ (0.45,0.8)] and peripheral [r/R ∈ (0.9,1.0)] region. As for the middle region, Lo/Lc decreased significantly with decreasing time step. The difference of Lo/Lc value between case 1 and case 3 remains ∼0.2 in this region. While in the peripheral region, Lo/Lc increased rapidly from case 1 to case 3. The relative calculation error between case 1 and case 3 is ∼30%, which may significantly impact the calculation of the gas–solid flow in this region. Since the Lo/Lc curve plays a huge part in the guidance of the charging process and burden descending strategy greatly influences the Lo/Lc ratio, an appropriate burden distribution model with stepped burden descending strategy is essential for the accurate evaluation and optimisation of the charging procedures.
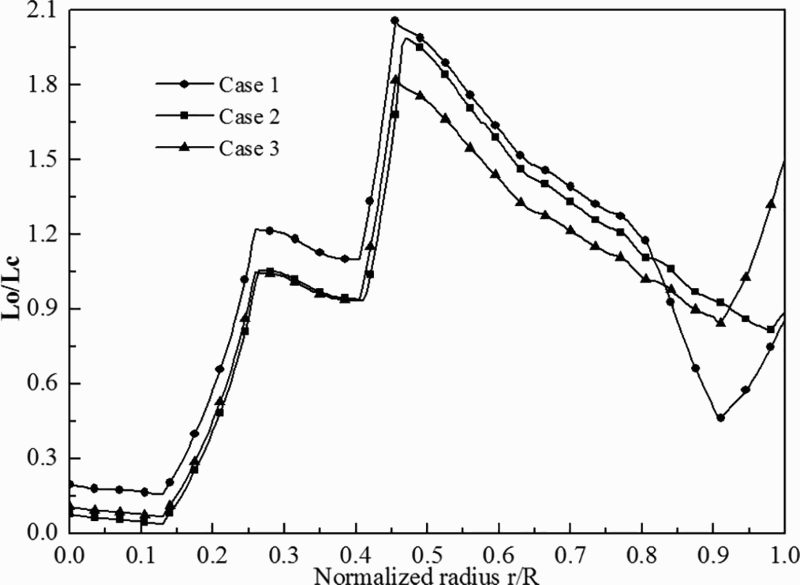
Radius Lo/Lc distribution of different case
Conclusions
In this study, new stockline profile formation model is proposed as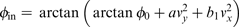
A stepped burden descending strategy, in which the burden would descend through a specified distance after each ring charging process, is proposed to reproduce the burden descending phenomenon during stacking process. The influence of burden descending strategy to the burden structure is also analysed. The major findings are listed below. The calculated FP in each chute inclination angle increases with increasing model continuity of the burden descending strategy (from case 3 to case 1), especially in the ore layer; The burden descending strategy has great influence on the burden structure, especially in the peripheral region. Raw material tends to sweep to the near wall region with increasing model continuity; The model continuity has significant influence on radius Lo/Lc distribution in the middle [r/R ∈ (0.45,0.8)] and peripheral [r/R ∈ (0.9,1.0)] region. An appropriate burden distribution model with stepped burden descending strategy is essential for the accurate evaluation and optimisation of the charging procedures.
Footnotes
Acknowledgements
This work was financially supported by the National Natural Science Foundation of China (grant no. 61290325).