
Abstract
Plastic flow is never a continuous process either in time or in space, yet it continues to be modelled in this way. In this review, plasticity is discussed from the perspective of self-organised criticality (SOC). The following topics are discussed: slip bands and models for them; how crystallographic is slip?; distributed sources and collective motion of dislocations; the triumph and the failure of the Taylor model; long range stress does not contribute directly to the flow stress, so the forest rules; the perils of coarse-graining and the relationship between smoothed engineering variables and intermittently fluctuating physical variables; work-hardening of a slip band; what controls the structure of slip bands?; interpretation of precursor and exhaustion phases; relationship to other recent theories; consequences which follow from a sound theory of plastic flow. Brief appendices present algebraic results for slip bands modelled as ellipsoids.
Keywords
Stress–strain curves of ductile single crystals
Engineering plasticity concerns itself with the geometrical analysis of metal deformation, taking as a starting point an empirically measured stress–strain curve of the metal under specified loading conditions, usually a tensile test. The theory is highly developed and widely used to predict the forces and the energy required in metal forming. Engineering plasticity does not consider crystal structure. It does not usually feature the Burgers vector, nor any other material length, so that the patterns of plastic flow it produces are scale independent. Although engineering plasticity plays a central role in designs for metal forming operations, studies of plasticity on the submicrometre scale show that plastic properties depend upon scale. Furthermore, there are certain general features of metal deformation, for example, creep and fatigue, better understanding of which promises to rationalise the metallurgical design of alloys, as well as to describe scale-dependent plastic behaviour.
The most fundamental problems concern single crystals. Here plastic flow produces a bewildering complexity of microscopic dislocation structures, yet there is a marked pattern of overall stress–strain behaviour. Figure 1 shows schematically the results of tensile tests on ductile single crystals, presented both as shear stress on the operative slip system, here denoted by σ, versus engineering (asymmetrical) shear strain, eP, usually taken from the measured tensile strain resolved onto the operative system. One expects to find stage I (easy glide, hardening rate ΘI = dσ/deP≈μ/3000), stage II (strong linear hardening ΘII≈μ/300), stage III, quasi-parabolic stress versus strain, but rising to a stress limit where the hardening is exhausted (ΘIII→0). Here, μ is an elastic shear modulus, which along with Poisson's ratio ν, is chosen to give correctly the elastic energies per unit length of edge and screw dislocations.1 The tensile strain is limited by plastic instability caused by the reduction in work hardening following the onset of stage III. This produces necking followed by ductile fracture. However, in compression and in torsion instability is suppressed and one finds stage IV with a low hardening rate, comparable to or less than stage I. This behaviour is found in all ductile crystal structures: face-centred-cubic and body-centred-cubic, as well as in semiplastic materials oriented for ductility, for example, NaCl structures compressed along the cube axis. It is not found in crystals incapable of secondary slip, that is, those lacking slip systems which intersect the primary system, for example, hexagonal crystals gliding on the basal plane. These crystals show an extended stage I that does not lead to the strong hardening of stage II. Stage I ends with a stage B associated with twinning and a higher work hardening rate, but still much less than stage II in cubic crystals.2 The fact that the strong hardening of stage II is related to secondary slip intersecting the primary system has been known since the work of Schmidt and Boas3 and the name for the obstacles these secondary dislocations present to the motion of the primary dislocations is the dislocation forest, a term coined by Cottrell.4 It is now clear that stage II hardening is caused by the forest. Although the strain range of stage II is limited, usually to no more than 50 strain, its existence confers substantial ductility at a high stress in a tensile test. Without the linear hardening of stage II, the ultimate tensile stress and the strain to failure of ductile metals would be very much smaller.
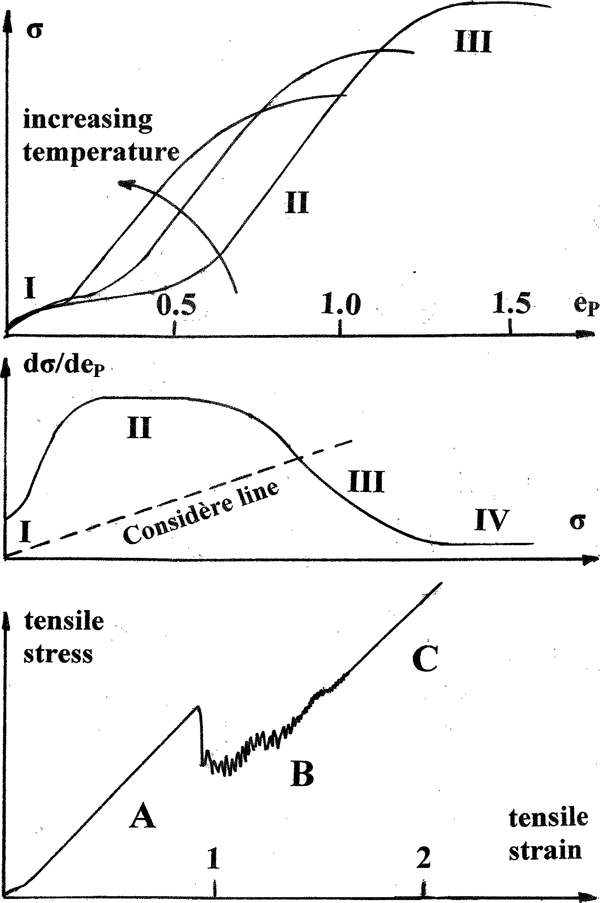
Top plot shows schematic stress–strain curves in tension, and centre plot the hardening rate versus stress. The Considère line, shown broken, marks the limit of tensile stability. Hardening rates below the line can be observed only in compression. Bottom plot shows the sequence of stages when twinning is prominent. Figure published with permission from Springer
There are many complications. An important feature is the onset of deformation twinning at low temperatures and high stresses. The most recent investigations of single-crystal plasticity are those of Niewczas and colleagues, summarised in his detailed review.5 He uses the nomenclature shown in Fig. 1c: stage A comprises all strain before the onset of discontinuities in stress (yield drops); stage B displays intermittent flow in which each yield drop initiated at approximately constant stress is associated with the formation of a macroscopic twin; and stage C in which the twinned volume fraction stabilises at ∼70 and the hardening resumes at about the same rate as in stage II. This behaviour is probably quite general, but can be observed only in restricted circumstances. Twinning requires a high applied stress. In face-centred metals it competes with the onset of stage III and the resulting tensile instability. Only if the onset of stage III occurs at a high enough stress, because of low test temperature or alloying, can twinning be observed.
We now turn to the dependence of plastic behaviour upon crystal orientation, testing temperature, size effects, and alloying.
Crystal orientation
All calculations of stress and strain are based on standard formulae in Schmidt and Boas,3 using notation explained in Appendix A. As the initial orientation of the tensile axis is chosen to lie from one strongly favouring a single slip system to one in which multiple slip can occur, there are two main effects: the slope of stage II increases, and the extent of stage I decreases. A very complete study by Takeuchi6 shows that for temperatures around room temperature the range of strain for stage I is nearly zero for orientations activating six or eight systems, but ∼0·12 for single slip. It is largest for those favouring four systems, ∼0·25. These results confirm and quantify many previous studies, particularly the pioneering studies of Diehl7 and Blewitt et al.8 At higher temperatures, stage I is greatly diminished. It is important to point out that the end of stage I does not coincide with the advent of multiple slip as judged by the progressive rotation of the tensile axis during the test. For example, in a single slip orientation, the tensile strain required to enable double slip is 0·6, whereas the strain at the end of stage I is ∼0·12. The rotation of the tensile axis, calculated using standard formulae in Schmidt and Boas,3 is confirmed by X-ray diffraction. The rotation is almost completely accounted for by single slip. Therefore, it seems unlikely that slip induced directly by the applied stress on secondary systems is responsible for the limited strain in stage I, but it must play a role in stage II.
The behaviour of the maximum slope of the stress–strain curve, which can be taken equal to θII, is striking. The hardening rates averaged over temperatures up to room temperature are shown in Table 1. Also shown is the extent of easy glide shear strain in stage I, similarly averaged.
Hardening rates averaged over temperatures up to room temperature*
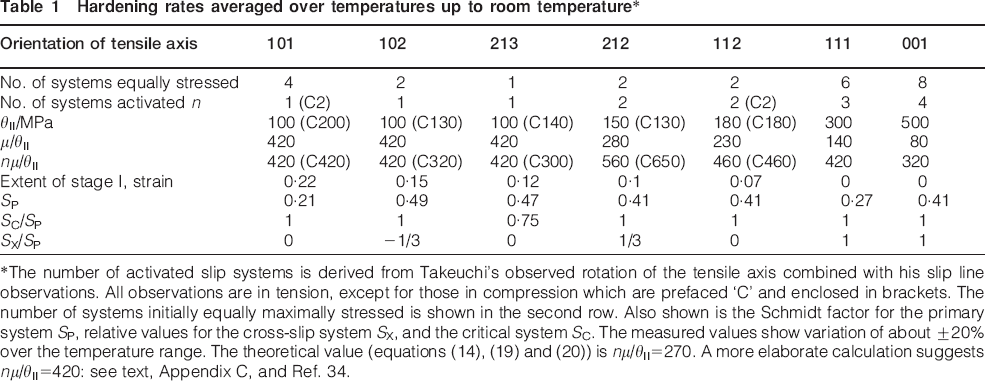
*The number of activated slip systems is derived from Takeuchi's observed rotation of the tensile axis combined with his slip line observations. All observations are in tension, except for those in compression which are prefaced ‘C’ and enclosed in brackets. The number of systems initially equally maximally stressed is shown in the second row. Also shown is the Schmidt factor for the primary system SP, relative values for the cross-slip system SX, and the critical system SC. The measured values show variation of about ±20 over the temperature range. The theoretical value (equations (14), (19) and (20)) is nμ/θII = 270. A more elaborate calculation suggests nμ/θII = 420: see text, Appendix C, and Ref. 34.
What seems clear is that both the number of available slip systems and the stress on the cross-slip system have an effect on both the hardening rate in stage II and the extent of easy glide. As we shall see, the work of Kubin et al.62 shows that plastic flow tends to avoid collinear systems, that is, systems on two planes with a common slip direction: the combined action of a slip plane and the corresponding cross-slip plane. Therefore, we can rationalise the reduction in the number of possible slip systems for the (111) and the (001) crystals.
Another important factor which makes the number of active systems less than the number equally stressed is the sense of rotation of the tensile axis: it moves away from 〈001〉 and 〈101〉, but towards 〈111〉. Therefore, a small rotation in the former two orientations reduces the possible number of systems. What is interesting is the increase in the number of systems active in compression in the 〈101〉 case. According to Vorbrugg et al.,9 whose results where they overlap with Takeuchi's confirm them, the simplest explanation for the reduction of slip systems is that coplanar Burgers vectors are coupled so that they operate together. However, the stresses and strains which form the basis for the data in Table 1 always refer to a standard single slip system, although the crystal rotations are calculated for the coupled systems where appropriate. In fact the difference between the stress–strain curves corrected for rotation due to coupled slip and those corrected for single slip rotation is rather small, producing changes in slope of ∼25.
In conclusion, we can say that although the slope of stage II can be taken to be about μ/400 in single-slip orientations where the resolved stress on the cross-slip system is small or negative, it can be up to a factor of five greater if the cross-slip system is stressed equally with the primary system. The role of cross-slip and the stability of the tensile axis determine the number of active systems, but the hardening rate per active system is constant at about μ/400±25. The extent of easy glide is anticorrelated with the number of active slip systems and thereby with the slope of stage II.
It is much harder to see clear trends in the orientation dependence of stage III and its onset. There is a tendency for curves of different orientations to cross: a larger slope in stage II is accompanied by a reduced level of stress in stage III. Marked crystal rotation and the onset of multiple slip play a role. However, there are too many complications to come to a straightforward conclusion. At low temperatures, the 〈111〉 oriented crystal shows load drops due to twinning, stage B in Niewczas’ notation. Other orientations show the onset of secondary slip which complicates the behaviour. Tensile instability sets in and limits the observation of stage III in most cases at higher temperatures. We therefore turn to a discussion of the effects of temperature.
Testing temperature
We distinguish three types of temperature dependence.
First, very strong, caused by the lattice resistance in body-centred-cubic metals, as well as in some ceramics. For example, in pure iron, the flow stress falls by about a factor of 10 between liquid helium temperature and room temperature. The entire stress–strain curve is affected including the initial flow stress. The effect is absent in face-centred ductile metals. We do not discuss this further.
Second, strong, caused by cross-slip. This has been most studied in copper, where at constant orientation one finds a reduction in maximum shear stress (ultimate tensile stress resolved onto the active slip planes) of about a factor of 2·5 between helium temperature and room temperature. The strain to the end of stage I in single-slip orientations and the stress for the onset of stage III all show this temperature dependence. In cyclic plasticity, the saturation stress (endurance limit) and the cyclic hardening rate behave similarly. The effect changes the shape of the stress–strain curve but it does not affect the flow stress; this clearly distinguishes it from the effect of the lattice resistance. In particular, change in the propensity to cross-slip causes stress–strain curves at different temperatures to cross: an increase in the strain to the end of stage I is accompanied by an increase in the stress for the onset of stage III, so the curves must cross. Similarly, cyclic–stress–strain curves always cross when observed at different temperatures. What is happening is that at low stresses easy cross-slip promotes irreversibility of slip, and thus increases the rate of work-hardening, but at higher stresses easy cross-slip removes screw dislocations and thus promotes saturation of the hardening. The fact that fatigue properties show strong temperature dependence was first shown by Broom and Ham.10
Finally, weak, caused by forest-cutting. The classic experiments are those by Cottrell and Stokes11 on aluminium. At any point in the stress–strain curve, the temperature dependence of the flow stress can be measured. Although there are transient effects, particularly work softening when flow recommences after an increase in the testing temperature, it is found that one can define a flow stress which is reversibly dependent upon temperature. The ratio of the flow stress developed by deformation at one temperature to that after a change in temperature depends only on the two temperatures and is independent of the plastic strain. The strain independence, commonly called the Cottrell–Stokes law, has been satisfactorily explained in terms of the cutting of forest dislocations by Nabarro.12 The point is that thermal activation can provide some small help in overcoming the intersection of dislocations. Although as strain increases the density of forest dislocations also increases, if at all plastic strains a single type of obstacle operates, presenting on average the same profile to the glide dislocations, the Cottrell–Stokes law is rationalised and the temperature dependence can be reliably estimated.84 The ratio of the flow stress at helium temperature to that at room temperature is between ∼1·3 for aluminium and 1·1 for silver, much weaker than effects due to cross-slip.
These ratios are similar to those found for the slope of stage II itself. Data collected for a variety of metals by Hirsch13 show that with some scatter there is probably a small reduction in θII between the absolute zero of temperature and 300 K.
Size effects
In a series of experiments at room temperature using copper crystals of constant single-slip orientation, Fourie28 showed that the strain extent of stage I depends strongly on the crystal size. A line drawn parallel to the slip direction from one face of the crystal to another, of length denoted by LE, can be regarded as the distance, an edge dislocation must travel to traverse the crystal. As LE is reduced by a factor of 100 from ∼30 to 0·3 mm, the extent of stage I is increased by about a factor of 10. However, the slopes of stages I and II are only weakly affected. A closely related effect is a strong flow-stress gradient which develops in stage II: it seems that a layer near the surface parallel to the edge dislocations does not harden. The layer is surprisingly thick, of the order of millimetres. This is further discussed in the sections on ‘Slip bands and models for them’ and ‘Consequences’.
Effect of alloying
Detailed consideration of alloying is beyond the scope of this review. It suffices to say that there are effects on the flow-stress, but that there are also effects on the shape of the stress–strain curve. Alloying seems invariably to increase the extent of stage I. A general rule is: the greater the length of stage I the greater the stress for the onset of stage III, so that alloys of different compositions tend to show stress–strain curves which cross, rather like the effects of a change in temperature.
We may conclude this section as follows. Although the dislocation forest causes work-hardening, as evidenced by its dependence on multiple slip, cross-slip also has a profound effect on the shape of the stress–strain curves. Greater propensity to cross-slip reduces the plastic strain in stage I, increases the slope of stage II, and reduces the stress for the onset of stage III. The upshot is that stress–strain curves under different conditions of orientation, temperature, and alloying tend to cross. Furthermore, the size of the specimen has a pronounced effect, particularly on stage I: the greater the distance an edge dislocation must travel to cross the specimen, the smaller the strain in stage I. Finally, the maximum slope of the stress–strain curve θII, expressed per activated single-slip system, is constant to within ∼50 and is equal to μ/400.
Slip bands and models for them
The earliest studies of plastic flow in crystals revealed that slip occurs locally and in bursts. For example, in 1927 Obriemov and Schubnikov14 determined the onset of plasticity in crystals of NaCl by stress birefringence, observing the very first isolated slip bands as the applied stress rises through the macroscopic flow stress. The images show clearly the sequential displacement of crystal along crystallographic slip planes, bands forming first being sharply stepped by later ones intersecting them. Close examination of Fig. 2 reveals that the bands can make very small angles one with another, also that the bands are not quite crystallographically orthogonal, suggesting that the slip planes need not be perfectly aligned with the crystal planes. Similar observations by Brown and Ogin15 of persistent slip bands in AgCl show clearly that the bands make angles of a few degrees with the crystallographic slip direction.
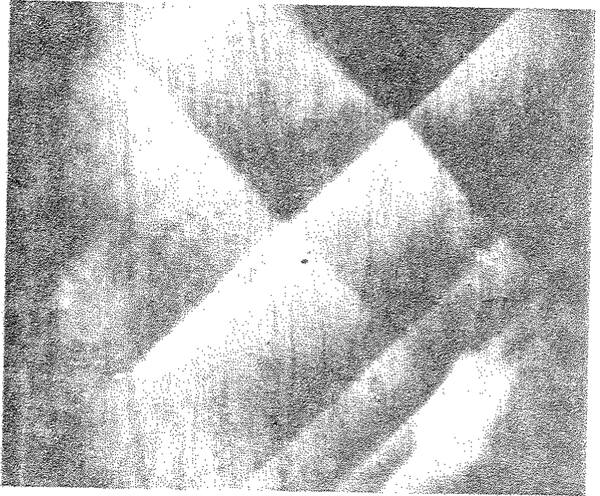
Slip bands at the onset of plasticity in annealed NaCl crystals, revealed by stress birefringence. If the reader looks parallel to the bands, he will see that, in addition to the sharp offsets caused by their mutual intersection, there are small angular deviations from the crystallographic slip planes. The width of the crystal is ∼5 mm, and the vertical lines are probably cleavage markings. Reproduced from Obriemov and Schubnikov14
Stress birefringence shows slip bands projected perpendicular to the Burgers vector, that is, viewed in a direction parallel to primary edge dislocations. More usually one looks at the slip steps on surfaces caused by the emergence of primary screw dislocations. In Seeger's classic review16 there are several examples of this, many showing slip bands wandering slightly away from the trace of the precise crystallographic slip plane. The Basinskis17 first recognised that these small angles may be significant. By analogy with the aerodynamics of aeroplane wings, we may think of a slip band as a near-planar structure making an angle of tilt or pitch with the slip direction (the lines of screw dislocations) and an angle of roll with the perpendicular to the slip direction (the lines of edge dislocations). These angles are very small and variable, typically 1–5°. It is easy to ignore them, particularly because in many of the micrographs, both optical and electron, the images are subject to aberrations except in the centre of the field of view.
Quantitative observation of slip bands shows that they are composite. Authors distinguish the fine structure, or elementary structure, made up of many very fine slip lines, from slip bands, which may be made up of several slip lines. Neuhauser18 further distinguishes slip steps, any kind of sharp surface step produced by one or many dislocations, from glide bands, any cluster of surface steps on closely spaced neighbouring planes. He gives examples, showing departures of the markings from strictly crystallographic orientation. It is a confusing situation. Often the elementary structure itself looks composite, when observed at higher resolution. For the purposes of this paper concerned with pure metals, it is important to exclude observations made on alloys, or on radiation-damaged materials; also to exclude observations on cyclically hardened materials which exhibit persistent slip bands. In the excluded cases, glide softening occurs, which concentrates the slip on active planes. It seems clear that when plasticity is well established in pure ductile materials, and the visible slip structure induced by monotonic plastic strain is well developed, so that the surface is covered with slip markings, both lines and bands, the sources of plastic flow are distributed over the whole crystal volume.19 Slip is a cooperative three-dimensional phenomenon comprising repeated avalanches of dislocations. Slip on one plane strongly affects neighbouring planes. Only in special circumstances is slip confined to well-separated single crystallographic slip planes.
Slip lines in ductile pure materials show a step-height at the surface which does not depend markedly upon the plastic strain, nor upon the material itself. Data from several authors is assembled by Neuhauser.18 We see that in Cu, Zn and NaCl where the level of stress is increased by a factor of ∼50 and the plastic strain similarly, the slip line offset or step height varies at most by a factor of 3, from 3·1 to 10 nm, in each case very variable but increasing only very slowly through the stages of work-hardening. Over the same range, the slip line length decreases inversely with the stress, by a factor of 60. The length of the lines at the onset of stage II is ∼20 μm, about ten thousand times the offset. This remarkable feature of slip lines has been appreciated since the earliest systematic high resolution studies by Mader20 using replica techniques and electron microscopy. The behaviour was clearly demonstrated by Hirsch and Lally2 in stage I magnesium where the average step height is constant at ∼24 nm over 125 shear strain, whereas the slip band spacing varies by a factor of ∼20.
The conclusion is that although the plastic displacement is widely variable from slip line to slip line, it assumes a constant average value throughout the deformation, and depends neither upon the plastic strain nor even very much upon the material.
Further evidence, seemingly ignored in many recent reviews, concerns the dynamics of slip. Schwaarwächter and Ebener21 record acoustic emission from deforming copper single crystals and conclude that ‘…spurt-like dislocation movement between two bounds…’ is compatible with ‘being the generating event’ for acoustic emission. They suggest that the bounds are cell walls in the microstructure. According to them, the walls provide the sources of the dislocations, as well as the sinks for them, and the events are the bursts of dislocations between sources and sinks. The lifetimes of the bursts at the onset of stage II hardening are in the range of microseconds. In stage II their results show that the intensity of the emission is inversely proportional to the square of the stress (or plastic strain), and this is neatly explained by slip bands which produce a constant plastic displacement but have a length inversely proportional to the stress, so that acoustic source strength, which is the slipped area (length squared) multiplied by the displacement, is inversely proportional to the square of the stress. At the onset of stage II, the dislocations move an average of several micrometres in a microsecond, that is to say, a few metres per second, much less than the speed of sound. In order to produce the offsets observed, and the strength of acoustic sources recorded by Schaarwächter and Ebener, some tens of dislocations must move simultaneously together.
It is clear that slip events require the cooperative motion of groups of dislocations distributed over several planes. This cooperative motion was one of the earliest observations of slower moving dislocations made by Whelan22 who called it ‘shunting motion’, i.e. each dislocation moving jerkily under the influence of its neighbours and that of the applied stress.
There is another notable feature of slip events which these observations show: the displacement produced by a newly-formed band does not progressively increase with overall plastic strain. Once activated, the band becomes inert and its displacement stabilises. This is most clearly shown by Mader's pioneering experiments20 where the measured offset (step-height) in a slip line does not depend upon the interval of plastic strain used to produce it. Other evidence shows that although the bands cross each other, resulting in steps, as seen in Fig. 2, the steps once formed do not increase in size as the strain progresses. Slip is accomplished by the constant initiation of new bands. The same conclusion is reached by Hirsch and Lally2 in magnesium. It seems to be a general property of slip bands.
The crystal acts as a palimpsest, each slip event overriding previous structures which are progressively blurred and erased. Simple calculations suggest that in a virgin crystal, initially of cubic shape with 1 cm edge lengths, each atom has participated in a slip band about 100 times after 10 strain.
Figure 3 shows the model of a slip band suggested by these observations. An essential feature of the model is that the band is ellipsoidal, but with a very small aspect ratio: a blade-like shape approximately lying in the slip plane. If the dislocations in the band are to stay together as they spread out from their sources, the combination of the applied stress and the stress field of the other mobile dislocations in the band must produce a uniform stress on each. This condition is fulfilled24,25 if and only if the band is ellipsoidal. The consequence of the uniform stress condition is that the band has an ellipsoidal form. As it expands and encounters obstacles, the ellipsoid can elongate or change both its axial ratios and the orientation of its axes in any way, so long as it remains ellipsoidal. The bands modelled in this way have several features:
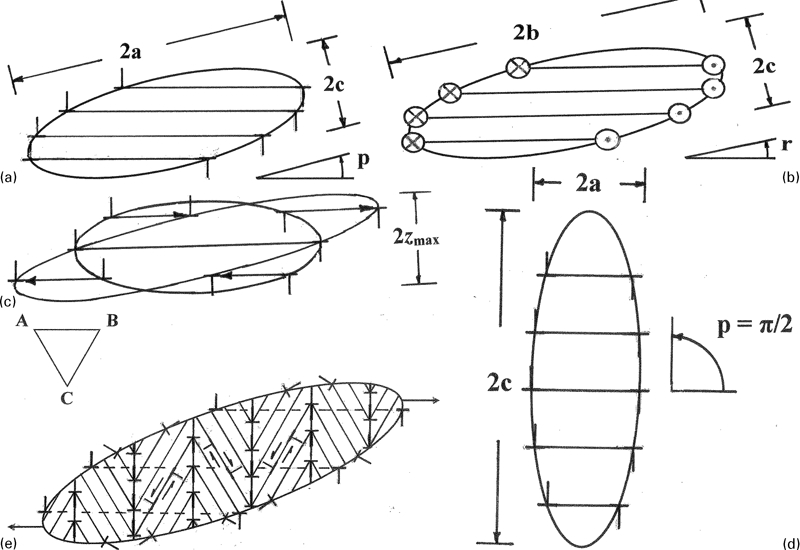
The unstable ellipsoidal slip band. a shows the view along the edge dislocations showing the angle of pitch p; b shows the view along screw dislocations, showing the angle of roll r; c shows how a band can waggle, that is, it can change its pitch by moving the dislocations at its periphery without changing the area of slip, thereby giving the band a degree of freedom independent of external forces. In c, 2zmax is the caliper diameter of the band perpendicular to the crystallographic slip planes. d shows the band with a pitch of π/2, in which case it becomes a well accommodated deformation band. e shows a two-dimensional depiction of a stabilised slip band as a GNB at the periphery of the band, plus incidental dislocation boundarie (IDBs) in the interior, resulting from interactions between secondary slip systems criss-crossing the band. Three Burgers vectors AB, BC and CA operate on planes perpendicular to the paper. At the periphery of the band, and in the interior, dislocation reactions occur as shown. In two-dimensional, the rotation axis of the IDBs is of necessity perpendicular to the page, whereas in the three-dimensional case, the rotation axes have components perpendicular to the band itself. The cause of work-hardening can be viewed as the necessity for a band to stretch or compress if it is not quite parallel to the crystallographic shear direction. Arrows show the stretch caused by shear. The GNBs cause rotation about the roller axis, parallel to the direction of the primary edge dislocations. They are geometrically necessary in the sense that they mark the boundary of a sheared zone. The IDBs are incidental in the sense that they are a consequence of the secondary shear, and there is a random element to the rotations they produce. They are statistically stored in Ashby's sense,23 but they are a necessary consequence of the pattern of flow
they occupy a definite volume
they can tilt by small angles about the crystallographic slip planes
the basic ellipsoidal shape can be accomplished by single dislocations moving on neighbouring slip planes or by groups of dislocations moving on separated slip planes, to form slip lines making up a slip band.
The model thus allows flexibility of the sort observed.
One aspect of the mysterious force by which one slip line influences another is taken to be the requirement that the slip bands be ellipsoidal. This enforces collective motion.
Previous models of slip bands have almost universally been taken to be dislocation pileups26 on a single plane, as proposed initially by Mott27 in the very early days of dislocation theory, and elaborated with great impact by Seeger.16 The pileup on a single crystallographic slip plane has none of the features of ellipsoidal slip bands listed above: it occupies no volume, it cannot tilt, and it is an isolated entity. However, with one exception, the basic formulae25 for stress concentrations and the number of dislocations in a planar pileup can be applied unchanged to ellipsoidal slip bands if the aspect ratio is small. The exception concerns the stress at the very head of the pileup, regarded as a continuum distribution of dislocations. Instead of a singular infinity proportional to the inverse square root of distance from the head of the pileup, the maximum stress at the tip of an ellipsoidal band is finite and equal to the applied stress multiplied by half the aspect ratio. The method of the continuum distribution renormalises the stress singularity at the dislocation core, a singularity which of itself cannot drive dislocation multiplication because energy is not available to increase the total line length.
In the Appendixes we give formulae for ellipsoidal slip bands accurate for both tilt and roll, valid to first order in the aspect ratio. The main point is that the small angles of inclination of the bands produce stresses which produce no glide force on primary dislocations, but which activate secondary slip. The secondary slip hardens the band, stops it from spreading, stabilises the primary dislocations in it and prevents them from running back when the band is unloaded. There are two sorts of stress concentrations:25 when the primary dislocations are free to move under the applied stress, virtual work arguments show that they feel concentrated forces tending to expand the slip band, anti-confinement forces acting mainly to lengthen it but also to widen it; however, when the dislocations are anchored by secondary slip, residual concentrated stresses still act on the neighbourhood of the band. The dislocation structures in the neighbourhood must be strong enough to resist local slip if there is to be no initiation of a new slip band.
On this view, the rapidly propagating band is stopped not by a pre-existing obstacle impeding the leading dislocation, but by the activation of secondary slip which forms a network all over the participating dislocations at the periphery of the ellipsoid, thereby nullifying the stress concentration on all of them, including the leader. A distributed forest of dislocations can stop a powerful running slip band. This is consistent with nearly all modern reviews which emphasise the critical role of the dislocation forest in providing the obstacles to slip.
An important criticism of surface slip line observations was made by Fourie.28 He observed a soft surface layer, ∼2 mm thick, in work-hardened single crystals of copper. The layer is prominent in those surfaces perpendicular to screw dislocations, that is, the surfaces exhibiting slip steps. He sees a very large effect, essentially zero hardening in the outermost layer, with a steep gradient in flow stress going into the interior. Electron microscopy shows that the surface layer is accompanied by larger dislocation cell-sizes, so it is a structural effect. Fourie points out that surface slip observations are therefore unlikely to be representative of the bulk. However, the acoustic emission results confirm qualitatively the results of surface observation18,20,21 and leave little doubt that although the detailed disposition of the slip steps might be unreliable, the basic variation of line lengths and step heights with stress and strain can be relied upon to be typical of bulk metal. According to Mughrabi and Obst29 the slip line length in the bulk may be about half that observed at the surface.
Distributed sources and collective motion of dislocations
Electron microscopy of dislocation structures has produced a bewildering picture, full of detail but lacking direct support for ellipsoidal slip bands. The main reason for this is the transient nature of the bands. They can only be seen under load in the microseconds before they are stabilised. When stabilised by secondary slip they degenerate into networks of interlaced primary and secondary dislocations as well as closely-spaced dipoles, many too fine to be resolved except using atomic resolution. The lack of correspondence between the microstructures revealed by electron microscopy and the surface features caused by slip is in fact one of the central results of half-a-century of observation.
The literature is more than usually full of controversy on this subject. There is the school of ‘LEDS’, low-energy dislocation structures, mainly concerned with small-angle boundaries. There is the school of ‘SODS’, self-organised dislocation structures. Work-hardening seems to me to be an example of ‘SOC’, self-organised criticality, exemplified by the sand-pile,30 and the observed dislocation structures in all their variety to be dissipative structures: structures which resist the large forces applied to the crystal and turn the resultant energy input into heat. As sand is poured on the top of a sand-pile, and progresses down its sloping sides, the key event is the sudden appearance of landslides which maintain the average slope of the pile at the angle of repose (essentially the angle of friction) but are caused by small local departures from that angle. The process is characterised by a power-law frequency distribution of the number of grains of sand in a landslide, and of course other related power-law distributions, such as the energy dissipated in the landslide as a function of the frequency of occurrence. The work-hardening process is made more complicated than the sand-pile because the coefficient of friction increases as the process takes place. Perhaps the best exemplar of a dissipative structure is the rivermouth delta. In this case, over geological time, the flow of the river is reduced while the delta builds up by the accumulation of silt, accompanied by successive bursts of the levees formed by it. This is much more like the process of work-hardening than the sand-pile, although both examples are illuminating. Both show constant intermittent flow. However, before constant intermittency is established, there must be a precursor phase of behaviour: the building up of the sand-pile, and the first depositions of silt at the rivermouth.
The main reasons for preferring self-organised criticality as the starting point for thinking about work-hardening are:
power-laws are ubiquitous in plasticity. Such power laws are the main outcome of computer modelling of SOC
as noted above, despite years of work, microstructural studies of dislocation structures in work-hardened metals show no clear correspondence with the slip line structure. This disjunction between microstructure and behaviour is a hallmark of SOC
To quote Per Bak,30 ‘In the critical state, the sandpile is the functional unit, not the single grains of sand. No reductionist approach makes sense. The local units exist in their actual form, characterised for instance by the local slope, only because they are part of the whole. Studying the individual grains under a microscope doesn't give a clue as to what is going on in the whole sandpile. Nothing in the individual grains of sand suggests the emergent properties of the pile.’ For ‘grains of sand’, read ‘dislocations’.
Another helpful critical attempt to define SOC is to be found in the book by Jensen.31 To quote, ‘We expect SOC behaviour in slowly driven, interaction-dominated threshold systems’. This describes precisely the conditions in a plastic crystal subject to an imposed strain-rate much slower than the strain rate occurring in each intermittent slip band, which is the product of highly-interacting dislocations made mobile only at or above a threshold stress.
In what follows, we assume that stage I of the hardening curve is a precursor phase, leading to ample availability of dislocation sources in stage II. In early stage I, the slip distance (mean free path) of edge dislocations is very long, of the dimensions of the crystal. This relates to the size effects studied by Fourie. The mean free path of screw dislocations is limited by cross-slip, which has a profound effect on the length of stage I. As slip spreads throughout the crystal, impingement of dislocations increasingly occurs, the mean free path of both edges and screws becomes more limited, and stage II starts. Throughout stage II, plasticity creates sources, in the form of links in subgrain boundaries, as well as dislocation dipoles and loops. Cross-slip and climb eliminate the smaller dipoles and loops. As the stress rises, it splits the larger dipoles and loops, producing mobile dislocations. The onset of stage III deformation is associated with the elimination of all screw dislocation dipoles, the smaller ones by cross-slip and the larger ones by splitting. This feature determines also the endurance limit in cyclic deformation. The basic cross-slip process is attributed to thermally activated motion of jogs on screw dislocations with an activation energy in fcc metals around 0·1 eV.32
Action of secondary slip to stabilise the ellipsoidal slip bands leads naturally to an arrangement of geometrically necessary boundaries (GNBs) and IDBs as introduced by Kuhlmann-Wilsdorf and Hansen.33 Figure 3e shows schematically the structure of a stabilised band. As shown by equation (B5), the tilted band suffers a fibre stress which is largely tension or compression in the direction of the Burgers vector, causing secondary slip on critical and conjugate systems which strongly interact with the primary dislocations. The primary dislocations are thus immobilised in the peripheries of the bands, although the rotations they produce around the roller axis remain. They form the GNBs. The secondary slip is exactly what is required to produce networks including Lomer–Cottrell locks34 and rotations about axes perpendicular to the roller axis.73 The symmetry of the fibre stress allows four independent secondary systems to operate, each producing lattice rotation. The choice of which system operates is likely to be random, depending on the local availability of sources. As slip on the secondary systems crosses the band, the dislocations from one system may interact with another in a different part of the band to produce small-angle boundaries crossing the band, each boundary associated with misorientation derived from two of the four independent rotation systems. The resulting boundaries are identified as the IGBs.
A great deal of evidence supports this picture of a slip band stabilised by secondary dislocations. The recent summary by Mughrabi and Obst29 of previously unpublished work by Manfred Wilkens’ group using X-ray diffraction at Stuttgart shows clearly both the rotations about the roller axis and the much smaller twists about an axis perpendicular to the primary slip plane. The twists become noticeable only after the onset of stage II hardening. The roller rotations are attributed to geometrically necessary dislocations (GNDs), namely primary dislocations trapped in the networks at the periphery of the stabilised slip band. These form only a small proportion, perhaps 10, of the total density. The twists are attributed to the induced secondary activity. The newly published results strongly support earlier versions of the model.34,84 In particular, the nature and magnitude of the twist angles were predicted twenty years ago.
Categories of sources
We turn now to a more detailed description of the sources of mobile dislocations. As moving dislocations are arrested by interaction with others because the current level of the applied stress is insufficient to enable them to continue their motion, they are trapped until the stress level rises and frees them again. They can also be freed if a moving dislocation interacts with the trap, for example, by eliminating one dislocation in a dipole and liberating the other.
We discuss three main types of trap: edge dislocations trapped in dipoles, screw dislocations likewise, and forest dislocations trapped in networks, particularly in the twist boundaries encasing the slip bands. In addition to limiting the slip distance of mobile dislocations, each type of trap plays a key role in dislocation plasticity: edge dipoles as sources of deformation twins, usually at low temperatures; screw dipoles as agents in cross-slip; and networks in developing lattice rotations, revealed by asterism in X-ray diffraction patterns and electron microscopy, as well as agents in recrystallisation at high temperature. Unlike the mobile dislocations and the nascent slip bands, these residual trapped dislocations can be observed by electron microscopy. We consider each type briefly in turn.
Edge dipoles
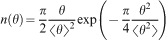
Tetelman35 early recognised that dipoles in pure metals mostly result from the interaction of dislocations travelling on neighbouring parallel slip planes, and not from other proposed mechanisms such as cross-slip at obstacles. Edge dipoles cannot be eliminated by cross-slip and so are long lived, unlike screw dipoles. Most information now available comes from studies by weak-beam electron microscopy of cyclically deformed metals. Figure 4 shows a schematic distribution. The number of dipoles of height h in the interval δh is given by
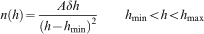

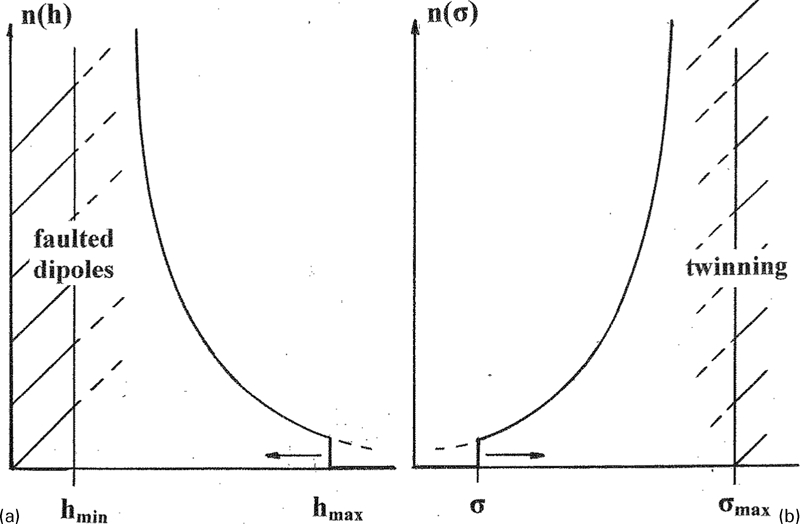
The density of edge dipoles a as a function of height and b as a function of stress required to split them. It is energetically favourable for the narrower dipoles to convert to faulted dipoles, which can act as sources for deformation twins. As the stress level rises, the cut-off points in the distribution move to intersect the faulted dipoles, and twinning becomes possible. However, the faulted dipoles survive only at low temperatures in copper and more usually the entire dipole distribution disappears before twinning can occur. The same distributions probably apply to screw dipoles, but cross-slip limits the minimum height rather than diffusion or faulting
The main experimental evidence for the correctness of the distribution comes from studies by Tippelt et al.36 on cyclically deformed Ni; also by Antonopoulos and co-workers37,38 on Cu.
The basic theoretical analysis39 treats the progressive refinement of the distribution by the reaction between dislocations intruding into the dipole and getting preferentially trapped by one or other of its components, leaving a yet finer dipole and a free mobile dislocation, which repeats the process.
A complication in the distribution which we ignore here, but which is important for cyclic plasticity, is that the energy of vacancy dipoles (half-planes pointing outwards) differs from that of interstitial dipoles (half-planes pointing inwards). The former have lower energy, but higher splitting stress, than the latter.40 This effect produces a bias towards vacancy dipoles in the distribution, especially when the crystal is unloaded.
A further complication which enters the quantitative theory is a factor of two reduction in the splitting stress given by equation (3) due to the action of the intruder dislocation.39 This affects hmax, the upper limit of the distribution.
The lower limit of the distribution hmin is a subject of speculation, because of the difficulty of observing very fine dipoles. According to Essmann and Rapp,41 based on evidence of equilibrium densities of dipoles formed by unidirectional deformation, edge dislocation dipoles of finite length but below a critical height of 1·6 nm, degenerate spontaneously into a row of vacancies. Computer simulations42 do not support this, nor do elementary continuum estimates. The most probable fate of very fine dipoles is that they are transformed into faulted dipoles as observed and studied by Steeds.43 Even these dipoles may well be broken up by intruder dislocations, to be replaced by yet smaller dipoles. In the absence of diffusion, what happens is that intruder dislocations encountering the dipole substitute for one of its components and acquire jogs which connect it to the other component which is carried away. This is the process of athermal climb suggested by Brown39 and observed by Veyssière44 and called by him the ‘non-diffusional refinement of prismatic dislocation loops’. If one component is annihilated completely, then the dipole disappears. If the dipole is one interatomic spacing high, it can only disappear. The distributions of Tippelt et al.36 strongly suggest a lower limit about the same magnitude as that estimated by both Steeds and Essmann and Rapp: ∼2 nm in nickel at room temperature.
The faulted dipoles near hmjn can act as sources of deformation twins. Understanding how deformation twins are formed has progressed since Cottrell and Bilby45 first suggested that there must be a pole mechanism, rather like the Frank–Read source, for depositing successive layers of stacking fault on the glide planes. Venables46 pointed out that both dissociated jogs on screw dislocations and faulted prismatic (Frank) loops could act this way. The faulted dipoles on the primary glide plane have Burgers vectors inclined to the plane just as Venables’ prismatic loops, so when their partial dislocations on that plane under a large stress expand and escape the dipole, leaving stacking fault behind, a multiplanar twin can form. This was proposed by Niewcas and Saada47 and reviewed in exquisite geometric detail by Niewcas.48 Figure 5 shows schematically how faulted dipoles act as twin sources. Weak beam electron microscopy shows structures suggesting that jogs on screw dislocations also operate as twin sources as Venables suggested.
Diffusion eliminates the dipoles near hmin, faulted or not. Pipe diffusion, involving no net matter flow into or out of the dipole, transforms them into necklaces of prismatic or faulted loops. Vacancy exchange between vacancy and interstitial dipoles, or between dipoles and surfaces, removes them altogether. There is little question that annealing deformed materials at around half their melting point removes the dipoles, leaving a residue of vacancy-type loops: this was first shown by Groves and Kelly49 as corrected by Groves and Whelan50 in MgO. The annealing process involves vacancy diffusion over large distances, to grain boundaries or to the surface. Annealing at rather lower temperatures can produce transformation of long dipoles into circular loops, driven by a reduction in dislocation line energy at constant defect area, involving pipe diffusion along the core. This process seems to become rapid at temperatures of about a third the melting temperature in face-centred-cubic metals51 and in zinc.52 A detailed discussion is beyond the scope of this review.
The dipoles are arranged in clumps with a definite spacing and width. In cyclic plasticity the clumps are regularly spaced, but in monotonic plasticity they are more broken up, but still with a definite spacing. The reason for dipoles clumping is that bowing dislocations pull them together.84 The equilibrium density of the dipoles in clumps is one dislocation per slip plane, for which there is some rather inconclusive experimental evidence.39
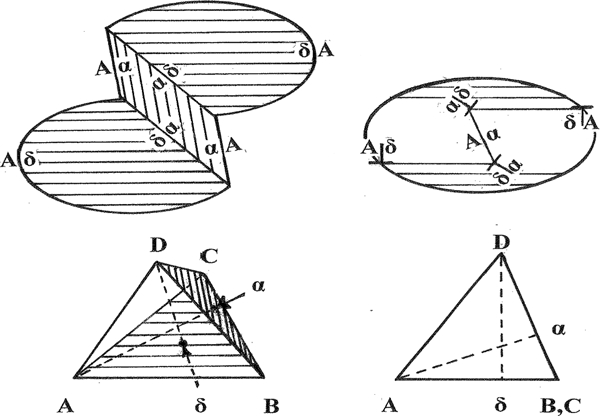
Schematic illustration of how a faulted edge dipole can generate a deformation twin. The Thompson tetrahedron is shown. On the left is an attempt to depict the spreading Shockley partial dislocations, Aδ and δA, pulling away from the stair-rod dislocations αδ and δα. Because the displacement vector of the anchoring stacking fault Aα is not coplanar with the turning partial dislocations, these form spiral sources as depicted on the right. The envelope of the growing twin must be ellipsoidal if the partial dislocations are to move together. A consequence of this twinning mechanism is that the twins should show a mid-rib, a gap between the two spiral sources equal in width to the height of the original faulted dipole. Another consequence is that the twin can waggle just like a slip band, so that the array of twins can maximally fill space to a volume fraction of about 75
In conclusion: edge dislocation dipoles can act as the volume distributed sources of glide dislocations required to produce slip bands. The finer dipoles become faulted, and can act as twin sources. At the lowest temperatures where no diffusion can occur, the very fine faulted dipoles initiate lamellar deformation twins when the stress is high enough to move the partial dislocations: this causes Niewczas stage B. At higher temperatures, above about a third of the melting temperature, diffusion can eliminate the narrow dipoles, faulted dipoles do not form, and twinning is not observed.
Screw dipoles
If the discussion of edge dislocation dipoles is made difficult because the narrow ones are hard to see, the discussion of screw dislocation dipoles is made almost impossible because they can be annihilated by cross-slip without any matter flow at all. The annihilation process is most likely to be the thermally activated motion of extended jogs step by step along the dislocations, progressively narrowing the dipole until, when its components are separated by the separation of the partial dislocations, it can suffer catastrophic collapse without thermal activation. 53 53,54 One can think of this as the diffusion of shear. There is some discrepancy in estimates of the activation energy for jog motion. According to Brown,53 who analysed experimental observations of the temperature dependence of the onset of stage III in copper, nickel, and aluminium, jog motion requires an activation energy of ∼0·1 eV. According to Vegge et al.,54 who constructed an atomistic computer simulation, a much smaller activation energy is involved, ∼0·015 eV. In both models, the step-by-step motion of existing jogs can be initiated at very low temperatures, ∼40 K, but complete annihilation requires the motion of many jogs along the length of the dipole. The evidence suggests that dipole annihilation by jog motion becomes fast enough to do this at temperatures above ∼100 K in copper. As the stress level increases, stable dipoles become narrower and narrower, so the annihilation process becomes faster. At less than a critical spacing, around 5 nm in Cu, the dipoles disappear athermally: no jog motion is required. Therefore, above a certain stress and temperature, all screw dipoles disappear from the crystal. This stress is identified with the onset of stage III in the work-hardening curves, and with the saturation stress in cyclic plasticity. These phenomena are characteristic of dynamical recovery as described in many texts: most recently by Argon.55 In contrast to models in which the key event is the constriction of screw dislocations by pressing against a linear obstacle, dipole annihilation occurs faster when the load is removed than when it is imposed. The action of the load is to pull the dislocations apart, so to impede annihilation.
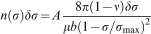
The distribution of screw dipoles is likely to be given by the same equations as those for edge dipoles, but the factor 8π(1−ν) is replaced by 4π. There is no experimental confirmation of this.
The striking absence of screw dislocations in electron micrographs was first noted by Hirsch and Lally2 in Mg. In cyclically deformed Cu, where the screw dipoles have been stabilised by neutron irradiation under load and then examined by transmission electron microscopy at room temperature, Mughrabi et al.56 find hmin≈55 nm: 10 times larger than the athermal limit. At this separation, screw dipoles are just capable of resisting cross-slip: the minimum observable height. At the onset of stage III, and at the endurance limit, the maximum dipole height becomes equal to the minimum height so that the entire distribution of screw dipoles vanishes from the crystal. The distribution is essentially the same for screw dipoles as for edge dipoles. The only difference is that in place of the formation of faulted dipoles and twinning, one has cross-slip to annihilation. In Fig. 4b, one can imagine the step at the applied stress moving to the right until it finally meets the maximum possible splitting stress, at which point the screw dipoles disappear altogether: they have all cross-slipped.
Dislocation sub-boundaries
There seems little doubt that the distribution of sub-boundaries produced by deformation is universal and has two recognisable components: GNDs and IGBs, as described earlier. There are two proposed analyses: the first relates primarily to high temperature deformation and measures the distribution of link-lengths in the observed networks.57 The distribution is analysed in terms of the production of short links by mobile dislocations randomly intruding into the network, countered by diffusional removal of dislocations driven by line energy (annealing). Energy terms associated with long-range elastic stresses seem not to be considered. The second analysis58 relates primarily to the distribution of angles across GNBs and IDBs and applies to low temperature deformation. In the case of IDBs, this seems to be entirely statistical in nature, related to the superposition of rotations of random sign. In terms of the ellipsoidal slip band, as shown in Fig. 3e, one expects the IDBs to have spacings approximately equal to or less than the width of the band, because as the secondary dislocations criss-cross the band to relieve the fibre stress, their collision with another secondary system is what produces the IDB. Pantleon58 shows that a wide range of experimental data is represented by a Rayleigh distribution
Pantleon's distribution58 is more relevant than the link-length distribution57 to problems of plasticity in which creep plays a negligible role. No diffusional process is required to produce the boundaries.
Because a link-length λ in a small angle boundary can operate as a Frank–Reed source at a stress μb/λ≈μθ, Pantleon's distribution can be thought of as a distribution in the stress required to activate sources in the boundaries.
Pantleon's view of the formation of these boundaries differs from the one put forward here. He regards them as due to a statistical fluctuation in the sign of dislocations approaching an existing boundary. Our view is that they arise because of secondary flow to relieve the fibre stresses. There is a multiplicity of secondary systems, chosen randomly along the slip band. The result is random plus/minus misorientation of subgrains with prominent axes of twist perpendicular to the slip planes. The mean misorientation should increase linearly with strain after the start of stage II, exactly as described by Mughrabi and Obst.29 However, at large strains, Pantleon's view is reasonable, because the subgrains continue to act as obstacles throughout the deformation. Therefore, at large strains it is reasonable to find the misorientation increasing as the square root of strain, as Pantleon shows.58
Triumph and failure of the Taylor model
The first theory of work-hardening was developed by G. I. Taylor in his great paper introducing the concept of edge dislocations.59 He first wrote the equation relating flow stress to dislocation density. In modern terms

Modern theories of forest hardening are based on an equation identical in form to equation (5)

Recent work has greatly refined this picture. Following Franciosi et al.61 the forest interaction between the primary system, denoted by a superscript p, and other secondary systems, the superscript s, is written
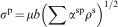
Because the collinear interaction is avoided, the value of Saada's constant recommended in a recent review by Sauzay and Kubin63 is αS≈0·315 at a dislocation density of 1013 m−2, decreasing slowly due to logarithmic line tension effects to a value of 0·23 for a dislocation density of 1016 m−2. There is an independent confirmation of this value from the indentation size effect, attributable to a forest of geometrically necessary dislocations caused by localised flow near a hardness indenter. Brown64 finds values around 0·25 for densities around 1016 m−2. For the estimates of this paper, we shall take

For a variety of reasons I believe it does not. First, the Taylor stress is an artefact of a rigid two-dimensional array of edge dislocations. If one thinks of a kink in the array, it can run unimpeded. The flow stress is essentially zero. Second, the Taylor array has never been observed. Edge dislocations form arrays of dipoles in which the spacing between a dislocation and its partner of opposite sign is much less than the spacing of the dipoles. The stress to split the dipoles is then the flow stress, but it does not depend at all upon the overall density of the dislocations – just on the nearest neighbour spacing. There may be only one dipole, or a large number: the flow stress is the same. Under these circumstances ‘The whole Taylor model then breaks down’ (Friedel66).
The triumph of the Taylor model is to have explained for the first time the weakness of metals because of the dislocations they contain, and the possibility of work-hardening without gross crystallographic change, again because of the accumulation of dislocations. The failure of the Taylor model is that it is based on too restrictive an idea of dislocation structure. There was no electron microscopy in Taylor's day.
Mean free path theories
Most modern theories adopt the point of view that the forest of secondary dislocations causes the work-hardening. They either implicitly or explicitly define two populations of dislocations: mobile and immobile. The mobile dislocations are liberated from the immobile ones, travel one mean free path, and then become immobile again when they are trapped or annihilated. One thinks of a fluctuation δρ in the dislocation population, from immobile to mobile and back. There is then a fluctuation in the plastic strain


The main problem with this approach is that it does not distinguish primary dislocations from forest dislocations, nor does it recognise dipoles. This leads to contradictions: on the one hand, the forest density increases according to the accumulation equation, producing work-hardening; on the other hand, the crystal rotation shows that the forest dislocations do not contribute to the strain. This can happen only if the forest dislocations respond to an internal stress which does not extend the crystal. The dipole population can increase without limit as primary dislocations are trapped, but with no consequence for the flow stress, contrary to the basic assumptions. Slip bands and collective intermittent flow do not feature at all in the model. What one can say is that models based on the accumulation equation (9) and Saada's equation (6) are one parameter models, featuring an unspecified dislocation density ρ. As elaborated by Kubin and his team, the various families of dislocations are specified, but the flow process is a one dislocation process and the build-up of distributed dipolar sources seems to be neglected. The one parameter models have the virtue of algebraic simplicity, and it may well be that they are adequate for many engineering applications. Kubin's models are characterised by explicit computer codes, again an advantage.
We turn now to a three-dimensional model of collective motion which we believe characterises stage II plasticity.
SOC, the perils of coarse-graining, and the slope of stage II
When there is collective motion in a slip band, the concept of a cross-section and mean free path is suspect because the slipping dislocations are stopped by the reaction to internal stresses of their own collective making. The picture is very different from that of single dislocation motion and a cross-section defined by localised encounters. The strain in the band depends not at all on the source density, so long as there are several cooperatively expanding slip lines and secondary dislocations available to stop them.
To understand this we write for the increment in overall plastic strain
Now experiment tells us that the plastic displacement in the band, uB, is approximately constant in stage II, but that the band width 2c diminishes as the stress increases. This happens because the band pitches and rolls, making an effective angle θeff with the crystallographic slip planes, thereby producing fibre stresses which, when c is large enough, drive secondary dislocations through the band, stabilise it and stop further slip. The theory of Brown34,84 as modified in Appendix C (equation (C4)) quantifies this
In the sandpile, there are many grains of sand just on the verge of tumbling. Without the addition of the next grain, the array is in a quiescent but critical condition. When the next grain is added, it causes an avalanche. Computer modelling is required to locate the avalanche and to determine its size. The scale-free quality of the avalanches means that the ratio of the number of grains which tumble to the number on the point of tumbling is on average independent of the state of the array, once the critical condition is achieved. It is unchanged after the occurrence of any particular avalanche.
In the dislocation array, there are many sources just on the point of operation. With the next infinitesimal increment of stress, some initiate a slip band (avalanche) and others are blocked. Computer modelling (or impossibly close experimental observation) is required to decide how many sources actually operate, and in which precise locations. However, SOC tells us that the ratio of the number of sources which operate to the number of those that remain critical is on average independent of the detailed state of the array, but is determined only by the fractional increment in stress. The array of critical dipole spacings, and critical network link-lengths, those at the discontinuities in Fig. 4, depends on the stress, but the shape of the distribution of sub-critical spacings which are potential sources, and the disposition of these sources relative to others, is not stress-dependent, but dependent upon the plastic history. The critical links or dipoles at the sharp cut-off of the distribution can be thought of as the plastic front. The principle of similitude applied to the critical links at the plastic front can be regarded as a consequence of SOC.
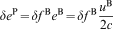
Figure 6 shows what we mean. Each fluctuation in the volume fraction of obstacle is accompanied by a strain increment and a transient stress decrement, rapidly removed by the loading system. We have


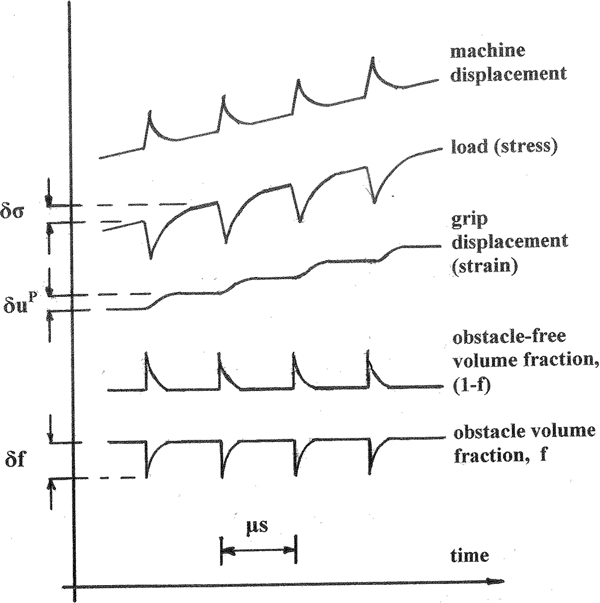
Fluctuations on a microsecond scale during plastic flow. Over time, the hard mechanical testing machine imposes an increasing displacement, subject only to elastic excursions governed by the response time of the loading system and the time of duration of an avalanche of slip. The imposed load rises steadily, subject to similar excursions. Each critical increase in stress δσ causes a band of obstacles to be swept aside by an avalanche of slip. The plastic displacement at the grips rises in steps, while the volume fraction of obstacles and the volume of potential slip remain constant, except for the periods of avalanche
The transient increase in dislocation-free volume is caused by local work-softening: the sweeping-up of debris by the bowing dislocations, as discussed by Brown.34,84
In the cases such as the sandpile where the avalanche size is entirely statistical, the scaling constant m must be determined by computer modelling. Our equation (13) is written with a negative sign because the fluctuations are strongly anti-correlated: when the stress level increases to trigger a new slip band, the volume fraction of obstacles drops, due to local work softening, thereby releasing an avalanche of plastic strain. There is a transient reduction in volume fraction of obstacles when a new slip band results from an infinitesimal increase in stress. During the formation of the new slip band, as the slip band generates its own obstacles in the form of secondary dislocations and dipoles, the volume fraction of obstacles increases again, while the stress level momentarily drops as the plastic displacement rises. The stress then increases at a rate governed by the strain rate, the elasticity of the sample, and the testing machine, until another avalanche is triggered. After the slip band is stabilised, and SOC is re-established, the fractional fluctuation in obstacle volume fraction of whatever sign must be proportional to the fractional change in level of stress.
As opposed to cyber sandpiles, here the fluctuation is the introduction of an ellipsoidal slip band: volume abc∝σ−3. The dimension c is inversely proportional to the stress level, and the other dimensions are related through the tilt angles to the volume fraction of obstacle, constant in the regime of collective stage II behaviour. Therefore, the appearance of a fluctuation in the volume fraction of obstacle results from an increment of the stress, so one finds m = −3.
The average stress level is a control variable, determining the cut-off edge in the source distributions. It is also a tuning parameter, maintaining the system in a state of SOC and constant intermittency. As the average stress level rises, these ideas are consistent with the acoustic noise observations18,21 (the section on ‘Slip bands and models for them’). If the average volume fraction is constant, or nearly so, the fluctuation in volume fraction with each slip band must diminish. This is clearly the case for constant slip band displacement: the volume of each new slip band diminishes as the average stress goes up, and the amplitude in the acoustic noise goes down.
We now have
Equation (14) is still not integrable. The relationship between plastic strain and stress is not reversible. The equation simply gives the slope of the stress–strain curve under conditions of SOC.
The analysis here is called coarse graining. In the many presentations of the theory of SOC, there is no agreed method for tackling it. For macroscopic understanding of engineering utility, one must find the variables of overall stress and strain. The trick is to average suitably over the fluctuations to get a relevant continuous curve. The fluctuations are an essential part of the process, as remarked in earlier papers.34,84 The work-softening which momentarily clears out debris and enables the initiation of a new slip band is followed by the formation of new debris, GNB and IDBs, which clog up the band.
The fluctuations are not thermal fluctuations. In traditional thermal equilibrium, thermal fluctuations enable the system under consideration to explore states neighbouring equilibrium, and to return to it. In SOC, the fluctuations are mechanical but they have the same effect: they enable the system to go somewhere but to return to the SOC condition. The concept of SOC includes the idea that everywhere in the system there is a fluctuating chance of an avalanche, but on average the chance is uniform and unchanging as the system evolves. Self-organised criticality is possible only in systems with a sufficient number of internal degrees of freedom.
In previous papers,34,84 it was assumed that the linear stress–strain relationship within the bands could just be coarse-grained throughout the volume. If you imagine a starting point with no bands and an end point with the volume as full of them as possible, this is the result. This crude method works because strain hardening is linear, so that it does not matter which two points in the curve are chosen to estimate the slope. However, the dimensionality factor m was missing from the earlier treatment.
There is a remarkable consequence for plastic flow in crystals with a number n of active slip systems. Once self-organised criticality is established, the balance between flow on the different systems must remain unchanged after a series of avalanches. An avalanche on one system only will destroy the balance. If there is an increment of stress, the smallest fluctuation in the system which will retain the balance must involve all the systems. Thus

Thus
It might be thought that the extra work-hardening caused by multiple slip is in some sense an artefact of how the shear stress versus shear strain curve is derived. However, it is a real effect, as can be seen from the curves that Takeuchi6 presents of load divided by initial specimen cross-section versus elongation: unprocessed data (his Fig. 3). When the curves are presented as resolved shear stress versus shear strain, both stress and strain refer to a single slip system, but the shear strain calculated from the elongation must be thought of as the algebraic sum of the shears in equivalently active systems. What is not taken into account is that each slip band is produced intermittently on a time scale too short to be resolved by the testing machine. What SOC means in this context is that each new slip band triggered on one specific system by a tiny increment in stress produces a constant plastic displacement and occupies a volume determined by the current level of stress. The volume fraction of the band is reduced by the proportion of bands potentially triggerable on that system. Therefore, the increment in overall plastic strain is reduced, and the rate of work-hardening increased, in that same proportion.
Another way of seeing this is to observe that unbalanced slip on one system will cause internal stress unduly favouring slip on the other systems: SOC is destroyed.
To complete the argument, we must determine the values of the tilt angles. The source of fibre stress is the tilt, measured by the angle θeff. The shear stress some distance s ahead of a tilted slip band before it is stabilised is that of a running crack. It is given25 by σ(a/2s)1/2. If the band is not to open up new sources in obstacles into which it is running, the zone ahead of the slip band must be resistant to the high stresses there. However, the critical distance from the tip of the band is c because other randomly tilted bands nearby greatly reduce the stress. We must have


There is now a much better understanding70 of the packing of ellipsoids. Computer studies show that three-dimensional random close-packed structures of ellipsoids can reach a higher volume fraction than that for spheres, with an ullage (inter-ellipsoid volume fraction) of 0·26. This efficient packing is achieved because the ellipsoids can tilt to maximise both the packing density and the number of nearest neighbours they touch. Waggle of the bands allows these essential additional internal degrees of freedom to the structure. Thus

This type of packing provides a natural explanation for the maximum twinning volume fraction observed at low temperatures (Niewczas,5 section 1). The shape of a deformation twin must be ellipsoidal if it is to expand uniformly before it is stopped by obstacles. Although the crystallographic twinning elements are fixed, the shape and tilt of the twin boundaries can waggle to provide the maximum volume fraction of twins: 76.
The rate of work-hardening for a single slip band estimated from these equations agrees satisfactorily with observation, as detailed in Table 1.
Precursor stages I, A and B
In these stages slip bands or deformation twins progressively fill the crystal. The stages come to an end when the density has built up to allow plasticity throughout the volume. Extensive experimental work enables us to answer pertinent questions.
How do the slip bands spread? Cross-slip of screw dislocations is essential. There are two characteristic geometries: in the first, double-cross slip at an obstacle enables a mobile dislocation to leave one plane and colonise another. This mechanism has been known since the early etch-pit observations of Johnson and Gilman.71 In dispersion-hardened metals it is called the Hirsch mechanism and the resulting array of edge dipoles and loops has been beautifully documented by Humphreys and Hirsch.72 It is described in all subsequent accounts of dislocation plasticity (e.g. Argon55). In the second geometry, external surfaces cause screw dislocations to cross-slip to become more nearly normal to the surface, then to cross-slip again onto a neighbouring slip plane: double cross-slip at a surface. A recent paper describing this with a critical account of the many studies, starting with J. W. Mitchell et al.,73 is by Katajima et al.74 Note that the cross-slip involved in these mechanisms is different from that which results in annihilation of screws of opposite sign by jog motion. Dipole annihilation cannot spread slip bands, but it limits the mean free path of screw dislocations and produces waviness of slip. All these mechanisms require the creation of jogs. It seems from Katajima et al. that this may be a thermally activated process at the surface, with an activation energy estimated to be that for the non-conservative motion of jogs, ∼1 eV, much larger than that required for the conservative jog motion which can eliminate screw dipoles. Perhaps this process derives from screw dislocations at the surface turning normal to it under strong elastic forces.
Where do the secondary dislocations come from? Both cross-slip mechanisms result in trains of dislocations of opposite sign on neighbouring planes. Even if each train is strictly confined to one crystallographic plane, a fibre stress builds up between the planes, secondary slip can be triggered and multiply when the trains meet built-in dislocations on secondary systems. The resulting structures have been observed by etch-pits by Argon and Brydges.75 They observe characteristic tangles impeding progression of the dipole trains.
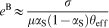
How do the slip bands harden? In Cu the secondary dislocations anchor the trains of dipoles, thereby limiting the length of slip bands. However, the results of Hirsch and Lally2 show that stage A hardening in Mg does not require secondary slip. The crystals show only cross-slip and twinning. The structures they observe in monotonic tension appear very similar indeed to the structures observed in cyclic hardening experiments by Kwadjo and Brown.76 The stress levels in stage A are 1·5 MPa, very slowly increasing over extension by a factor of 2 to ∼2 MPa. In cyclic plasticity, the stress level rises from ∼1·5 to ∼2 MPa at a cumulative strain of 20; then it is constant up to a cumulative strain of ∼100; that is to say, a plastic strain amplitude of ∼0·5 for 5000 cycles. The stress levels are therefore similar. In both cases, twins can be formed but screw dislocations are conspicuous by their absence: they have cross-slipped to annihilation. Also, in both cases the Considère condition is violated, or nearly so, so that uniform slip is only marginally stable in tension, if at all.
In cyclic straining, persistent slip bands develop which produce limited strain, so that the volume fraction of persistent slip increases in proportion to the imposed plastic strain amplitude. In Kwadjo and Brown's experiments at room temperature, the volume fraction of persistent slip rises to nearly unity. In the monotonic case, this behaviour is mirrored in the linear increase in slip band density (inverse spacing) with shear strain. In cyclic plasticity at very high cumulative strains one sees the nucleation of vacancy loops between clumps of edge dipoles, causing further hardening. These are not seen in the monotonic case.
In what follows, we use the behaviour of persistent slip bands to estimate the characteristics of stage A behaviour. Simple formulae,39 accurate to within ∼10, can be used to estimate the spacing of screw dipoles hC, below which they annihilate by cross-slip. If d is the spacing of the edge dipole rafts (ladder rungs in the fatigue literature), we have hC≈d/4π. For Mg at room temperature, d≈7·4 μm, making hC≈0·6 μm. In the cyclic case, the spacing of rafts is well defined, but the spacing of clumps is much less regular in the monotonic case. In the monotonic case, the cross-slip occurs under stress and the value is reduced by half, so hC≈0·3 μm. These values of hC are consistent with slip line observations which reveal the maximum length of cross-slip bridges between slip lines, some of which may be occurring when the load is removed: see Figs. 22 and 23 of Hirsch and Lally.2 The plastic strain amplitude in the saturated persistent slip band is eB≈2b/hC≈10−3. This is a property of magnesium at room temperature, not dependent upon the density of screw or edge dislocations. However, in the cyclic case, the strain required to saturate the band by cross-slip alone is larger by at least 10 times than the maximum strain imposed monotonically: a cumulative strain of ∼20, as opposed to unity. Twins are observed in both cases: they cut across the bands and a single twin is likely to be able to stop slip from accumulating: see Fig. 2 of Hirsch and Lally,2 and Fig. 16 of Kwadjo and Brown.76 It seems plausible that in the monotonic case, twinning caused by the pitch and roll of the band is what limits the plastic strain in it. The twins play the role of secondary slip in stage II. The angles of pitch and roll, clearly visible in micrographs, are determined by random excursions of cross-slip as the screw dipoles coalesce, producing jogged edge dislocations in the clumps. If we imagine that in the monotonic case the avalanche of slip starts with the production of screw dislocations which rapidly increase in density to their maximum, we can estimate the number of cross-slip events in the slip band, and hence its width. The maximum density of screws before annihilation is 1/hC2, so the number of cross-slip events in a band of length L is less than L/hC. The width of the band at each point is approximately hC. Each cross-slip event displaces the band randomly on average by ±hC/2, so the wavy displacement of the band over its length is
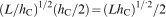
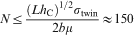
To estimate the work-hardening rate in stage A, we use a two-dimensional version of an equation first written by Hirsch and Lally
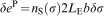
The outcome of these estimates is that in Mg cross-slip causes wavy slip bands, generating a fibre stress which is relieved by twinning, which blocks the band. The result is constant plastic displacement in the band and low work-hardening dependent upon the availability of sources.
The case for stage I in Cu is rather different from stage A in Mg. According to Fourie,28 the slip line length in highly perfect crystals is 2 mm as opposed to 0·3 mm in Mg. Cyclic plasticity and direct observation56 suggest that the value of hC is 50 nm as opposed to 300 nm in Mg. It is clear from the replica observations that slip lines are much more finely distributed in Cu than in Mg. The trains of dipoles are likely to be stopped by clumps of grown-in secondary dislocations, as observed by the etch-pit experiments of Argon and Brydges:75 twinning plays no role. The stress required to activate the secondary dislocations is likely to be equal to the flow stress, rather than 10 times it, as in Mg. Using equation (21), the upshot is N⩽20, rather than 150 in Mg. This is in adequate agreement with experiment, summarised in the section on ‘Slip bands and models for them’.
It follows that if the crystal orientation is such as to activate secondary slip, the displacement in the band is limited not by crystal perfection but by secondary flow from the outset, so the extent of stage I drops to zero, as observed.
In both Mg and Cu, it seems that the behaviour of the first stage of work-hardening depends strongly on crystal perfection. This is because the trains of dipoles associated with the laminar flow are very weak obstacles. To quote Hirsch,13 ‘Some other hardening mechanism must be present to make the hardening from multipoles effective’. In other words, the Taylor-like hardening associated with trains of multipoles is intrinsically very weak.
Because of the little-known distribution of dislocation sources in the virgin crystals deforming in stage I, it seems impossible to make a sound estimate of θI. For any distribution of sources, the first ones to operate will be at the low-stress end. As the sources operate progressively, the easier ones first, they become more numerous and equation (22) shows that the rate of work-hardening will fall. The stress–strain curve will be quasi-parabolic: a feature shown by all the theories.
Exhaustion stages III, IV, C
The later stages of work-hardening are exhaustion stages. During stage II, the ellipsoidal slip bands are confined by secondary slip, producing with each avalanche a population of obstacles. However, the obstacles based on screw dislocation dipoles become exhausted at the onset of stage III, so three-dimensional confinement is lost. Dipoles gathered in clumps are split by the stress, producing mobile edge dislocations which travel through the intervening spaces, encountering neighbouring clumps. As the stress rises, and the dipole sources get used up, they get more numerous. The increment of plastic strain with each increment of stress increases, so the rate of work hardening falls. In the absence of any other process, the rate would fall to zero. Using equation (3) for the distribution of dipole sources, and equation (22) for the hardening rate, Brown77 deduces
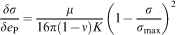
What is of interest here is that the hardening depends very little if at all upon the forest. It is caused by the exhaustion of structures produced by the confined slip in stage II. The notion that work-hardening must become exhausted in this way was suggested in 1948 by Voce,78 based on general arguments not involving dislocations. Voce's ideas were championed and put to effective use by Kocks and Mecking69 more recently. Kocks and Mecking show that a linearised version of equation (23) can represent all their data. Equation (23) accounts just as well for the data and can be related to independently observed microstructural features of the dipole distribution. It also accounts well for the early data of Voce.
Before the rate of hardening falls to zero at σ = σmax, as equation (23) would predict, plasticity in tension becomes unstable and the failure process starts. However, if the orientation is favourable, and the temperature is low enough to prevent them from annealing out, the faulted dipoles in the clumps can act as twin sources. There is a stage B in which elongated deformation twins fill the crystal to a volume fraction of ∼76 until a further stable regime of work-hardening commences. The slip is confined by twin/matrix interfaces, enabling a high rate of work-hardening79 which again stabilises the crystal in tension. This is Niewczas’ stage C: a born-again phase.
In compression, plastic instability is avoided. When the edge dipole sources are used up, the small-angle boundaries with a distribution given by Pantleon's equation (4) can remain in operation and become the major suppliers of mobile dislocations. The exhaustion hardening of stage III is interrupted and stage IV begins. This accords with Pantleon's ideas,58 although the view here is rather different. The stress level at which stage IV commences should be close to σmax in equation (23). This corresponds approximately to the maximum in Pantleon's distribution (equation (4)). At the maximum, to a first approximation, there is a source density independent of stress. This source density, lying dormant at smaller strains, becomes dominant once the edge dipoles are exhausted. The slip distance should be approximately constant, equal to the subgrain size: in other words, about a tenth of the slip line length at the end of stage II. This will produce a low, rather constant, hardening rate, operating at a strongly temperature-dependent stress because of the temperature dependence of σmax. Qualitatively, this is what is observed.
Curve crossing
It is a prominent feature of both cyclic hardening and monotonic hardening that if conditions are altered so that the propensity to cross-slip is changed, the stress–strain curves tend to cross. It is interesting to see how this comes about.
The onset of stage III occurs at a stress which coincides with the saturation stress in cyclic plasticity, itself the same as the fatigue limit in stress-controlled tests. The shear stress is

According to equation (21), the plastic strain in a wavy slip band of thickness hC in stage I is

In the author's treatment of the annihilation of screw dipoles by cross-slip,53 the effect of the applied stress in the cross-slip plane was omitted. In the case of cyclic plasticity, the mean stress in the cross-slip plane is of course zero, so no effect on the saturation stress is expected or observed. However, in the monotonic case, the value of hC should be reduced by the factor (1+SX/SP). The ratio of the two Schmidt factors is listed in Table 1. All that can be said is that variation in orientation should result in crossing curves, and often does, but the rotation of the tensile axis strongly complicates the analysis.
The work of Zaiser80
Zaiser, in a recent review, presents a perspective of work-hardening based on constant intermittency producing scale-free characteristics. His work is concerned with critical exponents, that is, with power-law distributions observed in the neighbourhood of yielding. These exponents do not enter the arguments in this paper, an absence which prevents treatment here of the strain-rate sensitivity of plastic flow. However, except at higher temperatures where diffusion plays an important role, such flow is very insensitive to strain rate, an increase by a factor of 10 producing only a few per cent change in stress. Zaiser studies both single dislocations under stress in the glide plane, and interacting arrays of them, and summarises computer modelling to deduce values for the exponents in the jerky flow which they display. Zaiser follows the yielding transition and shows several instances where under constant stress close to yield one sees scale-invariant behaviour. For example, one finds a power-law dependence of dislocation speed upon time. According to him, this is strictly not self-organised criticality because it treats a system which is not in a steady-state, but it shows what Zaiser calls ‘robust scaling associated with a non-equilibrium critical point’. Zaiser discusses in this context a model of primary dislocation arrays moving cooperatively but inhomogeneously in their slip plane, thereby producing strain gradients. Work hardening of the array, which keeps it just sub-critical, is caused by the strain gradients. Forest hardening does not feature. A strength of the model is that it predicts self-similar strain bursts and self-affine (fractal) slip lines in agreement with some experimental data, including acoustic emission, particularly in hexagonal materials. A weakness of the model is that it does not include cross-slip, so it cannot account for the general shapes of work-hardening curves. It does not attempt to deal with the development of substructure caused by cold-working. A mathematical fitting parameter relates the flow stress to the strain gradients. However, Zaiser's models are of interest because they treat metal plasticity from the modern perspective of scaling laws associated with yielding phenomena.
Consequences
The ideas presented here are not a theory, in the sense of Maxwell's equations! Nevertheless, once one grasps the principle of SOC and the model of the inclined ellipsoidal slip band, there are rationalisations and predictions of behaviour. One can make estimates of nanoscopic, mesoscopic and macroscopic quantities.
The slope of stage II (Table 1) seems adequately predicted. In particular, the effects of multiple slip are rationalised. The main uncertainties in equation (16) have to do with the maximally jammed random structure of ellipsoids, and the relationship between the tilt angles and the aspect ratio(s). The temperature dependence of the slope is very small, proportional to [dαS(T)/dT](1−2αS). The temperature dependence of αS is itself small, as explained in the section on ‘Testing temperature’. This is reduced even further, by a factor of ½ if αS≈1/4. The physical reason for this the dual role of the forest: it stabilises the slip band, but its build-up is itself opposed by the primary dislocations acting as forest.
The effect on stage II of surfaces, so beautifully studied by Fourie,28 can be understood. Near the surface parallel to edge dislocations, surface normal (1,0,0), there is a normal stress σ11 from equation (B5). This must be relaxed at the surface. Either the slip band turns parallel to the surface, or surface tractions must be applied, or both. Either way, both principal components of the fibre stress due to pitch are reduced to zero. Near the surface parallel to screw dislocations, surface normal (0,1,0), the Poisson component σ22 must be relaxed, but σ11 is self-balanced. What happens is that the fibre stress becomes a plane stress, but is only partially reduced. Therefore, near the (1,0,0) surface secondary activity is suppressed, and the deformation resembles stage I. However, near the (0,1,0) surface, stage II can proceed almost as effectively as in the bulk. The stress due to roll is unaffected by the surface. By the same token, one can understand why stage I is prolonged in thin specimens: the fibre stress is not available to activate secondary slip. The hardening rate in stage I is unaffected, as observed.
The number of primary dislocations in a slip band in stage II is consistently estimated to be ∼20. The number can be derived from the angle of inclination of the band, the stress concentration at its tip, and the plastic displacement in the band. See appendix C. The number does not depend upon the material, but only on the geometry of random close-packing of ellipsoids: it is in principle a universal number. It will be of great interest to compare the statistical distribution of the slip band offsets to the distribution of angles in the array of jammed ellipsoids: this is in principle a universal distribution.
The inverse stress dependence of deformation induced subgrain sizes resulting from boundaries, both GNB and IDB, is understood. In most forest theories, experimental data on the mean free path of the dislocations are used, and found to be several subgrains, the implication being that the primary dislocations penetrate them. In the view of collective motion and SOC, the boundaries are formed by secondary slip which stabilises the running bands, so primary dislocations need never cross them. The IDBs should have a spacing at most equal to the width of the slip band, 2c. It follows that the ratio of the slip line length to the IDB spacing, 2a/2c, is less than or equal to 21/2/f2≈21, a constant of the structure and equal to the number of primary dislocations producing plastic displacement in the slip band (Appendix C). The theoretical relationship between the applied stress and the IDB spacing is σ⩽11 μb/2c, in satisfactory agreement with data collected by Raj and Pharr.81
The main effect of alloying on the stress–strain curves, especially the effect on the ultimate tensile strength, is to impede cross-slip by anchoring jogs on screw dislocations in dipoles. This powerfully promotes planarity of slip and delays plastic instability in tensile tests. Because the jogs are accompanied by edge-like stress fields with both compression and dilatation, as well as dangling bonds if there is covalent bonding, almost any added solute will do this regardless of the effect on stacking-fault energy.
From a fundamental point of view, the main new insight is that coarse-grained infinitesimals must be chosen to be large enough to restore the system to SOC after the system progresses through intermittent instabilities. This casts some light on the relationship between engineering continuum theories and intermittent processes on the mesoscale.
There is a consequence for thermodynamics: in ideal SOC, all the work done on the system goes into heat. Imagine loading the system to its flow stress σ, causing an infinitesimal plastic strain, then unloading it. The system has gone from one state of SOC to another, but the internal energy in the two states is identical: all structures in the system stay on the point of flow, and in constant measure throughout the volume. To calculate the work done using infinitesimals, one must think about any rotational work. If the grips are fixed, and the rotations are accommodated by plastic flow throughout the system, the work done is the load on the system multiplied by the plastic displacements required to restore the system to SOC. Expressed per unit volume of the system, this is σδeP. If the rotational work is accommodated externally, the work done is only shape-changing: σδϵP. In either case, expressed in coarse-grained engineering variables, all the work goes into heat. The SOC structure is an ideal dissipative structure which enables the system to withstand strong external forces without storage of internal energy. Of course, stage II hardening is not quite ideal. The slowly rising applied stress level, which acts as the tuning parameter to keep the system in SOC, produces with each avalanche of slip a region of slightly increased forest density, so there is a very small increase in internal energy. After a very large number of avalanches, typically 107, this causes a change in deformation processes leading to another pattern of flow or to fracture. It is fascinating that the work-hardening of metals exemplifies in a practical system of engineering significance many of the abstract principles expounded by Ilya Prigogine.86 I think it likely that the principle underlying the scale-independent relations (13) and (14), as well as the relationship between aspect ratio of the bands and the distribution of angles (Appendix C) is the principle of maximum entropy. If entropy is defined as the logarithm of the number of ways the dislocation structure can respond to the applied force (an intensive variable) and if the entropy function does not become infinite in some position, then entropy (an extensive variable) is obviously maximised if the probability of an avalanche is uniform throughout an infinite structure. In such an idealised system this leaves possible only a scale-independent relationship between the variables. In reality it is subject to the limitations of the size of the system (surface effects, precursor effects) and to the exhaustion of possible fundamental mechanisms of flow.
Footnotes
Acknowledgements
I am most deeply indebted to Peter Hirsch, to whose thoughtful criticisms85 of an earlier version![]() this is a belated reply. I am deeply aware of the possibility of misrepresenting or of not acknowledging properly the work of the many scientists who have contributed to this central problem. Please write to me with your concerns. I am indebted as always to the Cavendish Laboratory and to Robinson College for support.
this is a belated reply. I am deeply aware of the possibility of misrepresenting or of not acknowledging properly the work of the many scientists who have contributed to this central problem. Please write to me with your concerns. I am indebted as always to the Cavendish Laboratory and to Robinson College for support.