
Abstract
A maraging steel with a composition of Fe–12·94Ni–1·61Al–1·01Mo–0·23Nb (wt-) was investigated. Optical, scanning electron and transmission electron microscopy and X-ray diffraction analysis were employed to study the microstructure of the steel after different aging periods at temperatures of 450–600°C. Hardness and Charpy impact toughness of the steel were measured. The study of microstructure and mechanical properties showed that nanosized precipitates were formed homogeneously during the aging process, which resulted in high hardness. As the aging time is prolonged, precipitates grow and hardness increases. Fractography of the as forged steel has shown mixed ductile and brittle fracture and has indicated that the steel has good toughness. Relationships among heat treatment, microstructure and mechanical properties are discussed. Further experiments using tensile testing and impact testing for aged steel were carried out.
Introduction
Commercial maraging steels are very low carbon iron–nickel alloys, with sufficiently high nickel content (mostly 18 wt-) to produce martensite following air cooling to room temperature upon solution treatment.1,2 The term maraging is derived from martensite age hardening, and it denotes the age hardening of a low carbon, iron–nickel lath martensite matrix.
Maraging steels are precipitation hardened by aging, the hardening phase being intermetallic compounds of nickel with molybdenum, titanium or other alloying additions. In aged condition, maraging steels are characterised by high tensile strength combined with high toughness and good weldability and malleability.1
Nickel has been widely used in maraging steels. The advantages are that nickel not only raises the yield strength of iron3 but also lowers the ductile–brittle transition temperature (cleavage) of iron, so it is an alloying method of raising strength and increasing toughness.4,5 However, the high nickel content has cost implications, leading to the application of these steels being largely restricted to specialised sections such as aerospace. This has generated attempts to develop alternative compositions giving equivalent properties at reduced cost.
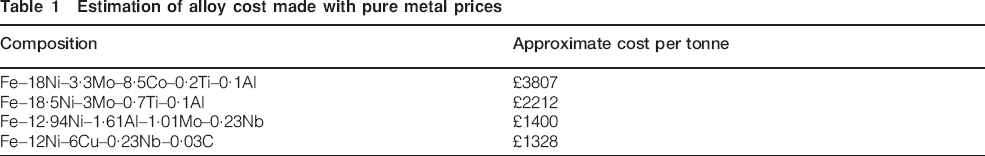
Table 1 shows the compositions of existing and experimental maraging steels and their approximate alloy costs per tonne. Alloy savings of about £2400/tonne are possible on 12 nickel steels compared with standard 18 nickel steel, and about £800/tonne on 12 nickel steels compared with standard cobalt free 18 nickel steel. The alloy costs shown in Table 1 are based on recent prices in the UK for pure metals and, therefore, are for illustrative purpose only because, obviously, metal prices change with time and place.
Estimation of alloy cost made with pure metal prices
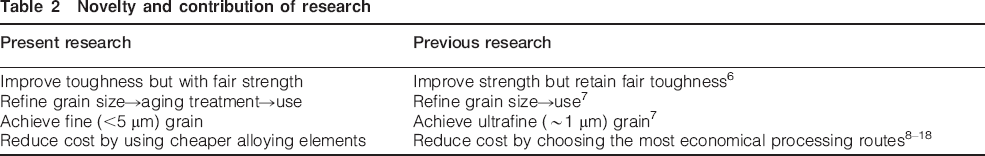
In order to achieve a better understanding of the function of nickel in maraging steels, the Fe–12·94Ni–1·61Al–1·01Mo–0·23Nb (wt-, for all compositions in the present paper unless otherwise specified) maraging steel was made and investigated in the present work. The eventual aim of the research was to develop novel grain refined maraging steels with reduced nickel content, for high strength applications with good toughness at a reduced steel cost. The objective was to complete laboratory scale manufacturing, mechanical testing and microstructural characterisation of the maraging steel. The main contribution of the present work would relate to commercially viable steels. Table 2 highlights the difference between our philosophy and the previous research6–18 in developing high strength steels.
Novelty and contribution of research
Experimental
The steel material was vacuum melted at Ross & Catherall, Killamarsh (Sheffield, UK). To homogenise and break up the as cast structure, the maraging alloy was upset forged at Tata Steel Specility (Sheffield, UK), from 70 mm diameter billet×∼170 mm in height to 25 mm thick disc×145 mm diameter at 1200°C, followed by air cooling to room temperature. The composition of the steel is given in Table 3.
Steel composition in wt- except when indicated as ppm

Two pieces of the forged steel were submitted to the Thermal Analysis Laboratory, Swinden Technology Centre (Rotherham, UK), for Ac1/Ac3 and Ms/Mf phase transformation determinations using a Bähr Thermoanalyse dilatometer DIL805 (Bähr Thermoanalyse GmbH, Hüllhorst, Germany). Standard samples, 10×4 mm (length×diameter), were machined and used. The test cycle consisted of heating at a linear rate of 50 K min−1 to 1200°C, holding for 30 min, before cooling at a linear rate of 50 K min−1 down to 30°C. The testing was carried out in vacuum conditions.
Small samples from the steel were subjected to aging treatment at different temperatures, 450, 500, 550 and 600°C, for times near 0·25, 0·5, 1, 2, 4, 8, 16, 32, 64, 128 and 256 h. The samples were heated uniformly in a furnace, and the oxidised surface layer was removed by cutting, followed by conventional metallographic procedures of sample preparation, including mounting, grinding, polishing and etching.
For optical microscopy and SEM, a typical etching procedure was carried out using a solution of 5HNO3 acid in ethanol, to reveal the grain boundaries and precipitates. The etching time was 5–10 s.
Optical microscopy, SEM and TEM were used to observe the microstructure. Using the electron microscopy techniques, precipitates were examined, and the size of the precipitates was compared during the aging treatment.
For TEM, 0·3 mm thick slices cut from the heat treated blocks were ground to <30 μm thick using sandpaper. Discs with a diameter of 3 mm were punched out from the thin slices to be prepared for the thin foils for TEM using a twin jet polisher in a solution of 10 perchloric acid in glacial acetic acid.
Hardness tests with a 2 kg load were conducted using a microhardness machine. Tensile tests were carried out to determine the strength and elongation at fracture. Impact tests were used for measuring the toughness of the material, followed by fractography at room temperature. Substandard half-size V notch specimens were used, 5×10×55 mm. For testing above room temperature, the specimens were placed in air circulating oven at intended testing temperatures for 30 min and were transferred to a Charpy machine. The Charpy impact specimens were made, and the tests were carried out by Sheffield Testing Laboratories (Sheffield, UK), in accordance with BS EN 10045-1 and ISO 6507-1.
Thermodynamic calculations using Thermo-Calc were used to find out equilibrium phase types, fractions and compositions at different aging temperatures.
Results and discussion
Phase transformation determinations
The phase transformation temperatures were assessed and were labelled in the dilation curves shown in Figs. 1 and 2. Note that the Ac3 values were difficult to determine due to the curved nature of the dilation trace. The measurement here followed the standard way of measuring Ac3 as used in Refs. 19 and 20, where Ac3 is defined as the temperature at which expansion begins again to depend linearly on temperature once the sample is fully austenitic.19
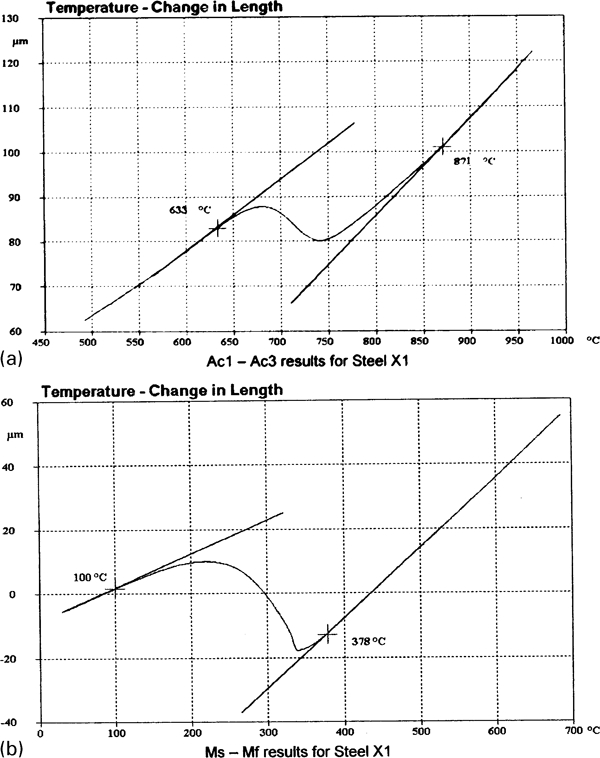
Dilation curves of as forged steel
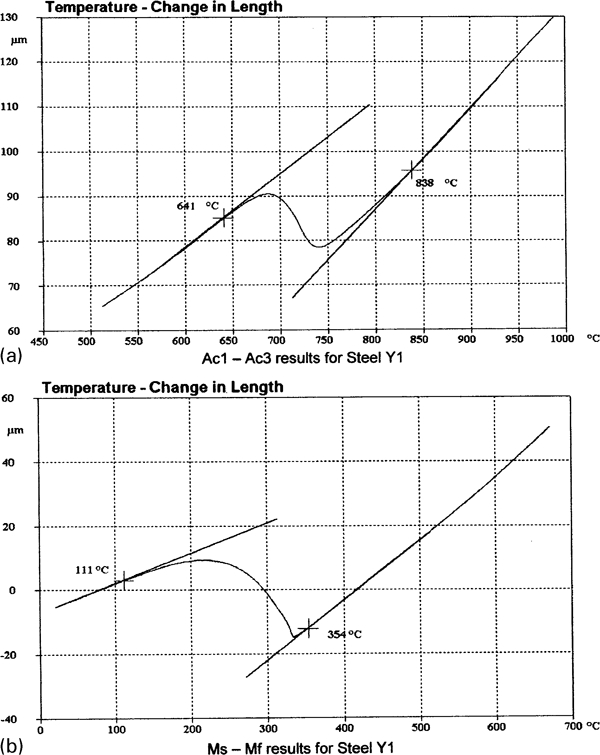
Dilation curves of as forged steel after cooling to −196°C
Koistinen and Marburger have shown for athermal martensite that the volume fraction transformed y at temperature T may be related to the martensite start temperature Ms by an expression of the form21
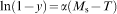
K–M analysis of dilatometer curve for as forged steel
Hardness
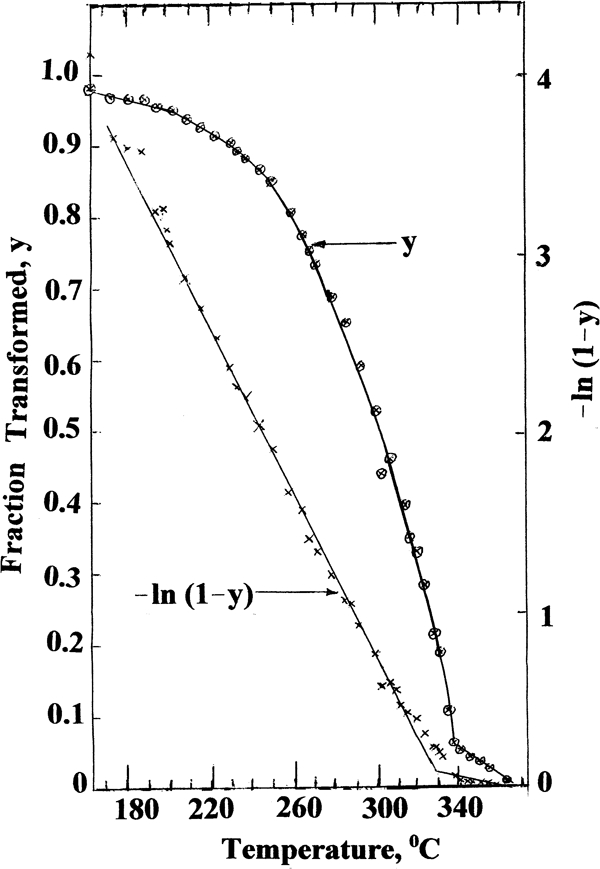
There is a close relation between hardness and precipitation in maraging steels. The hardness data in Fig. 4 show age hardening curves of the maraging steel at different aging temperatures. When aged at the lowest temperature of 450°C, the steel can attain the average hardness of 401 HV2 after 1 h aging. Both 550 and 600°C aging temperatures have led to rapid hardening responses. At 600°C aging temperature, the hardness reaches its peak when the aging time is 0·25 h, with the maximum hardness of 467 HV2, followed by slow reduction to 301 HV2 after aging for 257 h. It takes 2 h for the steel at 550°C aging temperature to reach the peak hardness of 496 HV2. The hardness increase rate is marginally slower than at 600°C aging temperature. Aging at 450°C gives the lowest hardness increase rate and requires the longest time of 66 h to reach the peak hardness 500 HV2. When aged at 450°C, the hardness keeps increasing up to and likely after the longest aging time used at this temperature. Moreover, at a higher aging temperature of 500°C, the maximum aging hardness is the same as the maximum hardness at 450°C, within error ranges. The peak hardness is 501 HV2 at 17·35 h.
Age hardening curves, showing variation in hardness, with aging time, in maraging steel aged at 450–600°C
The hardness test results illustrate that similar peak hardness can be reached at all four aging temperatures, but the time of reaching the peak hardness is different. This permits the presumption that similar microstructures with the peak hardness can be achieved by aging at these four temperatures for different times. Precipitation plays a dominant role in hardness of maraging steels. Other factors are retained or reverted austenite content and dislocation density change. In this work, no austenite was detected by X-ray diffraction (XRD) throughout the aging process (see next section), so this factor has no contribution. The aging was performed in a temperature range of 450–600°C. Therefore, if we assume that the dislocation density change is comparable at different temperatures when the peak hardness is reached (i.e. shorter time at higher temperatures and longer time at lower temperatures), we would lead ourselves to a belief that similar size precipitates are similarly distributed in the matrix when the peak hardness is achieved.
It should also be noted that the hardness after aging at 550 and 600°C temperatures decreases not long after it reaches the peak. Moreover, the hardness keeps increasing up to and likely after the longest aging time at 450°C. The hardness after aging at 500°C temperature displays a large plateau around the peak hardness and shows almost no decrease. These interesting results may be explained from two points of view. On the one hand, aging temperatures of 450 and 500°C are not sufficiently high for the precipitates in the steel to grow quickly, while 550°C is high enough for them to grow to large sizes after long aging times. Therefore, overaging happens to the steel relatively early when aged at temperatures of 550 and 600°C than at the temperatures of 450 and 500°C. On the other hand, when the aging temperature is as high as 550°C, after a relatively long aging time, some amounts of reverted austenite may form around some nickel rich precipitates.1 They may also be responsible for the decrease in the hardness.1
As a cross-check of the accuracy of the hardness measurement, some specimens were tested under 30 kg load using a conventional hardness machine, by two operators, independent from the authors. In the first such test, the measurement result for nine specimens (four readings from each specimen) aged at 550°C for 10 h and air cooled is 488±2 HV30, with error at 95 confidence limit. In the second separate test by a different operator of six of the nine specimens (four readings from each specimen), the average hardness is 499±2 HV30.
Microstructure
The microstructure of the steel after etching is shown in Fig. 5. The martensite laths and the grain boundaries are revealed. After aging for a long time at 550 or 600°C, some dark areas are revealed, probably related with overaging products.
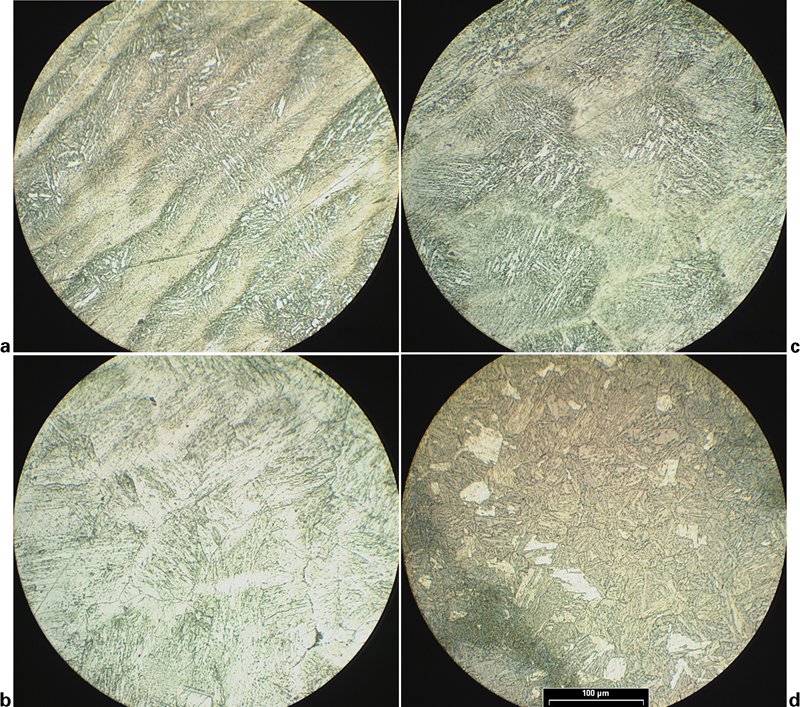
Optical micrographs before and after aging (same magnifications, scale bar = 100 μm)
The martensite laths and the grain boundaries are more clearly revealed in SEM images, as shown in Fig. 6. Very fine precipitates can be found homogeneously lying on the surface. Under the TEM, the microstructure consists of martensite laths with many precipitates in the lath matrix randomly (Fig. 7). With increasing aging time, small precipitates become large very slowly.
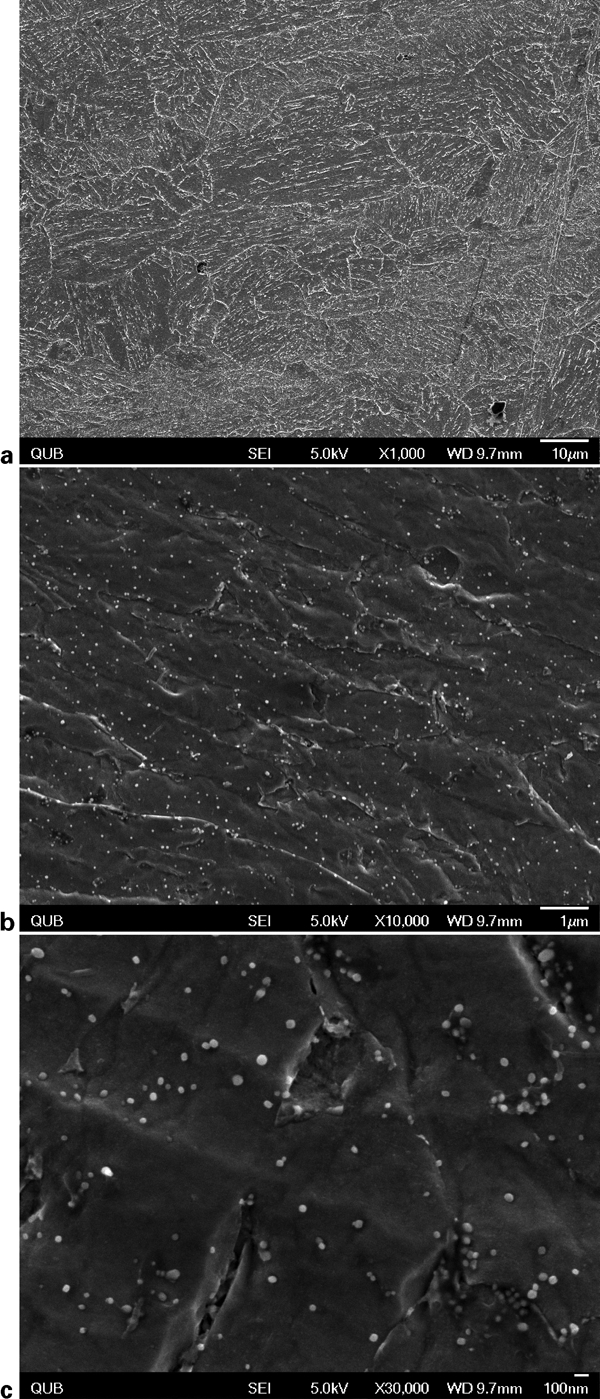
Images (SEM) after aging
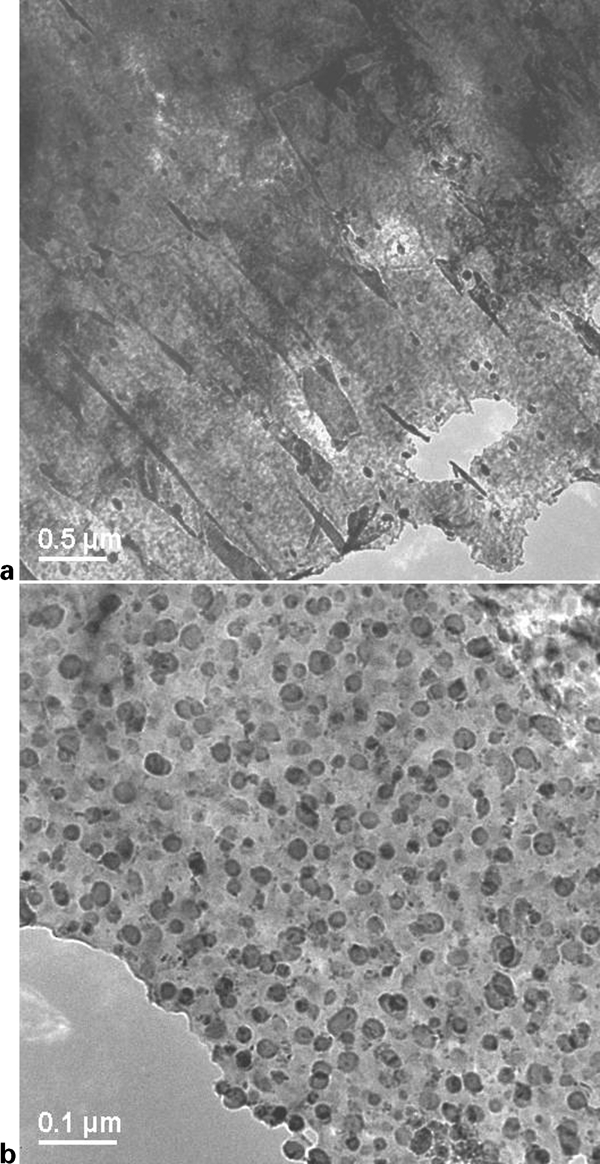
Images (TEM) after aging
The size of the precipitates was individually and manually (albeit with the aid of a computer when measuring distances) measured on SEM images. No steps were taken to allow for the projection effects.23 Note, however, that the measurements here did not include number, spacing and volume fraction of the particles. Table 4 compares the size of precipitates measured at different aging times, which includes data for the number of precipitates measured from each of the two images for each aging condition. The measurements on the SEM images could have three sources of errors. Because some particles might have more than half of their volume embedded in the matrix and the sectioning nature of the imaging, the measured diameter might be the diameter of the exposed spherical cap instead of the diameter of the particle sphere, assuming spherical particles. This would result in underestimation of precipitate size in SEM measurements. On the other hand, the SEM might not have picked up all of the particles given the scale of the observations. This would lead to overestimation of the precipitate size due to not including the smaller particles in the counts. The two error sources would give opposite errors and so they might cancel each other out to some extent. However, it is believed that the error values shown, using standard deviations, are mostly from the real scatter of precipitate sizes, instead of from measurement errors.
Comparison of size of precipitates after aging at 500°C measured in SEM images
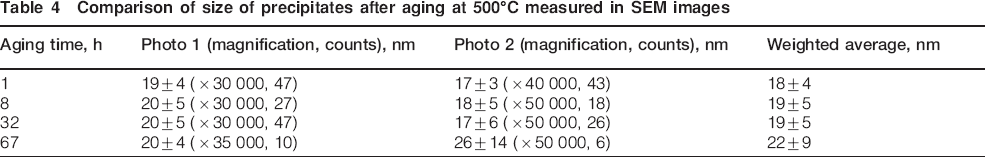
Another source of error in SEM at such high magnifications is the local sampling. The technique cannot easily reveal any possible long range variation in precipitate size and density due to, for example, inhomogeneous chemical composition. The two photos for each aging condition in Table 4 were taken from the same metallographic specimen, but different locations.
X-ray diffraction analysis was used to detect the existence of reverted austenite during aging treatment, but no reflection peaks for fcc austenite were found after aging at either 550 or 600°C. The darkening in Fig. 5d does not seem to be related to austenite. Otherwise, such an austenite fraction would have been detected by XRD analysis.
Thermodynamic calculations
Thermodynamic calculations of equilibrium phases, phase fractions and their compositions in the Fe–12·94Ni–1·61Al–1·01Mo–0·23Nb–0·0046C (wt-) system were made at 450, 500, 550 and 600°C. The equilibrium calculations were made with Thermo-Calc version L, using the Scientific Group Thermodata Europe solution database. The phases permitted in the calculations are liquid, fcc, bcc, hexagonal close packed, diamond, graphite, σ, Laves, R, P phase, μ, χ, MoNi δ, MoNi4 β, MoNi3 γ, Al13Fe4, Al2Fe, Al5Fe2, Ti3Al, TiAl, cementite, ξ carbide, M23C6, M7C3, M6C, M3C2, V3C2, MC η, M5C2, Al3Ni, Al3Ni2, AlNi B2, AlCu θ and FeCN χ. It would be impractical to list the components in each of these many phases, but the components in each of the equilibrium phases will be given further below when showing the calculation results.
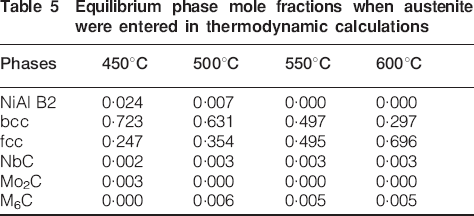
The equilibrium phases and their mole fractions are given in Table 5, when the calculations included all the phases listed above. In this table, the fcc phase is the austenite. X-ray results showed, however, that this phase did not form even after the steel was significantly overaged, for 257 h, the longest aging period. These results, although showing the real equilibrium state, have no practical value because, in the actual aging process of this steel at these temperatures, austenite does not form due to its slow kinetics. The reason for this is that, due to the virtually zero carbon in the bcc, the difference between austenite and bcc compositions is mainly nickel content. Therefore, the formation of austenite is controlled by the diffusion of nickel, plus the driving force for the formation of different phases. Among the precipitation phases in Table 5, AlNi has a very fast kinetics,1 as well as the carbides, because carbon has a faster diffusion rate than the substitutional elements. Because the results in Table 5 have no practical value, we will not continue to show and discuss the compositions of each phase in detail.
Equilibrium phase mole fractions when austenite were entered in thermodynamic calculations
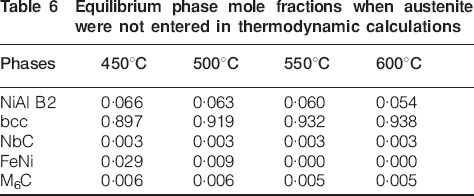
The austenite phase was then excluded from the calculations, which is more relevant to the practical heat treatment of maraging steels (Table 6). NiAl was found to be the main precipitation phase, in agreement with a previous atom probe work characterising precipitates in an aluminium containing precipitation hardening steel.1 The calculated composition of the NiAl B2 phase is Ni53Al47. The compositions of the FeNi hexagonal close packed phase and all other equilibrium phases are given in Table 7.
Equilibrium phase mole fractions when austenite were not entered in thermodynamic calculations
Components permitted in calculations in each phase and their concentration ranges in atomic per cent from 450 to 600°C*
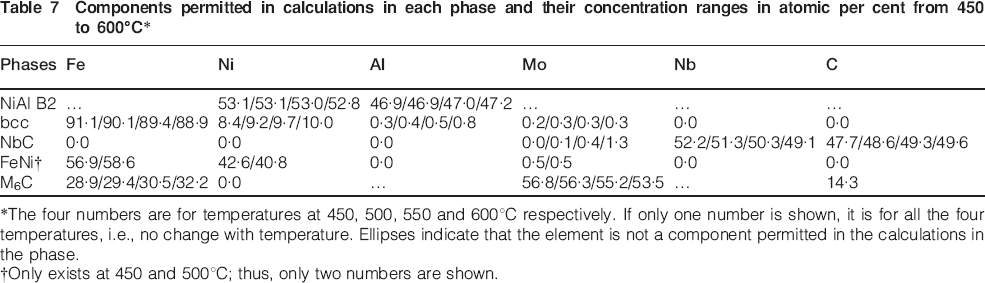
*The four numbers are for temperatures at 450, 500, 550 and 600°C respectively. If only one number is shown, it is for all the four temperatures, i.e., no change with temperature. Ellipses indicate that the element is not a component permitted in the calculations in the phase.
†Only exists at 450 and 500°C; thus, only two numbers are shown.
Tensile and impact properties and fractography
The tensile properties after aging treatment at 500°C for 2 and 6 h are similar, with tensile strength of 1594 and 1577 MPa respectively. The reduction in area in both cases is 15. These testing results show that the steel has good tensile strength. The elongation was not measured.
The Charpy impact energy values in as forged condition (forged to 25·4 mm thick disc followed by air cooling), before aging, are 36, 33±9, 39±8 and 21±2 J at 21, −78, −110 and −196°C respectively. The steel was tough in this condition because of grain refining with Nb and excess C over stoichiometry of ∼160 ppm C.24 However, the fracture toughness was low after aging. The ductile–brittle transition temperature of the maraging steel, aged at 550°C for 10 h, above room temperature was determined (Fig. 8).
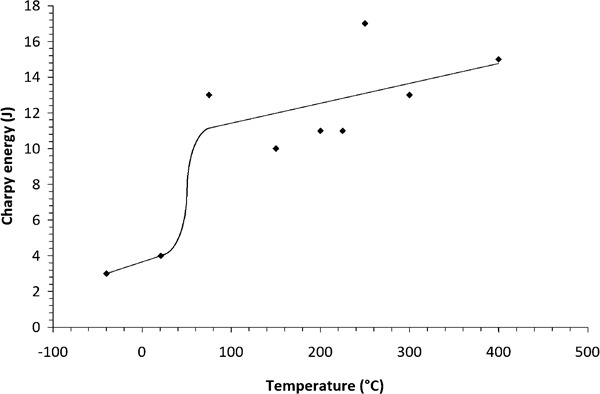
Charpy impact energy as function of specimen temperature at testing: steel aged at 550°C for 10 h
Fractography of the as forged impact specimens was carried out on a scanning electron microscope. Figure 9a shows that the fracture surface is characterised by radial ridges. These shearing dimples are very big and shallow. Figure 9b and c shows small and deep tensile dimples, with small precipitates at the bottom of many dimples, confirming that the fracture process was typically ductile. The two kinds of dimples emerging on the fracture surface on the same specimens are due to the complicated stress experienced by the Charpy impact specimens. They also show that the steel has good toughness under the as forged condition.
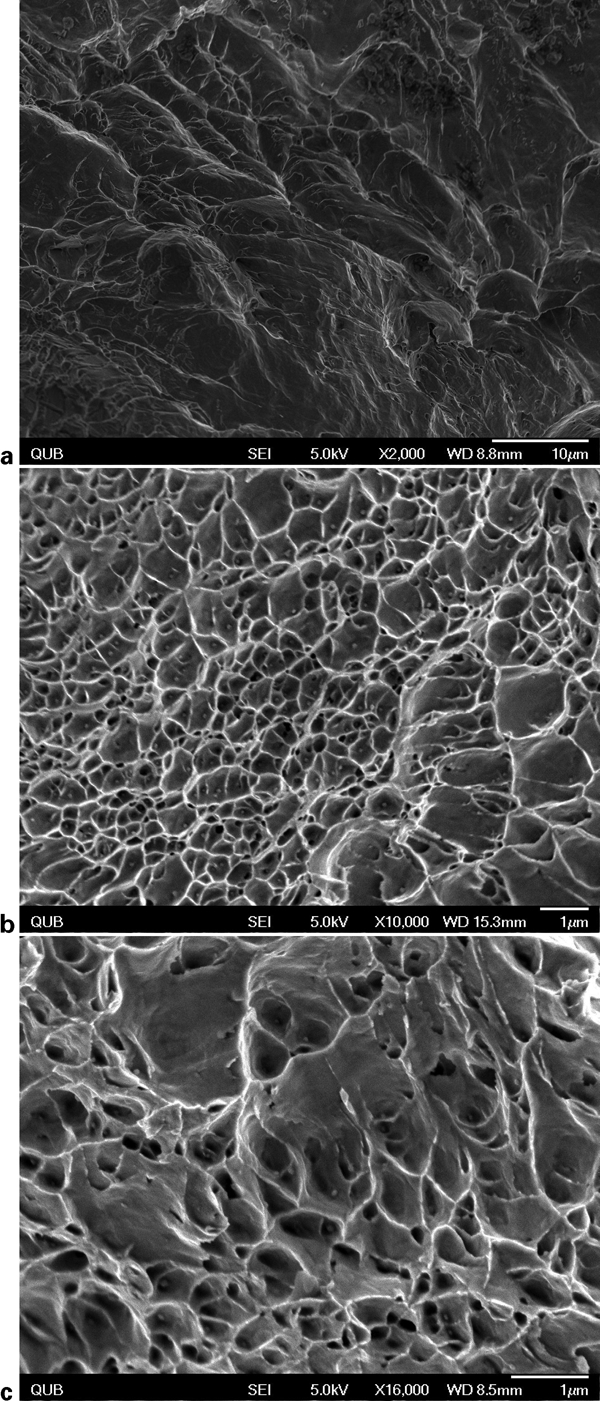
Fractographs of as forged impact specimens at increasing magnifications
The properties of this steel may be compared with its most equivalent but more expensive commercial counterpart, the VascoMax T-250 (Fe–18·5Ni–3Mo–1·4Ti)25 as follows. Following aging treatment, T-250 has Rockwell C hardness of 49–52 HRC, equivalent to 498–544 HV10, tensile strength of 1793 MPa and reduction in area of 58. Its room temperature Charpy V notch energy is 34 J, translating to a value on half-size specimen, as used in the testing of the new steel here, of 17 J. Comparing with data obtained for these properties of the low nickel maraging steel, it can be seen that the low nickel maraging steel has matched the commercial maraging steel in its hardness and strength, but is low on ductility and toughness.
Conclusions
In summary, the present work shows the age hardening behaviour of the maraging steel. Investigation of the microstructure and mechanical properties of the steel with reduced nickel has been carried out. The main conclusions are as follows.
There is rapid age hardening across the aging treatment temperatures of 450–600°C.
There are no significant changes of grain size and precipitates.
There is no reverted austenite detected by XRD.
The steel is tough before aging, but extremely brittle at room temperature after aging, with high tensile strength and hardness.
Thermodynamic calculations show that NiAl is the major precipitate phase at 450–600°C.