
Abstract
It is shown how new discoveries and advanced experimental techniques in the last 25 years have led to paradigm shifts in the analysis of deformation and annealing structures of metals and in the way the strength of deformed samples is related to structural parameters. This is described in three sections: structural evolution by grain subdivision, recovery and recrystallisation and strength–structure relationships.
Keywords
Introduction
Materials science and engineering during the last 25 years has been based on the foundation of the experimental and theoretical work in the preceding 30–40 years, which have given unprecedented leaps in the understanding of the physical and mechanical behaviour of metals and alloys. Well known examples from this period are the structural evolution during plastic deformation, recrystallisation and strengthening mechanisms,1–4 which have been chosen as the principal themes in the present paper. The reason for this choice is that new discoveries and advanced experimental techniques have created paradigm shifts in the way deformation and annealing structures are characterised and analysed. Concerning deformation, this shift has led to a unified description based on general principles of the structural evolution under different loading conditions covering a variety of metals and alloys.5–8 The shifts have also enabled quantification of important structural parameters, which form the basis for analytical modelling and simulation and in turn have led to improved structural property models. In parallel, the increase in computer power has created another paradigm shift, which has led to the introduction of modelling and simulation down to the atomic scale of the microstructural evolution under mechanical loading. Concerning recrystallisation, the shift has encompassed a transition from understanding recrystallisation as occurring in a continuum to the realisation that recrystallisation can only be understood if the nucleation and growth recrystallisation processes are directly related to the local heterogeneous deformation structure. Similarly, the introduction of techniques for local orientation measurements has led to a shift from mostly considering an overall texture during recrystallisation to a realisation of the importance of the local crystallography. Finally, the evolution in structure and structural parameters during mechanical and thermal loading has introduced new strengthening parameters, and advanced techniques have allowed the structural parameters to be quantified. As a result, strength–structure relationships are now much better understood. However, understanding strain hardening is still a challenge.
The unified description of the structural evolution during plastic deformation can be described as a structural subdivision by dislocation and high angle boundaries forming hierarchical structures on a finer and finer scale as the strain is increased.9 This structural evolution has led to a shift in the structural analysis from considering only a simple cell structure to an analysis of structures where dislocations are organised in more complex two- and three-dimensional (2D and 3D) configurations. This shift has enabled a realistic structural description based on a number of structural parameters. This structural characterisation has unravelled a close correlation between the deformation microstructure and the crystallographic orientation of the grains in which they evolve.10 The analysis of this correlation has shown that it has its cause in an interrelationship between the deformation microstructures and the active slip system, which depend on the grain orientation and the external loading conditions.11 An important link has therefore been created between the evolution of microstructure and the preferential crystallographic orientation (texture) during plastic deformation,12 which applies to both polycrystals and single crystals where the dominating deformation mechanism is dislocation glide.
The analysis of structures over the past 25 years has been closely linked to the invention and development of advanced and new microscopical techniques that now allow structural parameters to be quantified relatively easy with high accuracy and at high speed. In the field of transmission electron microscopy, by combining imaging with Kikuchi pattern analysis, different types of dislocation boundaries can now be characterised with a very high spatial resolution.13 As a complementary technique, electron back scattering diffraction (EBSD) in a scanning electron microscope has been introduced, and this technique now allows rapid and automated data acquisition from large areas of bulk samples where the morphology and crystallography can be characterised simultaneously (orientation imaging). A detailed characterisation of dislocation structures by this technique is, however, not feasible. The development of microscopical techniques has, in recent years, been supplemented by other techniques for structural characterisation. A technique on the atomic scale is atom–probe–field–ion microscopy, which allows the concentration and distribution of individual atoms to be analysed. On a larger scale, other techniques apply high energy X-rays. New techniques now allow a 3D characterisation of both dislocation structures and changes in morphology and crystallography of volumes positioned in the interior of a bulk sample exposed to external loading or thermal treatment.14
The paradigm shifts in the field of characterisation and analysis of structure have been paralleled by the introduction of the following:
continuum modelling enabling a mechanically based analysis of polycrystal plasticity and textural evolution
dislocation dynamic simulations of dislocation interactions and storage
atomistic simulations of structure and mechanical properties.
The scale of continuum modelling is at present above the scale of a typical deformation structure, and atomistic [molecular dynamics (MD)] simulations are linked to the nanometre range. However, the gap between models is closing in, leading to modelling schemes which, through a stepwise approach, can link the atomic scale with the component dimensions.
The evolution in R&D described above has, in recent years, been strongly influenced by a demand for stronger and lighter materials and components, and the route is towards a structural refinement in order to increase strength and reduce weight. This has led on the micrometre scale to advanced and new industrial materials and on the nanometre scale to the development of new processing techniques to produce samples with a structural scale reaching down to the atomic dimension.15
In this introduction to the advances in research and development during the past 25 years, the authors admit a certain bias in the selection of themes. However, these themes will in the following sections be broadened in the form of an overview covering the following areas: deformation structures, recrystallisation and strength–structure relationships. Experimental evidence and analytical models will be reviewed and discussed. However, all areas will be based on a characterisation of the deformation microstructure subdivided by dislocation and high angle boundaries, also considering that heterogeneities in the structure can have important bearings on both recovery and recrystallisation and on mechanical properties.
Microstructural evolution by grain subdivision
During plastic deformation, a very large fraction of the mechanical energy is released as heat, and only a small amount is stored in the metal, mostly in the form of dislocations and vacancies. With the advent of the transmission electron microscope, it has been observed that the dislocations are not distributed at random, i.e. they organise themselves into characteristic configurations. One such configuration is the cell structure, where a dislocation cell is a volume element (almost) free of dislocations delineated by dislocation boundaries. Structures with these characteristics have been observed throughout various workhardening stages in many metals and alloys deformed under different loading conditions, 1 1,2 and they have been characterised broadly as dislocation cells and subgrains as descriptive (and broadly accepted) terms. Characterisation in more detail in the 1980s, however, revealed that the structures produced by glide are predominantly composed of extended dislocation boundaries termed dense dislocation walls, 16 16,17 delineating volumes which are subdivided by boundaries with a much lower content of dislocations. It was also observed that the crystal lattices separated by a dislocation boundary are rotated with respect to one another with an angle depending on the dislocation content in the boundary. This angle, the misorientation or disorientation angle, has since been a key structural parameter, which, together with the spacing between boundaries, creates the basis for the characterisation and analysis of deformation microstructures. 7 17 7,17,18
The observation of planar extended boundaries (dense dislocation walls) and their characterisation, which showed that they are dislocation rotation boundaries, suggested that they are low energy dislocation structures.19 Such structures are, in general, favoured over a random distribution of dislocations due to a reduction in elastic energy per unit length of dislocation line, which leads to a separation of dislocations into regions with high and low dislocation density, which is in accord with the microscopical observations. In a following step, the term cell block (CB) was introduced (see Fig. 1) and defined as a contiguous group of cells in which the same set of glide systems operates. 6 6,20 The number of glide systems is assumed to be fewer than the five systems needed to satisfy the Taylor criterion for deformation of polycrystalline materials, namely, homologous deformation.6 However, a group of CBs may collectively fulfil the Taylor criterion. The slip pattern will cause a strain in a CB that is different from the macroscopic strain, and the strain differences are accommodated by the formation of CB boundaries which have therefore been termed geometrically necessary boundaries (GNBs).21 The different slip activities on each side of a GNB may have its cause in the operation in neighbouring regions of different sets of slip systems or a different partitioning of the total shear among a common set of slip systems. As to the cell boundaries, they have been termed incidental dislocation boundaries (IDBs)21 because they are assumed to form by mutual and statistical trapping of glide dislocations. In addition to the CBs, the dislocations can, however, organise in many different configurations, for example microbands, S bands and shear bands, leading to the suggestion of a number of definitions and a nomenclature. 6 6,7
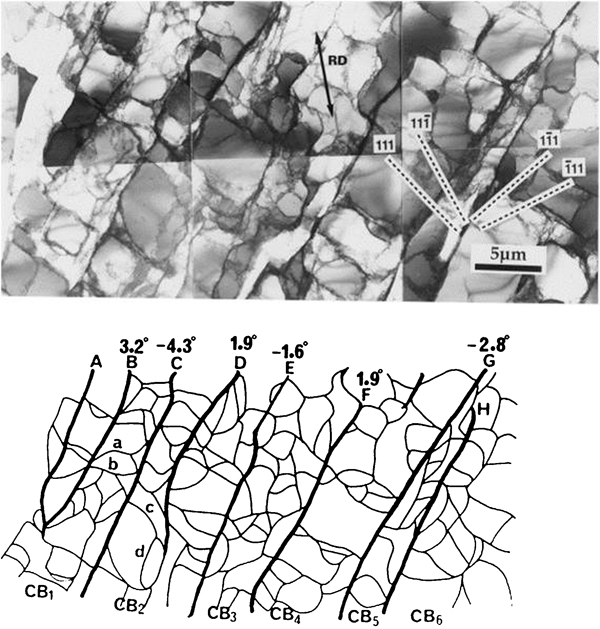
Image (TEM) and sketch of microstructure in grain of 10 cold rolled specimen of pure aluminium (99·996) in longitudinal plane view: markings on sketch show extended boundaries (GNBs) forming CBs subdivided by short cell boundaries (IDBs) (rolling direction is marked RD, and dashed lines are traces of {111} planes)20
The formation of GNBs and IDBs during deformation has created a framework for the structural characterisation of a broad range of fcc and bcc metals deformed by a variety of modes. As an example of the universality of the two types of boundaries, they subdivide fcc single crystals deformed in tension,22–24 compression25 and rolling.26 For polycrystals, the structural evolution resembles that of single crystals, as observed for grain sizes ranging from several hundred micrometres to sizes as small as a few micrometres.10 Grain interaction effects may lead to changes in the microstructure and local crystallography near grain boundaries and triple junctions. 10 10,27 However, a more typical observation for medium to high stacking fault energy metals is that the interior structure extends to the grain boundary supplemented with relatively small regions with a higher dislocation density at or near the boundary. In a more detailed analysis of grain interaction, a polycrystalline copper sample has been examined by EBSD after deformation in tension up to a strain of 2528 (see Fig. 2). In this figure, the small domains of special orientation provide evidence of grain interaction. However, the crystal rotation for the large domains covering most of the grain is consistent with the rotation direction predicted by the Taylor model.
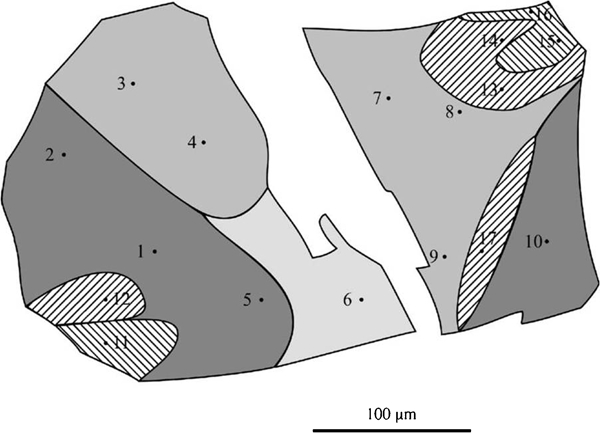
Subdivision of coarse grain in copper deformed in tension at ϵvM = 0·08: grey shaded regions are coarse domains, and hashed regions are grain interaction domains (white domain represents annealing twin)28
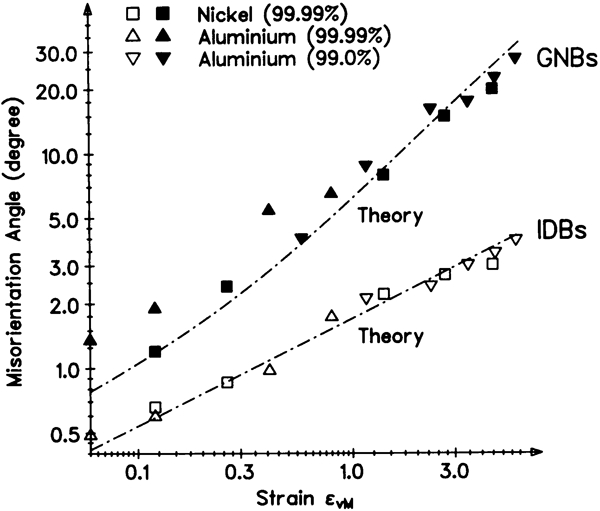
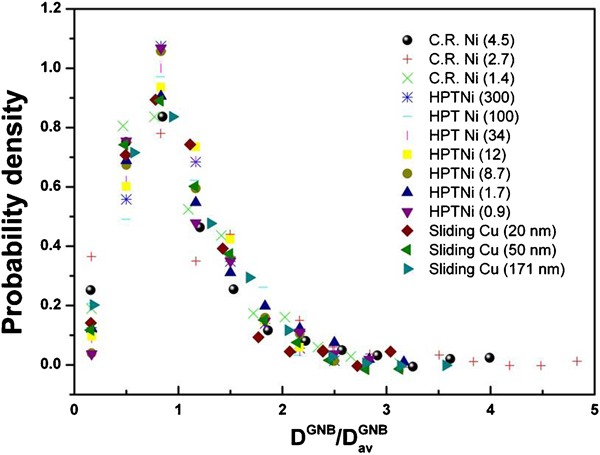
The suggestion that different underlying mechanisms determine the evolution of IDBs and GNBs respectively has been supported by experimental observations, showing that the rate of change of misorientation angle and boundary spacing at increasing strain is significantly different for IDBs and GNBs. This evolutionary trend can continue to a large strain without saturation. As an example, the evolution of the misorientation angle is illustrated in Fig. 3, showing with a good approximation a power law relationship between angle and strain for both IDBs and GNBs, however with significantly different exponents. The observation of a relationship between angle and strain has led to a theoretical analysis29 of the evolution of misorientation angles by considering stochastic and deterministic processes acting separately or in combination (Fig. 4), and calculations have shown a much more rapid increase in misorientation angle when the formation is deterministic compared to a stochastic process [in agreement with the experimental findings (see Fig. 3)]. The classification of dislocation boundaries has also led to an analysis of the distribution of boundary parameters based on a hypothesis of scaling.33 By analysing the distributions of boundary angles and spacings, it has been found that both parameters can be described with a single universal function when each distribution is scaled by its mean angle or spacing. Such a scaling hypothesis applies to both GNBs and IDBs when they are analysed separately but not when they are grouped together (Fig. 5). The scaling of the spacing between GNBs has also shown a similarity in the behaviour of polycrystals and single crystals deformed in rolling and tension, and the similarity has been found for metals deformed from low to ultrahigh strain, reducing the spacing between the GNBs from the micrometre range to a spacing of 50–100 and ∼10 nm for samples deformed by high pressure torsion (HPT) and friction respectively (Fig. 6).31
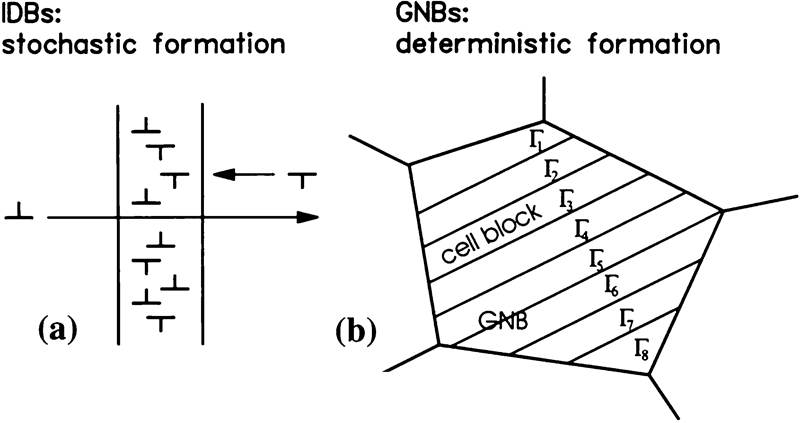
Stochastic and deterministic evolution of IDBs and GNBs respectively
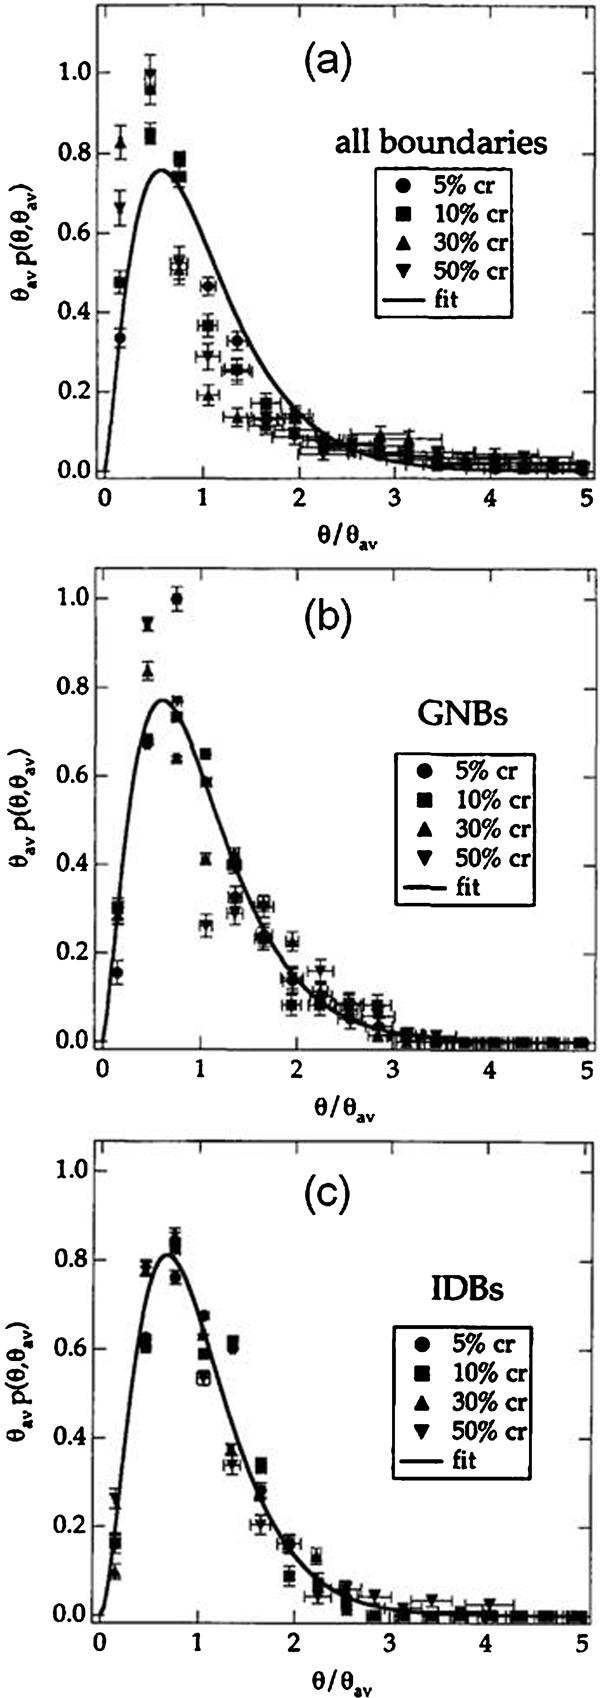
Distribution of measured misorientation angles for IDBs and GNBs in cold rolled aluminium following different amounts of rolling reduction represented by single probability density distributions normalised by their average
In the analysis of the different types of dislocation configurations, the low energy dislocation structure theory 19 19,37 gives principles and guidelines, but it does not allow prediction of specific dislocation arrangements because of the immense number of dislocation configurations which can be constructed from any given dislocation population. This fact and the observation both in single crystals and polycrystrals10 that there is a clear correlation between the characteristics of the deformation microstructure and the crystallographic orientation of the volume in which it evolves initiated a systematic study of this correlation10 in deformed Al, Cu and Ni, especially focusing on the 3D arrangement of the dislocation boundaries and the crystallographic plane of the GNBs for a number of typical configurations (Fig. 7). Most of these studies have been carried out in the low to medium strain range, and they have led to the conclusion that the structural evolution follows a universal pattern. An analysis of the cause of this pattern11 related it to an underlying dependence on the active slip systems and concluded that, if similar systems are active under different conditions, the resulting dislocation structures are also similar. Thereby, a link has been created between the external loading conditions, the grain orientation and the microstructure. This link is important when analysing deformation microstructures, but it must also be taken into account when addressing more general problems related to the polycrystalline behaviour, for example the relationship between strength, structure and texture and the evolution of deformation textures, where the general observations of grain subdivision and the possibility of predicting an actual slip pattern from microstructural characterisation have consequences both for the textural evolution and the texture modelling.38–40
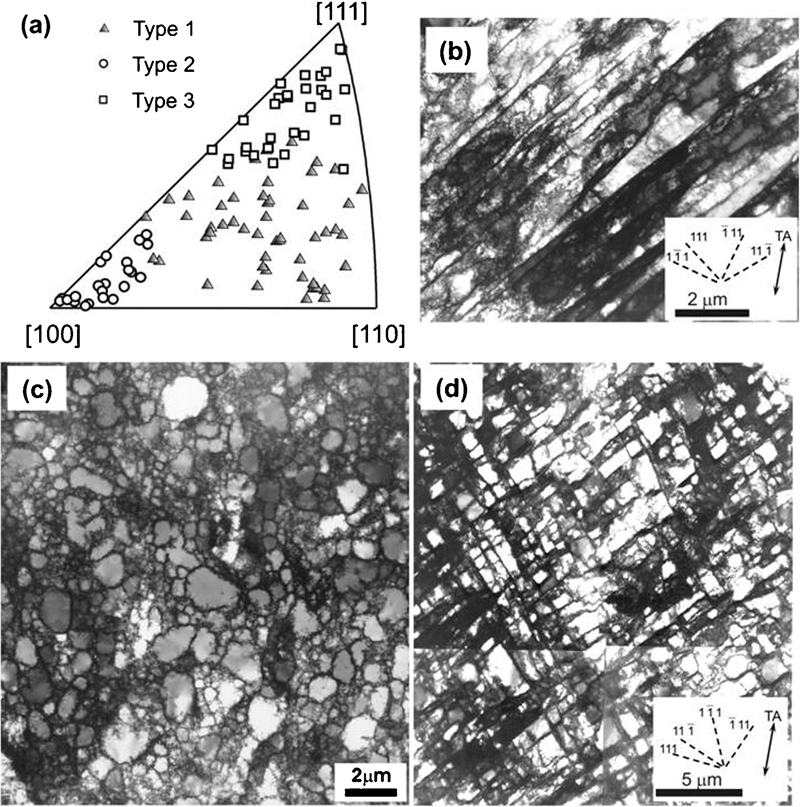
Grain orientation dependent structure types in tensile strained 99·99 Cu (grain size = 90 μm)
The many studies of low to medium strain samples have in the past 10–15 years been supplemented by extensive studies where metals by different processes have been deformed to ultrahigh strains.41–48 The incentive has been to produce materials with an increased strength compared to conventional materials. A main finding when moving to a large strain is that the misorientation angle across deformation induced boundaries can reach values above 15°, i.e. deformation induced high angle boundaries supplement the original high angle grain boundaries. The average angle of boundaries reaches saturation at values of ∼ 40°, and the frequency of high angle boundaries can be as high as 70–80.41 As to the spacing, it decreases with increasing strain, and depending on the material and process, it can reach 50–300 nm, as exemplified in cold rolled Al, Ni, Cu and Fe and in HPT Ni (Fig. 8). The spacing can decrease further to be of the order of 10–20 nm in metals deformed to extreme strains, for example by friction36 or surface mechanical attrition.49 In such samples, typical structures being a result of dislocation glide may be supplemented with deformation twins.49
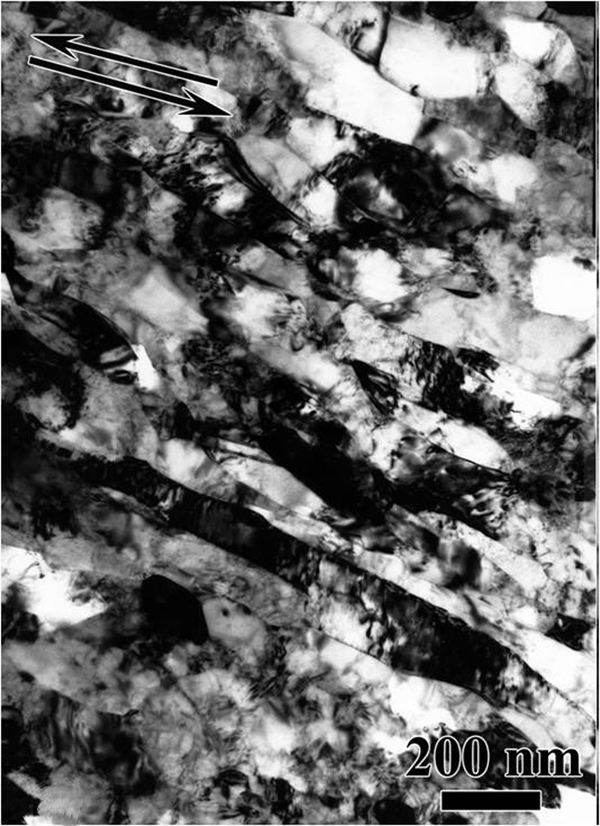
Image (TEM) of microstructure in pure nickel (99·99) deformed by HPT to strain of ϵvM = 100: lamellar boundaries (LBs) are parallel to shear direction marked by double arrows, and dislocation boundaries (IDBs) subdivide volume between LBs forming CB structure35
An example of a deformation microstructure formed during rolling to a strain of ϵvM = 5·8 is shown in Fig. 9. A comparison with Fig. 1 shows that there is a significant change in structural morphology with increasing strain. Boundaries change from being inclined to the sample axes to being aligned with the axes, e.g. in a rolled sample, the CBs become flat and almost parallel to the rolling plane. Figure 9 also shows the crystallographic orientation of the CBs expressed as the typical rolling texture components: S, copper, brass and cube. This is an example of the pronounced structural subdivision that takes place during plastic deformation, and that it is not the entire grain that rotates into a new position as the deformation texture evolves. Individual parts of a grain can rotate towards different end orientations, but together, the rotated CBs form the macroscopic texture components. In addition, for such structures, there is a correlation between the characteristics of the microstructure and the crystallographic orientation of the CB. This correlation creates intrinsic heterogeneities50 in both structure and stored energy, especially important for the characterisation and modelling of the microstructural and textural evolution during recovery and recrystallisation. These intrinsic heterogeneities are, in addition to the extrinsic ones, related to the loading conditions, for example the through thickness variation in microstructure and texture in deformed bulk samples.51
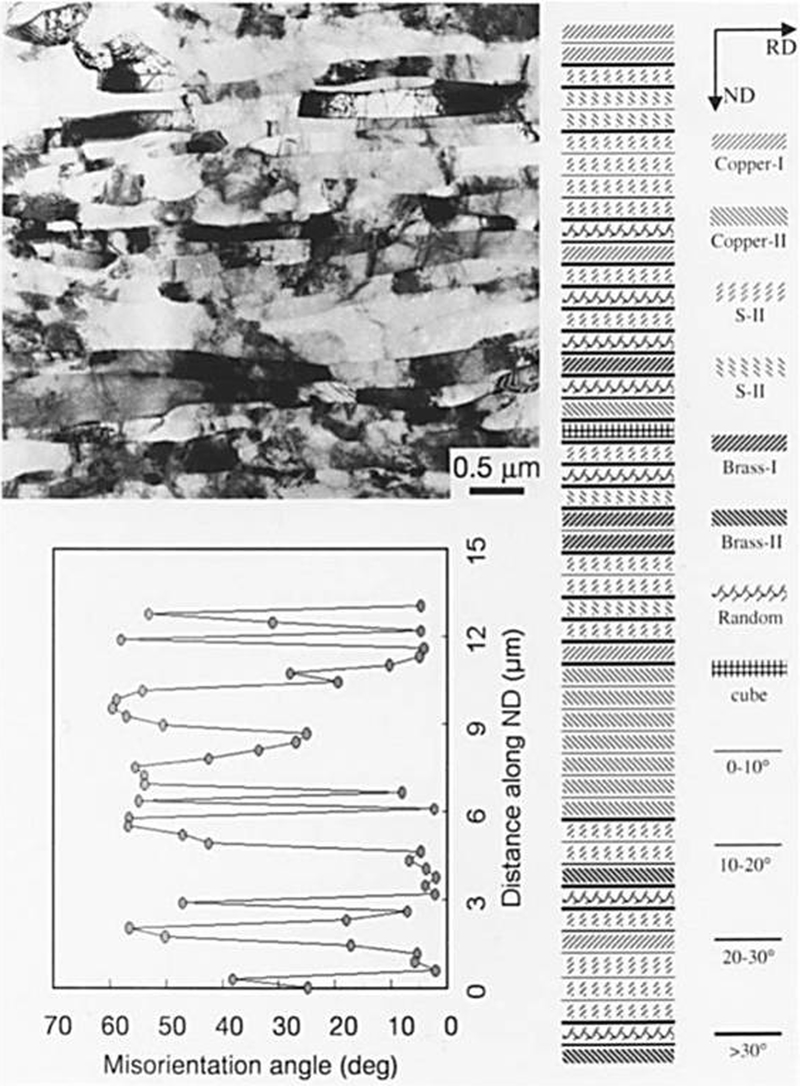
Commercial purity aluminium cold rolled to true strain of 5·0 (ϵvM = 5·8)
Recrystallisation
During recrystallisation, new almost defect free nuclei form and grow in the deformed microstructures. The driving force for recrystallisation arises from the excess dislocation density and other defects that are generated by the deformation process and stored in the deformed material. 3 3,52 The (heavy) subdivision by dislocations organised in IDBs and GNBs within the original grains occurring during the deformation process is thus of (utmost) importance for the understanding of recrystallisation. Now, it is clear that the nuclei do not form and grow in a relatively homogeneous microstructure of cells surrounded by low angle boundaries but in a very heterogeneous microstructure that varies significantly on a length scale comparable to the nucleus/grain size. As an example, the migration conditions for various segments of a recrystallising boundary surrounding a given recrystallisation grain will thus constantly change in time and space as the grain grows.53
Another paradigm shift of high importance for the understanding of recrystallisation relates to the development of the EBSD technique, which has undergone fast development during the last 15 years.54 Whereas this technique has certain limitations for detailed characterisation of deformation microstructures,55 its angular and spatial resolution matches perfectly to recrystallisation studies, and it is easy to use. Today, it is therefore the most widely used experimental tool for these types of investigations, and in the latest printed proceedings of the Recrystallisation and Grain Growth conference series,56 ∼85 of the experimental papers contain EBSD results.
The real advantage of using EBSD is that the microstructure is characterised by the spatial distribution of crystallographic orientations, i.e. the orientation is known in each measured pixel within the microstructure. Before the development of the EBSD (and related) techniques, the microstructure and orientations were not directly correlated. Instead, most studies encompassed two ‘fields’: texture and microstructure, where the texture was measured mostly by X-rays and gave the preferred orientations averaged over a large sample surface. The separation into the two fields led to problems explaining why certain textures evolve. A classic example is the cube recrystallisation texture in fcc metals of medium to high stacking fault energy; here, the mechanisms of oriented nucleation versus oriented growth were vigorously debated.57–60 With EBSD, it is relatively straightforward to measure the average growth rate of grains with different orientations and thus test the oriented growth hypothesis.61 This is achieved by measuring Vv(i), i.e. the volume fraction of recrystallised material of given orientations i (e.g. cube, rolling and random), and Sv(i), i.e. the total unimpinged grain boundary area of the nuclei/grains of orientation i per unit sample volume (i.e. the interfacial area between recrystallised material of orientation i and the deformed matrix), in a series of partly recrystallised samples annealed for different times t. Following Cahn and Hagel,62 the average growth rate v(i) is determined from these parameters

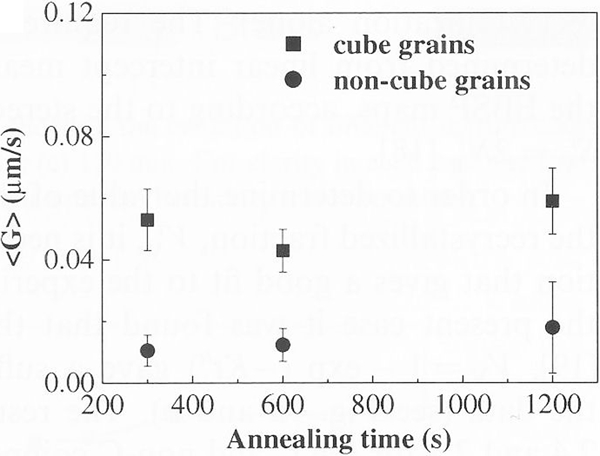
Average growth rates for cube and non-cube grains during recrystallisation of high purity nickel (99·999) cold rolled 98 and annealed at 300°C in nitrogen atmosphere: data that are determined by extended Cahn–Hagel method shows that growth rates remain constant during recrystallisation with cube grains growing ∼3 times as fast as non-cube grains64
When an orientation effect on growth is observed, explanations, therefore, are also needed, and it has for example for fcc materials commonly been related to a preferential 40° 〈111〉 misorientation between the rapidly growing grains and the deformed matrix. This explanation relates to the old elegant experiment by Beck and co-workers 66 66,67 and later by Lücke and co-workers, 68 68,69 showing that among nuclei of all orientations in weakly deformed single crystals, those with the 40° 〈111〉 misorientation relationship grow to become the biggest grains. For this mechanism to dominate in the more typical heavily deformed polycrystalline fcc materials, where a nucleus/grain is surrounded by several/many different orientations that change as the nuclei/grain grows, it requires a statistical preference for CBs in the deformed microstructure having this misorientation relationship to the cube orientation. This mechanism for an explanation of preferential cube growth has been suggested 70 70,71 and is often referred to as a ‘compromise orientation’ mechanism. The EBSD is also very well suited to test such hypotheses as the EBSD data contain all the necessary misorientation data. As an example, misorientations between the deformed matrix and the fast growing cube as well as the slower growing grains of random or rolling textural orientations were measured by EBSD in cold rolled aluminium.53 Here, no preference for 40°〈111〉 cube/matrix misorientations was observed. Instead, it was observed that the rapidly growing cube grains are surrounded by a significantly lower fraction of low angle boundary segments than the other grains. This led to the suggestion of the orientation pinning mechanism, 53 53,63 which is illustrated in Fig. 11. For a recent investigation of orientation pinning, see Ref. 72.
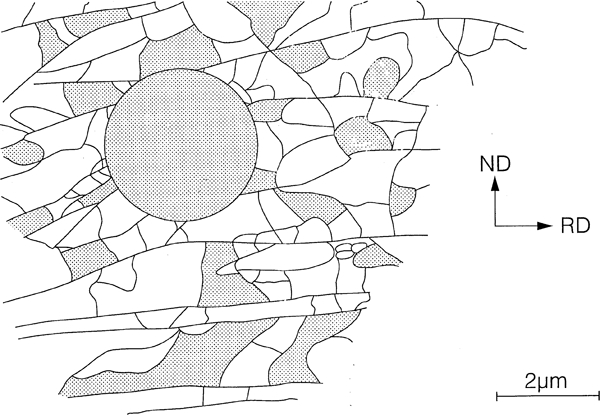
Schematic illustration of orientation pinning: imaginary nucleus is shown in typical deformed microstructure (when nucleus grows into areas of nearly its own orientation, as those shown in grey, motion of corresponding boundary segment will be retarded by orientation pinning)53
Whereas the above results relate to growth during recrystallisation, the EBSD technique and the understanding of the subdivided deformation structures have also been very important for studies of nucleation. It is for example clear that nucleation sites and orientations are closely related to the deformed structure. In addition, it has been suggested that nucleation is not a ‘real’ nucleation process but merely some abnormal growth of certain elements in the deformed structure augmented by the presence of many deformation induced high angle boundaries.73 This would, of course, mean that the nuclei have orientations that are already present in the deformed state. This is indeed true in many cases. For example, the nucleation studies of Humphreys and co-workers during the past 25 years have mostly been focused on the effects of large second phase particles. 74 74,75 They have documented that particle stimulated nucleation (PSN)76 is a dominating nucleation mechanism in materials with large second phase particles.74 In addition, by EBSD and related techniques, it has been shown that the nuclei formed by PSN have random or spread rolling texture orientations, 77 77,78 i.e. orientations that are present at nucleation sites within the deformation zone, which is developing around large particles during deformation. The nuclei forming with orientations present at the nucleation sites in the deformed state are actually the most common assumption, and besides PSN, it is also applied for nucleation by strain induced boundary migration.66 However, recent research reports on the formation of nuclei with new orientations that are not seen in the deformed microstructure. These results are based on 2D characterisations (mostly by EBSD), but they have seen supported by 3D experiments.79–83
Within the past ∼10 years, the general limitations of the 2D experimental methods have motivated characterisation in 3D (x, y, z)84 and four-dimensional (4D) (x, y, z, t).85 Very popular among the 3D methods is focused ion beam sectioning combined with EBSD,86 which is now an almost standard technique in many laboratories. The 4D methods are less mature and experimentally more complicated.87–89 For recrystallisation, 4D measurements by high energy 3D X-ray diffraction microscopy have, however, already shown the following:
each nucleus/grain has its own recrystallisation kinetics89
the boundary migration during recrystallisation is complex, with boundary segments moving forward for a while, then stopping, moving again, etc. (a stop–go motion), and often with large protrusions and retrusions forming locally on the migrating boundary (see Fig. 12) 91 90,91
nuclei with new orientations form.79
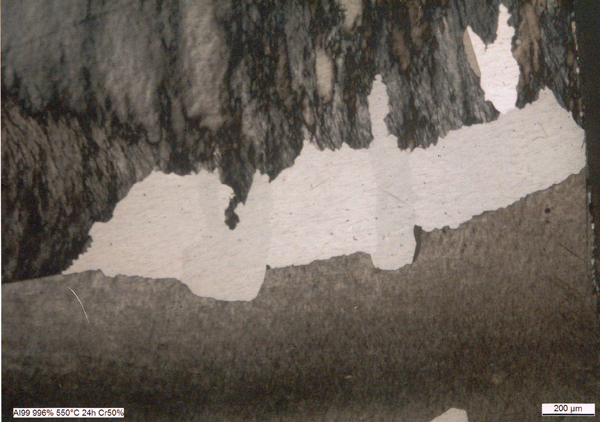
Partly recrystallised microstructure of pure Al (99·996) cold rolled 50 (RD-TD plane): large protrusions and retrusions are seen on boundaries surrounding recrystallising grains92
The recrystallisation results summarised above refer to metals deformed to medium and high strains (up to strains of ϵ = 2–2·5). Higher strains giving extra driving force, for example for aluminium, lead to significant recovery effects that significantly affect the subsequent recrystallisation. 93 92,93 Experimentally, the higher strains provide an extra challenge because of the higher spatial resolution needed. Therefore, often, TEM is the best choice of microscopical technique as 4D techniques, for example 3D X-ray diffraction microscopy, have to be further developed in order to be applicable.
All the new observations in 2D as well as in 3D and 4D also require new modelling, which can correctly predict and/or incorporate the new phenomena observed. This is facilitated by the constant increase in computer power. Though process models have been put forward,94 MD can visualise local grain boundary phenomena,95 and textural models now consider ensembles of grains.96 Concerning the new experimental results referred to here, microstructural path modelling has been extended to incorporate oriented growth and clustered nucleation,52 and the local protrusion and retrusions on the migrating boundaries are modelled by MD, 98 97,98 mesoscale modelling99 and phase field simulations. 101 100,101
Future recrystallisation studies may encompass more advanced experiments and simulations. A dream experiment may be to follow in situ the whole transition from the deformed microstructure to complete recrystallisation in 4D. This will not be easy, and experiments with the best choice of sample(s) are necessary, but such experiments are considered to be essential for modelling nucleation and recrystallisation. A combination of many 2D measurements with a few selected 3D/4D characterisations may often be a good choice to ensure statistically solid representative data and at the same time avoid serious mistakes/neglections because of the lack of information in the third and fourth dimension.
Strength–structure relationships
For the past 50–60 years, there has been focus on the relationship between the deformation structure and the mechanical properties, such as strain hardening and flow stress–structure relationship, including anisotropy.102–104 The key structural parameters have been the dislocation density ρ and the dislocation cell size d, where the flow stress has been taken to be proportional to ρ0·5 and d−1 respectively. However, the evolution of a CB structure from low to high strain has introduced supplementary strengthening parameters, which are the spacing D between and the misorientation angle θ across the IDBs and GNBs, which both can resist dislocation glide. For low to medium strain, where the majority of boundaries are dislocation boundaries, the dislocation density ρ is proportional to θ/D, and by expressing the flow stress as proportional to ρ1/2, a good strength–structural relationship (stage III hardening) has been observed for single crystals and polycrystals. 1 1,104 The relationship between the crystallographic orientation of a grain and its deformation microstructures has also made it possible to estimate the flow stress of individual grains embedded in a polycrystalline sample, and it has been shown that the flow stress is comparable to that of single crystals of similar orientations.105 This correspondence allows, with good accuracy, the polycrystalline stress–strain relationship to be calculated based on single crystal data, which are weighted based on a quantitative textural analysis of the polycrystal (Fig. 13).
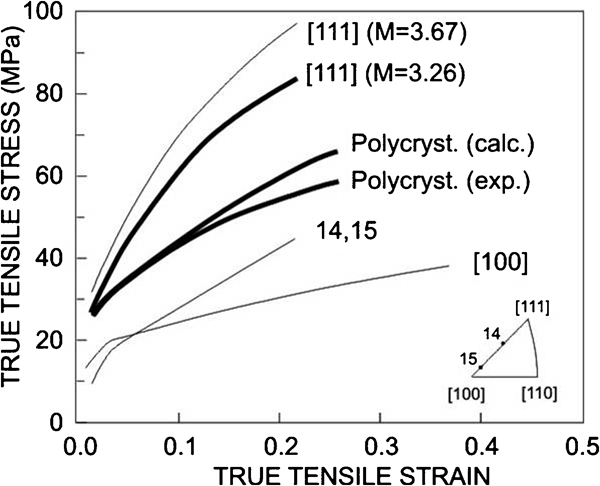
Comparison between experimental and calculated stress–strain curves for polycrystalline aluminium (99·99 purity)105
Considering the strength–structure relationship of medium to high strain (stage IV hardening), it has to be taken into account that the misorientation angles of both GNBs and IDBs increase with strain (Fig. 3). The rapid increase in the GNB angle transforms many GNBs into medium and high angle boundaries, which may change the boundary resistance to dislocation glide from being penetrable to impenetrable. This structural evolution has led to the suggestion that the strength contributions from IDBs and GNBs are analysed separately and that the contributions are superimposed to obtain the total flow stress.106 The strength contribution of the IDB is calculated based on their dislocation density, and the strength contribution of the GNBs is calculated on the assumption that it can be expressed by a Hall–Petch equation. This approach has been used for aluminium, 31 31,107 nickel32 and interstitial free108 steel cold rolled up to very large strains, and good agreement has been found for both flow stress values and hardening rates when comparing observed and calculated stress–strain curves, as illustrated in Fig. 14 for cold rolled nickel. These results point toward a better understanding of the workhardening behaviour at large strains, where linear hardening toward saturation is a typical observation. The modelling of this behaviour must be based on real high strain structures containing a large fraction of both low angle dislocation boundaries and high angle boundaries and in many cases being parallel lamellae or fibrous, i.e. structures that are very different from the 3D cell structure, which characterises the low and medium strain range.
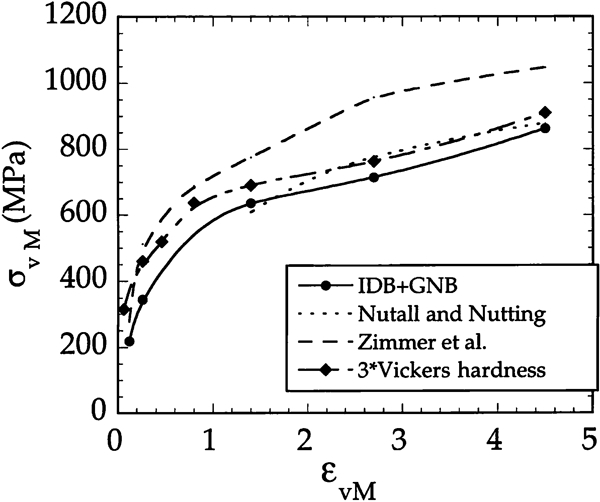
Flow stress calculations for cold rolled nickel (99·99 purity) compared with Vickers hardness data and literature data34
The strength–structural relationships discussed above cover deformed samples with a microstructure that has been refined to boundary spacings as low as 100–200 nm. A further refinement can be obtained by deforming under extreme conditions, e.g. to ultrahigh strains (see Fig. 8) at high strain rates or at low temperature. As an alternative, fine structures have been obtained by bottom-up processes, for example magnetron sputtering and electrodeposition. It has thereby been possible to reduce the boundary spacing to about 5–10 nm. As to the strength–structure relationship, it is observed that the flow stress increases with increasing fineness of the microstructure, and that this stress to a good approximation is inversely proportional to the square root of the boundary spacing encompassing both low and high angle boundaries.106 However, this favourable increase in strength is counterbalanced by a loss of ductility, a problem which has been addressed in numerous experiments but is still an important challenge.
The extrapolation of dislocation and boundary strengthening to ultrafine structures is a problem still under investigation. For dislocation strengthening, an alternative to forest hardening is bowing out of threading dislocations in a confined volume,109 and for boundary strengthening, an alternative may be yielding by grain boundary sliding.110 The latter process may lead to softening when the grain size is reduced below a certain limit, and MD simulations have indicated that such a transition may take place when the grain size decreases to values below about 10–20 nm. However, such a theoretical prediction is difficult to verify as both synthesis and testing are difficult for such fine structured samples. Recent research has also revealed new and alternative mechanisms in nanostructured samples, for example that highly strained materials may harden by annealing and soften when afterwards deformed,111 and that extremely fine twin structures may show increased strength with decreasing twin spacing to a limit of ∼15 nm, below which the strength decreases with decreasing twin thickness.112 In the general analysis of strength–structure relationships, it is important that also the crystallographic texture is taken into account as it affects the flow stress and is an important source of anisotropy. Owing to its practical application, research in this area has been extensive, covering both experiments: modelling and simulations. In addition to the present work, the anisotropy caused by the strong structural directionality of extended dislocation boundaries (GNBs) has been explored experimentally and theoretically, and it has been shown that a combination of crystallographic and microstructural anisotropy can be accounted for due to the coupling between the textures (i.e. grain orientation) and the GNB alignment both having their cause in the actual slip pattern.113–117
Conclusions
The advancements in the past 25 years in materials science and engineering have been based on remarkable paradigm shifts that have led to new ways in which metals and alloys are processed, characterised and modelled. Metals with fine and ultrafine structures can now be synthesised, and they can be characterised by advanced techniques in 2D and 3D and also in situ. In parallel, modelling and simulation techniques have advanced significantly and can now cover several length scales reaching towards the possibility of coupling models over several length scales. There is no sign that this development will not continue with an undiminished rate, especially because of the scientific interest and societal need for advanced and new metals in order to save energy and raw materials. In the areas discussed in the present paper, new knowledge and advanced characterisation techniques are expected, which will lead to an advancement of present days’ metallic materials and hopefully also to new materials with unprecedented combinations of strength, formability and weight. In this endeavour, a concerted effort must combine activities in the areas of science, engineering and technology.
Footnotes
Acknowledgements
The authors gratefully acknowledge support from the Danish National Research Foundation and the National Science Foundation of China (grant no. 50911130230) for the Danish–Chinese Center for Nanometals, within which the present work was performed. The authors also thank K. Fugleberg, B. Ralph and Y. B. Zhang for their assistance with the manuscript.