
Abstract
Conduction laser welding involves initiating a melt pool by exposure to high power laser induced light and controlled thermal conduction. Existing welding techniques generally provide enough energy to join the component but have no real control over the melt pool. This process can invariably lead to overheating in adjacent areas or even the melt pool itself, often causing unavoidable effects, such as ‘burn through’. The present work presents a procedure in which a desired melt pool shape is conceived, and a bespoke beam irradiance distribution is designed to match. The beam is shaped not by conventional lenses but by a diffractive holographic optical element (DHOE). The DHOE utilises holography to wholly create highly complex three-dimensional energy distributions through constructive and destructive interference. This technique allows novel beam irradiance distributions to be applied to conduction mode laser welding, with the melt pool transverse profile being shaped to a specific design. Holographic conduction laser welding has been shown to be successful and represents a significant step forward in the industry, as demonstrated in this case in both mild and stainless steels. The fusion zone is shown to be particularly influenced by the shape of the illuminating laser beam profile, and many of the welds demonstrate a highly novel weld profile because of this. The use of a bespoke beam irradiance distribution allows control of the heat flow to the workpiece, and this allows greater control over material migration due to surface tension effects. Many of the welds demonstrate unique surface solidification patterns directly linked to the beam profile used. The DHOE also presents a number of additional advantages, such as an increased usable depth of field, allowing for less stringent set-up tolerances. Comprehensive metallography has been performed on samples of these welds through the use of optical microscopy, electron microscopy, electron backscatter diffraction and energy dispersive (X-ray) spectroscopy. These techniques offer in depth analysis of crystal size, shape, orientation and phase. By incorporating DHOEs into a laser welding process, not only does the melt pool shape become controllable, but also the crystal growth is highly influenced. Many of the undesirable attributes of a conventional laser weld are reduced by using a beam distribution created by a DHOE, bringing the microstructure of the weld pool closer to that of the parent material.
Introduction
The earliest example of conduction limited laser welding for practical use concerns the joining of thermocouples to sample containers for the Apollo lunar landing missions in the 1970s, which utilised a ruby laser.1 There are other examples2–4 of conduction laser welding in manufacturing, but this method of laser welding did not really take off until it was embraced by the automotive industry. The general attributes of a laser beam weld are that the relative heat input is low compared to other welding processes, and therefore, the cooling rate is higher.5 Welding with high power CO2 lasers has been examined for well over 30 years.6–8 Alwang et al.9 performed continuous butt welds with stainless steels and also showed the similarities with electron beam welding but with some advantages, most notably the ability to weld without the presence of a vacuum and also the maintaining of similar mechanical properties to the substrate metal. Penetration depths have been shown to be mathematically predictable,10 confirming the stability of the process in general. Welding with lasers has made a definite impact on the manufacturing industry with many companies now providing fully PC controlled systems to specification. The laser is also finding novel welding uses in fields that are otherwise not immediately obvious. For example, tears in the human dural membrane have been successfully repaired using a method of laser welding.11 The results were compared to existing techniques and found to be very favourable. A similar study has been completed using a human tongue as the workpiece.12 Repairing of incisions in a tongue by conventional means was compared with welding with a CO2 laser. The laser method was found to exceed the conventional method and offered increased healing times, due to the lack of contact with foreign bodies. This proves that the conduction laser welding process is extremely far reaching, but it also underlines the generally accepted view that using the default output beam profile (generally a Gaussian distribution, TEM00) is adequate. It is thought by the present authors that if the user was able to design a beam distribution to achieve the desired goal, then the weld could be completed with less total energy used, a reduced heat affected zone (HAZ) and with greater control over the resultant microstructure achieved by directing more heat to specified areas.
Diffractive holographic optical elements (DHOEs) are computer generated holographic devices that can transform an illuminating laser beam into a specified intensity distribution. Holography is used to record images by collecting not only the intensity of light reflected from an illuminated point but also the phase. This additional information allows the creation of a diffraction pattern, which is used to form a three-dimensional (3D) image of the illuminated object. Holograms have found extensive use as security features or quality marks, particularly on credit cards, although the recent inclusion of ‘chip and pin’ may well supersede them. This research utilises 3D holography to create a bespoke 3D beam intensity distribution by using reflective, diffractive optical elements. The DHOEs can be designed to generate laser beam shapes that cannot be achieved using conventional lenses and mirrors. By the use of DHOEs, the laser processing tool is no longer limited to a small focused energy spot, and the beam can be transformed into previously unattainable novel shapes. As the name suggests, DHOEs operate by diffraction rather than refraction or reflection. The diffractive surface of the beam shaping mirror is split into an array of cells, each of which is designed to transform the phase of the coherent illuminating beam by a specified amount. In a reflective element, the required phase change at each cell is achieved by accurately producing a subwavelength variation in the depth of the surface. Upon reflection, each cell is considered to be emitting a spherical wavefront with a specified phase retardation. These diffracted wavefronts interfere in the reconstruction plane to produce the required intensity profile. Figure 1 illustrates the nature in which the desired energy distribution is produced using holographic diffractive elements. Much research has been carried out on this topic, 13 13,14 and a brief overview of the operation of DHOEs has been given. The DHOEs are a particular type of computer generated hologram known as a kinoform. The kinoform is a phase only element and imposes phase changes on the illuminating beam (phase changes in the range of 0–2π). The kinoforms are highly efficient reflective devices (compared to other types of holograms) and should only generate a single diffraction order, with efficiencies of >90. The kinoform consists of a two-dimensional array of pixels each assigned a different phase level. Each pixel can be thought of as a point source of a spherical wavefront, emitting with a controlled phase retardation. These wavefronts combine in the focal plane to generate the required image. The DHOE surface arrays are calculated using the error reduction iterative Fourier transform algorithm (20 iterations) using the measured profile of the illuminating beam. The DHOEs are specified with 192 phase levels.
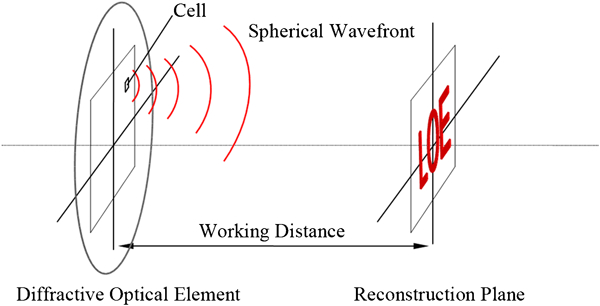
Individual cell emitting spherical wavefront to form part of desired beam distribution at reconstruction plane14
From a manufacturing viewpoint, DHOEs have the following advantages:
they have a large focal field depth compared to conventional lenses (this makes working distance less critical)
they require no maintenance if protected from fume and dust and are temperature controlled when in use (i.e. water cooled)
they allow the beam shape to be optimised for the process being undertaken and the material used.
Previous work has been carried out using Gaussian beams and conventional lenses to produce alternative shapes. These include square beams produced using complex and expensive lens arrays or using a series of beam stops or masks.15 Farooq and Kar16 experimented with a resonator to produce a more uniform irradiance distribution. In practice, the actual distribution created was equivalent to four spikes at the corners, which produced a near rectangular beam print. This irradiance distribution was applied to steel, and differences were noted in the melt pool geometry. The melt pool had a slightly flatter floor when viewed from the transverse direction and compared to a Gaussian beam. Bianco et al.17 and Konig and Kirner18 experimented with rectangular beams for laser cladding. The beams were shaped either by kaleidoscope optics or by faceted mirrors. This produced a more uniform intensity profile, which slightly improved the resulting clad layer. Schnieder19 experimented with many different beam shapes during laser cladding trials and led to the creation of a two-dimensional line integrator to be used for laser cladding. This effectively produced a scanning line across the clad profile, but the authors’ laser (1·8 kW CO2) produced insufficient power for effective substrate melting, so cladding was unsuccessful. Parabolic mirrors can also be used as beam directors, as described by Ito et al.,20 in conjunction with a 10 kW laser.
In an ideal world, one would be able to physically join two pieces of metal and create one piece of metal. The finished ‘join’ would exhibit a uniform microstructure throughout the entire welded area, negating the need for post-weld treatments. Of course, this is not (yet) possible, although with the knowledge of heat treatments available, this is nearly achievable with the correct post-weld attention. Eastersling21 presents factors influencing the possible microstructures present in the fusion zone. The work included the welding process (i.e. determining the weld pool size and shape) and the final composition of the melt. In addition, the speed of welding was considered, since the solidification affects the crystal morphology and segregation. The thermal cycle of the weld also has an effect,22 particularly on the microstructural coarseness of the fusion zone and also of the potential phase changes seen. The rate at which solidification occurs is also different across the weld pool. The high solidification rates associated with laser welding induce some interesting microstructures in the fusion and HAZs. Often, welding induces a coarse grain structure far removed from the substrate microstructure. Clearly, the microstructures generated by the welding process deserve attention for they decide the physical properties of the weld. Mild steel weld metallurgy is well understood, 23 23,24 even considering the increased level of phases possibly present. Owing to the fast quench rates associated with laser beam welding and the low carbon content, it can be shown that the primary solidification phase in the fusion zone (i.e. the melt pool) would be ferrite. With regard to the HAZ, however, there are a number of potential phases to be considered through assessment of the iron carbon phase diagram and the potential cooling curve of the welding process. The HAZ is defined as the volume of material between the fusion zone and the unaffected substrate material; therefore, the HAZ experiences transformations due to the thermal cycle induced by the welding process. The extent of the HAZ depends on both the material and the welding process. The HAZ is usually made up of a number of subzones, including (starting from the fusion zone) a solid to liquid transition zone, a grain growth zone, a recrystallised zone, a partially transformed zone and a tempered zone, leading inevitably to the unaffected base material or substrate.21 Each of the subzones described exhibits a specific microstructure itself, but this also leads to the assumption that the mechanical properties could also be different to each other. The microstructure type and the subzone volume are mostly determined by the heating and cooling of the substrate material and also the thermal properties of the metal. The time held at temperature and the cooling rates have effects on the grain growth zone; furthermore, the recrystallisation zone is also dictated by the prewelded condition of the substrate with respect to the mechanical preparation, i.e. annealed, rolled, etc. David et al.25 have shown that rapid cooling has a profound effect on the weld microstructures of stainless steels, which makes predictions from conventional constitution diagrams unreliable for laser welding operations. David et al. also showed that the ferrite content upon solidification initially increases with traversing velocity and then significantly tails off with increasing velocity, leaving a primarily austenitic solidification structure. Elbatahgy26 suggested that the fusion shape and structure are largely independent of welding parameters, although finer solidification structures were seen when using a lower laser power or a higher welding speed.
Extensive work has been carried out to characterise the resultant microstructures from laser welding operations. Electron backscatter diffraction (EBSD) has been successfully used to assess the crystallographic features of different types of ferrite in low alloy steels by Gourgues et al.27 The present study underlined the power of this technique for the examination of fine steel microstructures (particularly acicular ferrite) in weld fusion zones. Wilson and Spanos28 also identified different phases in steels using EBSD but identified the advantages and limitations of using orientation imaging microscopy by correlating the EBSD patterns to specific phases, interphase and grain boundaries using pattern quality maps (image quality). These techniques were also modified for the quantitative identification of microconstituents. Bouche et al.29 have performed orientation analysis on welded joints of 316L stainless steel. The microstructure examined included an austenitic grain structure, including a residual skeletal ferrite structure due to the nature of the high quench rate of the welding process. The EBSD showed that the skeletal ferrite and the austenitic pole figures obtained for ferrite are very similar to each other and are therefore in a cube–cube misorientation relationship. The conclusions drawn from the EBSD data were confirmed by transmission electron microscopy. According to Bouche et al., both ferrite and austenite cubes nucleate and grow in parallel; then, upon cooling, plasticity occurred to accommodate the variation in the thermal expansion coefficients of each phase. This subsequent volume change is the reason for the misorientation between ferrite and austenite. A combination of EBSD and energy dispersive (X-ray) spectroscopy (EDS) has been used by Nowell and Wright30 in cooperation to effectively distinguish different phases in materials, and this technique has also been applied to a laser weld by the author.31 Further advances in this field include an online X-ray diffraction setup. 32 32,33 This enables an in situ visual analysis of the associated phase changes and austenite formation in the weld pool solidification of Fe–C–Al–Mn steel with 0·05 s resolutions. The results showed non-equilibrium austenite solidification during rapid cooling, in contrast to the equilibrium δ-ferrite solidification that occurs under slow cooling conditions. This technique has also been successfully used to observe the ferrite–austenite transformations in the HAZ of stainless steel spot welds.34 It clearly showed (using stepped EDS spectra) that because of the rapid cooling cycles, the transformations from ferrite to austenite are halted, leaving a higher portion of ferrite present in the substrate metal. From this short summary, it is clear that there are many assessment techniques available, incorporating a vast bank of microstructural knowledge to be drawn upon.
While it is clear that conduction laser welding is not a new process, it is suggested that to develop the process further, experimentation with alternative beam distributions is required. Owing to the wide range of potential applications, it would be greatly beneficial to be able to design a theoretical fusion zone for a particular join and be able to apply a beam distribution that will produce it through holographic beam shaping. This would be seen as a step change in laser welding technology, using the laser as a tool in its own right instead of a mere heat source, and may also allow additional microstructural control. The small collection of references regarding weld characterisation gives an indication to the wealth of techniques available; these are fully utilised to demonstrate the differences that are attributed to laser welding using alternative beam distributions.
Experimental
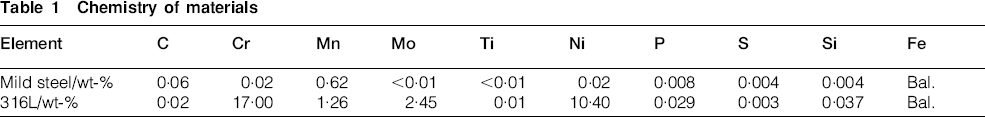
Autogenous laser welding was carried out on 1 mm plate of mild steel (automotive grade) and 1 mm 316L stainless steel plate with the compositions shown in Table 1. The chemical composition data have been tested by a UK Accreditation Service accredited company.35
Chemistry of materials
The laser used was a 1 kW CO2 Coherent Everlase S48, and the workpiece was clamped and attached to a computer numerically controlled table driven by an Aerotech Unidex 12 unit at velocities of 1–6 m min−1 at increments of 1 mm min−1. The substrate translation path was created in a Licom Systems Advanced Laser (CAD/CAM package). These path data were uploaded to the laser control unit via an RS232 connection. The way in which the DHOE was positioned is shown in Fig. 2. To prolong the working life of the DHOE, the mirror mount must be water cooled. All the DHOEs used in the following experiments were designed for a focal plane of 460 mm from the workpiece to the DHOE. When using a Gaussian laser beam irradiance distribution, a standard coaxial lens arrangement is used. The zinc selenide (ZnSe) lens had a diameter of 29 mm and a focal length of 63·5 mm. The energy density was calculated using the following formula

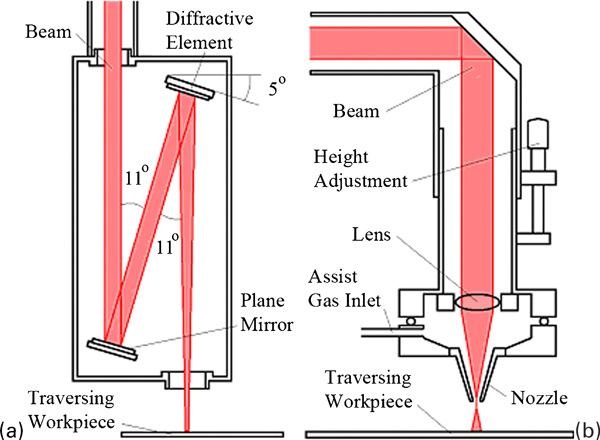
Beam delivery by a diffractive optical element (DOE) and b conventional lenses to produce Gaussian beam irradiance distribution
An equivalent beam diameter was calculated for the DHOE beam distributions from the area of the beam footprint.
The welded sample was cut in the transverse section and mounted in bakelite. The samples were ground using various grinding wheels of grades from 80 to 2400 grit. The samples were polished using a 6 μm followed by a 1 μm diamond suspension disc. The mild steel mounted samples were chemically etched using 2 nital for ∼20 s. The stainless steel mounted samples were chemically etched using Kallings reagent (distilled water, 40 mL; copper chloride, 2 g; hydrochloric acid, 40 mL; ethanol (80), 40–80 mL) for ∼4 s. The microstructures were imaged using bright field optical microscopy for the microstructure and polarised light to reveal the macrostructure using a Reichert-Jung MeF3. The microscope has a Fujifilm ‘Fujix HC300Z’ digital camera fitted, allowing image capture using Adobe Photoshop 7 via a TWAIN32 connection. An objective micrometre, manufactured by Olympus, with 0·01 mm graduations was used to provide a micrometre marker for the images. For EBSD, a final polishing stage on colloidal silica was carried on the samples. The samples were attached to a 70° sample holder and examined in a LEO 1530VP field emission gun scanning electron microscope. The microscope is equipped with a TSL-EBSD system, which allows simultaneous EDS data to be collected, and OIM analysis package for post-processing of the data.
Results and discussion
Laser beam design and testing
The vast majority of current laser welding processes utilise a Gaussian irradiance distribution [Fig. 3i(a)]. In order to have a direct comparison to DHOE welds, a representative conventional laser weld has to be reproduced. The dimensions of this beam distribution are 1·25 mm between the 1/e2 points (the area outside of these points is generally considered negligible). This size was chosen since it immediately induces melting in the power windows investigated but will not fully penetrate (i.e. ‘burn through’) until the traverse velocity is sufficiently low. The ZnSe lens used had a focal length of 63·5 mm and Φ29 mm. The focus point was set at 1 mm below the nozzle exit, and in order to create a larger beam spot, the workpiece dropped by 12·5 mm. A 1·25×1·25 mm uniform irradiance distribution was the first DHOE to provide a bespoke beam shape for laser welding with DHOEs [Fig. 3i(b)]. The irradiance distribution is described henceforth as a pedestal irradiance distribution (PID) as it has a flat top. This distribution was used as a start point in the DHOE investigation since it is an uncomplicated shape but should also produce a weld similar in width and penetration to the Gaussian distribution.
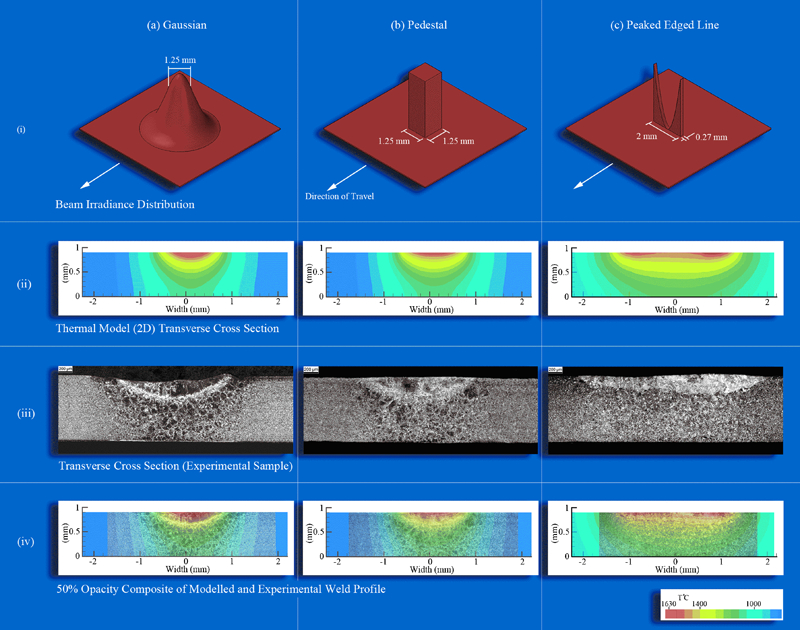
Steps taken to produce required beam distribution for specific weld shape. Pedestal beam distribution (created with DOE) was used as direct comparison to conventional Gaussian beam distribution. Modelled data were shown to be accurate enough to enable beam design from specified thermal model (in this case flat melt pool floor), giving rise to peaked edged line (PEL) beam distribution through reverse engineering and manufacturing new DOE to produce beam distribution
Following this point in the investigation, the beam distribution was designed after considering a specific weld profile. In this instance, a flat bottomed weld pool was chosen due to simplicity, and thermal models of the weld pool were used as a start point in the beam design process as follows. A 3D thermal prediction was constructed using a Tecplot 3·0 in conjunction with laser optical engineering.36 Figure 3ii(a–c) shows the theoretical transverse thermal contours for welds with an input energy density of 120 MJ m−2 for the Gaussian, DHOE PID and DHOE PEL irradiances respectively from a finite volume heat transfer model. The PEL profiles were determined from an inverse heat transfer model, allowing for a reverse engineered beam distribution directly from the 3D thermal model. This beam distribution consists of a 2 mm line (0·2 mm wide) with a peak at each end. An inverted parabola, which is near zero irradiance at the centre, joins the two peaks [Fig. 3i(c)].
The thermal model is based on Rosenthal's37 equations of heat transfer in a medium due to a moving source and estimates the laser profile required to provide a specified temperature field at a certain depth within a medium. Once a temperature field is specified, the model utilises an iterative biconjugate gradient method to solve for the required laser power. The estimated profile is then passed to the finite volume heat transfer model to enable a more accurate estimation of the temperature profile within the medium. This model takes into account variations in the thermal properties of the material but does not currently allow for the melt pool surface tension created by a thermal gradient. It does, however, predict different weld shapes as the process is changed from Gaussian to PID to PEL. The lower temperature contours in the pedestal prediction form a more shallow parabolic shape than the equivalent Gaussian beam prediction when overlaid for comparison. The PEL predictions clearly show a ‘dual’ laser input due to the nature of the beam shape and a horizontal floor to the melt pool, as required. Figure 3iii(a–c) shows low magnification micrographs of the welds produced with the three profiles in Fig. 3i(a–c) respectively. Of interest is the horizontal bottom on the weld produced using the PEL DHOE. This is the first evidence of a laser beam distribution having been designed for a specific controlled profile shape change.
Examples of weld top surfaces produced using the three beam distributions (using identical energy densities) can be seen in Fig. 4. A thin oxide layer has been physically removed for clarity. The figures clearly show that the top surfaces of both welds produced using a DHOE show significant improvements in reducing weld material migration, and the use of these novel beam distributions has a significant effect on the surface solidification lines, producing lines normal to the direction of travel due to the squarer nature of the melt pool. This contrasts the more accepted ‘stack of pennies’ curved solidification lines associated with elliptical (conventional) melt pools.
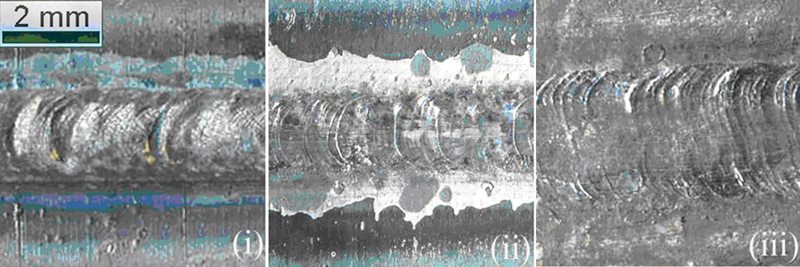
Plan view surface macrographs of welds produced using i Gaussian, ii pedestal and iii PEL beam irradiance distributions: thin layer of oxide has been removed for clarity
Figure 3iv(a–c) shows an overlay of the modelled transverse cross-sections onto the optical micrographs. All of these composite images show a relatively good fit between the model and the actual observed profile. The model does not take surface material migration into account, and this is observed in the weld produced using the Gaussian beam distribution. In all cases, the green areas seem to provide a good representation of the HAZ; the boundary between the fusion zone and the HAZ is shown as ∼1400°C. The boundary between the HAZ and the recrystallised zone is often very difficult to identify, although according to MTDATA predictions, this should occur at ∼900°C. However, models place this ∼0·1 mm from the actual boundary, most probably due to the rapid quench rates associated with laser conduction welding.
Experimentation has shown that the actual PEL beam irradiance distribution is slightly biased to one side, i.e. one of the peaks is slightly dominant, resulting in some non-symmetrical weld profiles. Although this may be due to a flaw in either manufacturing or calculation, it serves to show the effect the beam irradiance distribution has on the resultant transverse weld profile.
Weld microstructure refinement
Figure 5 is representative of the microstructures found in all the conduction laser welds produced in mild steel. Figure 5 shows the decreasing coarseness of the HAZ, and the thermal contour between the recrystallised zone and the unaffected substrate is also clearly visible. A thin band of ferrite between the fusion zone and the HAZ is also evident. The high solidification rate seen in conduction laser welding gives rise to the interspersed martensite in the fusion zone, which forms from the austenitic grains under rapid quenching. The HAZ, comprised in this case of martensite, is due to the rapid solidification of the austenitic microstructure. Martensite is also observed in the fusion zone due to the rapid quench rates associated with the laser welding process, i.e. rapidly cooled through the eutectoid point. Near the fusion zone, the microstructure is very coarse, and it gradually refines until the transition between it and the recrystallised region. Although the majority of the microstructure can be shown to be martensite, there are a number of additional phases also present. Indeed, much of the martensite may include regions of bainite. A continuous cooling transformation diagram can be produced to give an approximation of the microstructures present, and the Edison Welding Institute provides this information in a web based tool.38 Using the constituent alloying per cent weights for this steel (Table 1) and a theoretical cooling rate taken from De et al.39 (a continuous cooling transformation), a corresponding time temperature transformation plot was produced. This showed the transformation line passing the bainite level, before the martensitic region, suggesting the presence of bainite. The HAZ also exhibits small regions of other displacive transformation products generally expected in mild steel, such as allotriomorphic ferrite. This would be one of the first products to solidify at the crystal boundaries before the bainite/martensite transformation takes place. Widmanstätten ferrite is also found in limited quantities in this region.
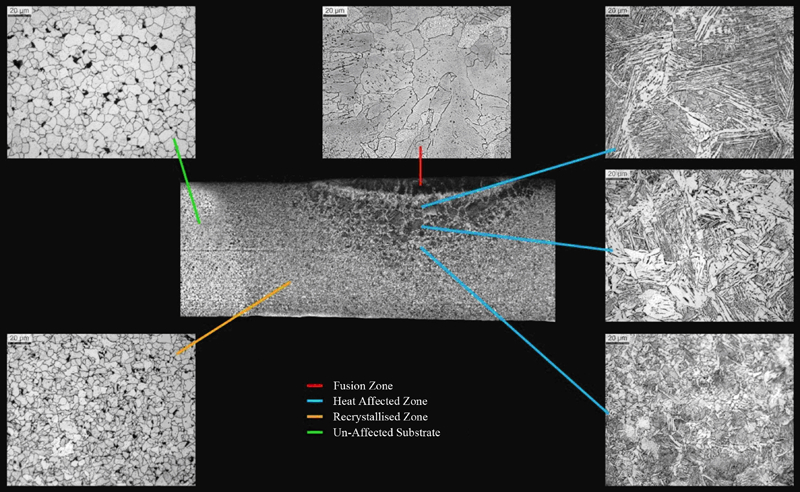
Collection of optical micrographs depicting different microstructures present in example weld produced in mild steel substrate (2 nital, 30 s)
Mild steel was used as a substrate not only due to the wealth of information relating to the possible generated microstructures, but also as a way of validating the thermal modelling data using the different microstructural phases as thermal contour markers. Physical data could then be fed into the weld thermal model to improve the accuracy. In order to maximise the microstructural investigation, EBSD and EDS were identified as useful tools. However, the phases present in the mild steel weld metal and substrate are virtually indistinguishable, and therefore, 316L stainless steel was used due to its commercial appeal, ease of sample preparation (for EBSD), weldability and predominantly single phase grain structure reported in various investigations. This alloy is the basis of many laser based studies 29 40 29,40,41 and is regarded as an alloy with good weldability. Stainless steel is inherently difficult to etch, and grain boundaries were often masked by more predominant features, such as the development of small δ ferrite regions and the products of the rolling stage in manufacture or indeed the welding process itself. The inclusion of ferrite in the weld material, however, provided a useful indication of the weld boundaries when viewed at low magnification.
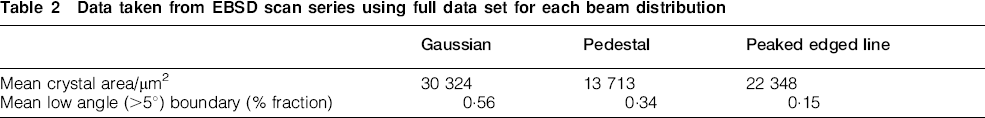
A succession of low magnification EBSD scans (×100 magnification) was produced on a series of welds on 316L stainless steel using the three beam distributions. Figure 6 shows inverse pole figure maps of the three weld profiles in Fig. 3. The inverse pole figure map gives an indication of the orientation of the individual grains colouring them to the inverse pole figure triangle shown in the key. Other maps can be produced of grain size distributions, misorientation angles (facing angles between neighbouring grains), phase maps, crystal growth direction, etc. At higher magnifications, the EDS is utilised simultaneously, which can be used as a further indicator of the phases present as well as allow full chemical mapping over an area of interest. Table 2 gives the mean grain area (μm2) and the low angle (>5°) boundary per cent fraction measured from each beam distribution using low magnification EBSD scans. This shows that using the pedestal beam distribution reduces the mean grain size most significantly, while welds produced using the PEL exhibit the greatest reduction in low angle boundaries of all the beam irradiance distributions used. The Gaussian beam distribution produces an elliptical melt pool and when moved across the substrate encourages crystals to grow from the outer fusion line towards the centreline (when viewed in a plan perspective). As the melt pool traverses across the substrate, it gradually pulls crystals in the same direction; this is the cause of the large mean grain size found in the welds produced with a Gaussian beam distribution. Since many of the crystals are growing in the direction of travel, there are also a high number of low angle boundaries. When using a beam distribution created using a DHOE (i.e. pedestal or PEL), a squarer melt pool is formed when viewed in a plan perspective. This allows a greater number of equiaxed grains to form in the central regions of the welds due to a steeper thermal quenching gradient. This reduces the number of low angle boundaries and also inhibits grain growth from the outer boundaries, reducing the mean grain area.
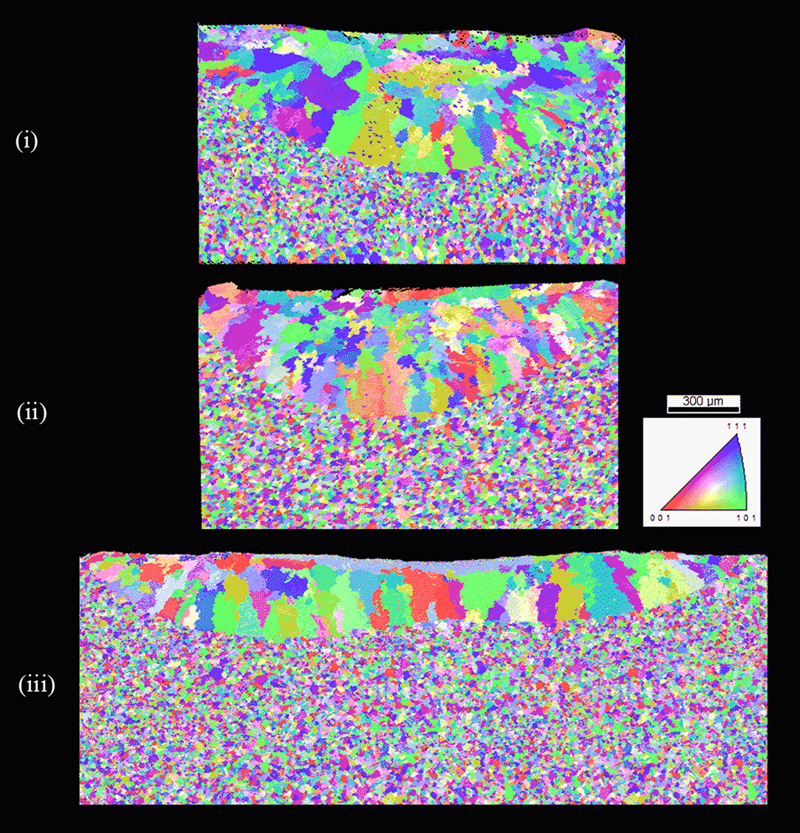
Example of EBSD technique: inverse pole figure mapping of weld produced using PEL beam distribution in transverse cross-section
Data taken from EBSD scan series using full data set for each beam distribution
Knowledge of the microstructures within the weld bead is important to understanding the material properties. Two distinctly different microstructures were seen in the 316L weld zone when observing at higher magnifications, and while these microstructures could be imaged by optical microscopy, they could not be satisfactorily characterised.40 Figure 7 is a micrograph depicting a boundary between the two microstructures. The bottom section shows a ‘cellular’ microstructure, whereas the top section shows what will be referred to as a ‘residual ferrite’ microstructure. The cellular microstructure was found to comprise of a fully austenitic matrix with small (∼Φ10 μm) intercrystalline cells. The microstructure was interesting as optically the cells appear to be individual grains, whereas using EBSD shows that they are all of the same orientation and are encompassed within larger grains (1500–5000 μm2).
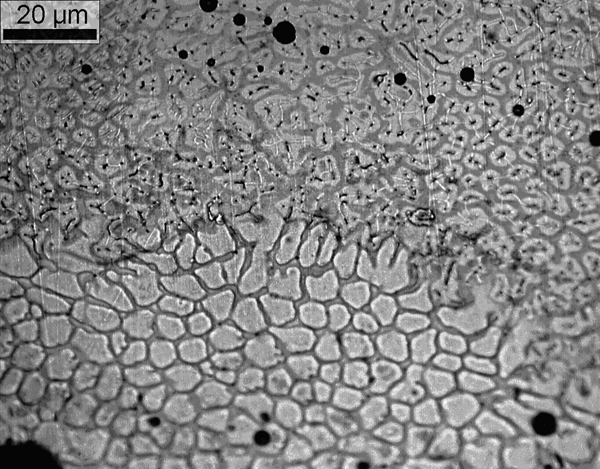
316L stainless steel weld microstructure. Cellular microstructure evident in bottom portion of micrograph; residual ferrite microstructure in top region. Etched using Kallings no. 2 (4 s)
Figure 8 shows high magnification EBSD and EDS maps of the cellular structure see in the 316L weld. The EDS spectra confirm that the cells form part of a larger microstructure of single orientations containing residual ferrite within the matrix. The microsegregation of major alloying elements in both microstructures is also clearly evident, and it should be noted here that the major constituent of stainless steel (iron) does not exhibit microsegregation in the residual microstructure.31
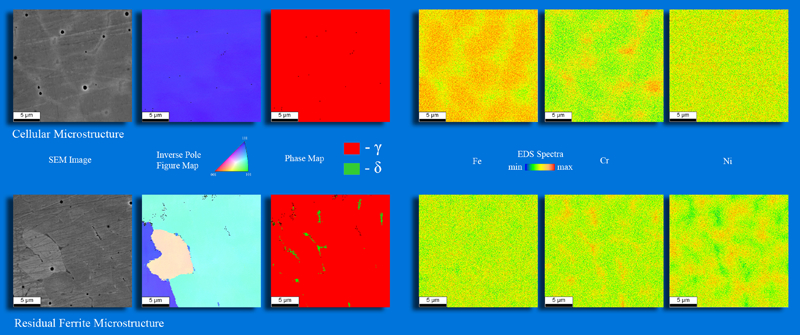
Maps (EBSD) and EDS spectra for cellular microstructure (top) and residual microstructure (bottom). Including inverse pole figure map and phase map taken from EBSD scan, along with corresponding SEM image of area. Spectra (EDS) are for (right to left) iron, chromium and nickel
The cellular microstructure is mostly found in welds produced using Gaussian beam distributions, and the volume levels are reduced by using any of the DHOE delivered beam distributions or by increasing the energy density of the Gaussian beam. The other microstructure found in the 316L weld zones was an austenitic matrix that included relatively high volumes of residual ferrite (δ) particles. This microstructure was much more common, i.e. found in all welds at all energy densities and beam distributions. The δ ferrite is retained in the solution since it is the first phase to form, and the cooling rate is high enough to preserve some ferrite in the final microstructure. Some levels of microsegregation are recorded in the residual ferrite microstructure; however, iron levels are homogeneous throughout.
It is clear that laser welding with alternative beam distributions has a marked effect on the resultant microstructure. Using a beam distribution shaped using a DHOE exposed two improvements in microstructural control; a reduction in the fusion zone mean crystal size and a reduction in the mean low angle boundary fraction. This suggests that laser welding with a DHOE beam distribution gives greater control of the microstructures with the possibility of the production of tailored weld microstructures by the correct design of the DHOEs.
Conclusions
Autogenous conduction laser welding has been successfully achieved using DHOEs. While conduction limited laser welding is not a new technique, combining it with DHOEs presents an entirely different approach to laser welding. Holographic welding has also been shown to be very repeatable in two different metals.
It is possible to produce a customised fusion zone or melt pool to a specific design. Once a beam distribution was conceived, a resultant thermal model was created. The modelled thermal contours align very well with those actually seen in the material. This enabled a melt pool to be envisaged and a beam distribution produced through reverse calculations. The beam distribution was delivered to the substrate DHOEs, and the predicted weld pool profile was produced successfully in the material. Having control over the melt pool allows the design of a beam distribution to produce a specific thermal distribution tailored to the process.
A combination of EBSD and EDS has been used to study the resulting microstructures found in the conduction laser welding of 316L stainless steel using conventional and holographic techniques. Owing to the microsegregation effects within the weld bead, resulting from the high cooling rates, optical microscopy techniques are not suitable for the study of the microstructures formed. The EBSD/EDS allows a more complete characterisation of the microstructures in terms of both chemistry and phases present. It was found that the structures seen optically were retained ferrite, quenched into the structure during cooling. Optically, this gives the illusion of a small grain size or structure, but in fact the grain size within the weld is much larger. It was observed that the fusion zone microstructure was closer to the substrate material in both mean crystal size and mean low angle boundary fraction (i.e. more equiaxed).
Using diffractive optical elements to produce a completely customised beam distribution gives the end user a totally unprecedented level of power over the process. This could lead to any number of imaginable uses with more complete control of the process, the metal microstructure and hence the final mechanical properties.