
Abstract
Indentation hardness measurements determined from continuous loading tests are compared on a hardness stress–strain basis previously developed to show the relationship of different test results. In such a manner, the elastic, plastic and cracking behaviours are described here for NaCl, oxidiser AP, MgO and explosive RDX crystals. The measurements cover a very large range of impression sizes spread over macro- to nano-scale test results. In addition, connection is made with compiled measurements of applied forces against residual indentation sizes and crack sizes for MgO, RDX and Si crystals also over a very large range of loads and deformations. Loading rate influences are shown for MgO crystal hardness and cracking behaviours, in the latter case relating to indentation fracture mechanics (FM) prediction. For internal structural relationship, first, slip system and dislocation pile-up influences are demonstrated for MgO crystal results. Exceptional subgrain boundary and grain boundary hardness measurements for Nb crystals and Nb and Mo polycrystals are then presented. Such results relate to a Hall–Petch type inverse square root of grain diameter dependencies of hardness shown for the following cases: (i) historical measurements on α-brass; (ii) wide ranging grain size coverage in polycrystal Cr, α-Ti and W materials; and (iii) particle size and binder mean free path dependencies for WC–Co polyphase composites. For the WC–Co system, there is connection with the contiguity parameter for WC to WC particle contacts and to the FM behaviour.
Keywords
List of symbols
ammonium perchlorate
measured contiguity of WC particle to particle contacts in WC–Co particulate composite system
effective contact diameter in ball indentation test
effective plastic contact diameter in ball indentation test
diameter of ball in ball indentation test
Young's modulus, Poisson's ratio of ball in ball indentation test
Young's modulus, Poisson's ratio of indented specimen
effective modulus in Hertzian based elastic loading behaviour expression
fracture mechanics
total penetration depth in ball indentation test
elastic penetration depth in ball indentation test
penetration depth on unloading in ball indentation test
total penetration depth in ball indentation test corrected for machine displacement
hardness of WC–Co particulate composite system
Hall–Petch specified hardness of Co binder phase in WC–Co particulate composite system
cyclotetramethylenetetranitramine [CH2.N.NO2]4
Hall–Petch specified hardness of WC particles in WC–Co particulate composite system
Hall–Petch
indentation FM
experimental constant in Hall–Petch hardness expression
FM stress intensity
plane strain FM stress intensity
indenter load
pentaerythritol tetranitrate [C.(CH2.O.NO2)4]
cyclotrimethylenetrinitramine [CH2.N.NO2]3
Hertzian indentation radius of curvature
volume fraction of WC particles in WC–Co composite system
Vickers (diamond pyramid) hardness number
crack surface energy
penetration depth correction for testing machine displacement
Introduction
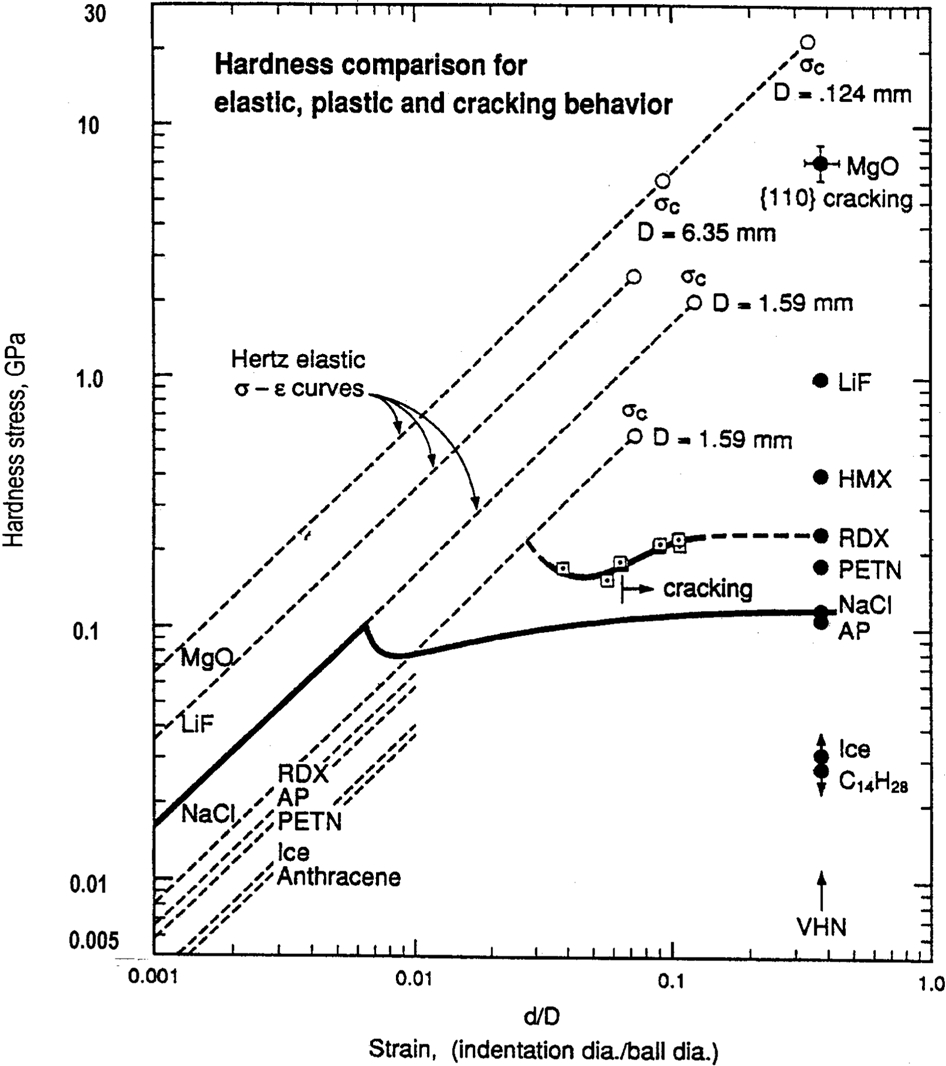
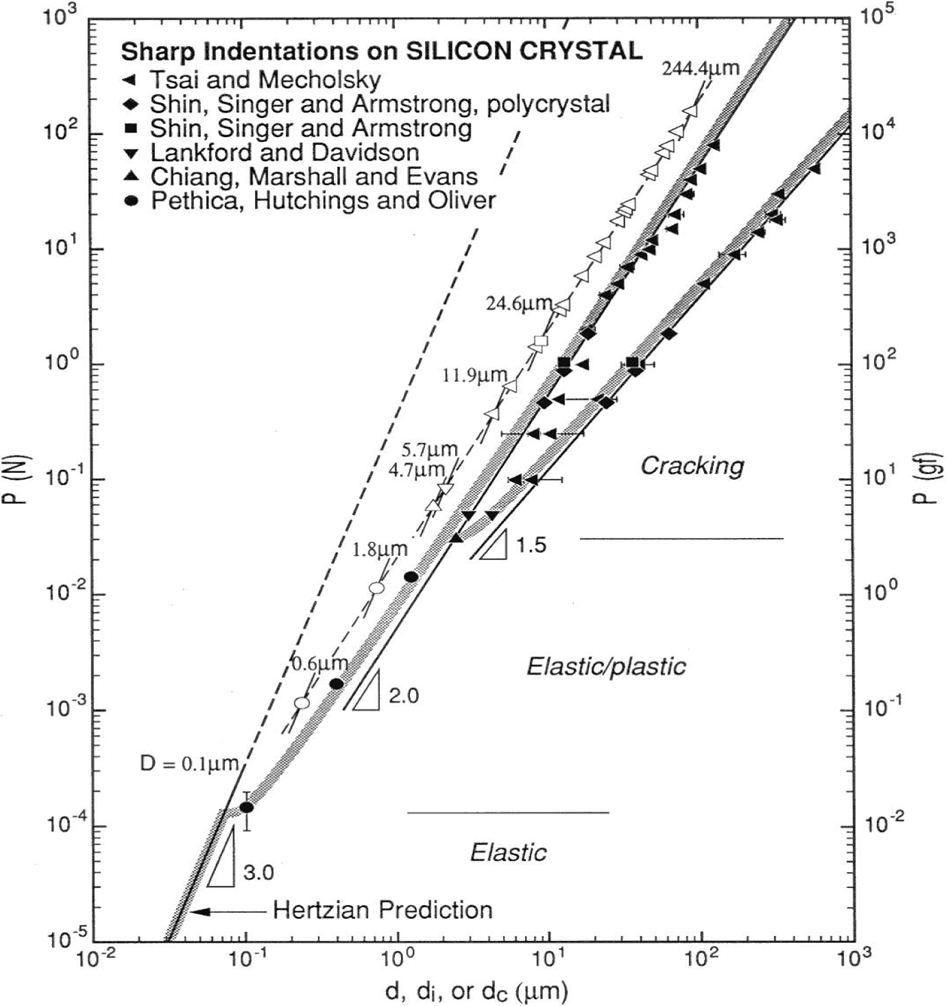
The full range of elastic and plastic deformation properties exhibited by crystal and polycrystal materials, even including their indentation forced cracking behaviours, is able to be monitored in measurements obtained with currently available hardness testing machines, especially including nanoindentation hardness testers. 1 Figure 1 shows on a log/log basis a compilation of single crystal hardness results obtained by means of either continuous loading or microhardness testing. The ordinate scale is expressed as the mean pressure of load P on contact area πd 2 /4, with d being an effective contact diameter for a ball indentation test, and the abscissa scale taken as an effective strain evaluated as d divided by the ball diameter D. For a (Vickers) diamond pyramid indentation, (d/D) = 0·375, thus providing in Fig. 1 the vertical distribution of Vickers hardness numbers from microhardness tests as shown for the listed materials: HMX is the designation for the energetic (explosive) cyclotetramethylenetetranitramine [CH2.N.NO2]4, RDX is the designation for cyclotrimethylenetrinitramine [CH2.N.NO2]3, PETN is pentaerythritol tetranitrate [C.(CH2.O.NO2)4] and AP is ammonium perchlorate [NH4.Cl4]. The indicated hardnesses of NaCl, LiF and MgO crystals may be compared with those values recently evaluated by Gilman 2 in terms of ionic bonding and crystal structure characteristics.
Hardness stress–strain graph 1
In Fig. 1, the left side solid line and other dashed lines slanting upwards to the right side of the figure are the linear Hertzian based predictions of elastic loading behaviour for a steel ball indenter applied to the listed crystals in accordance with the relationship
3


Hertzian elastic loading/unloading behaviour
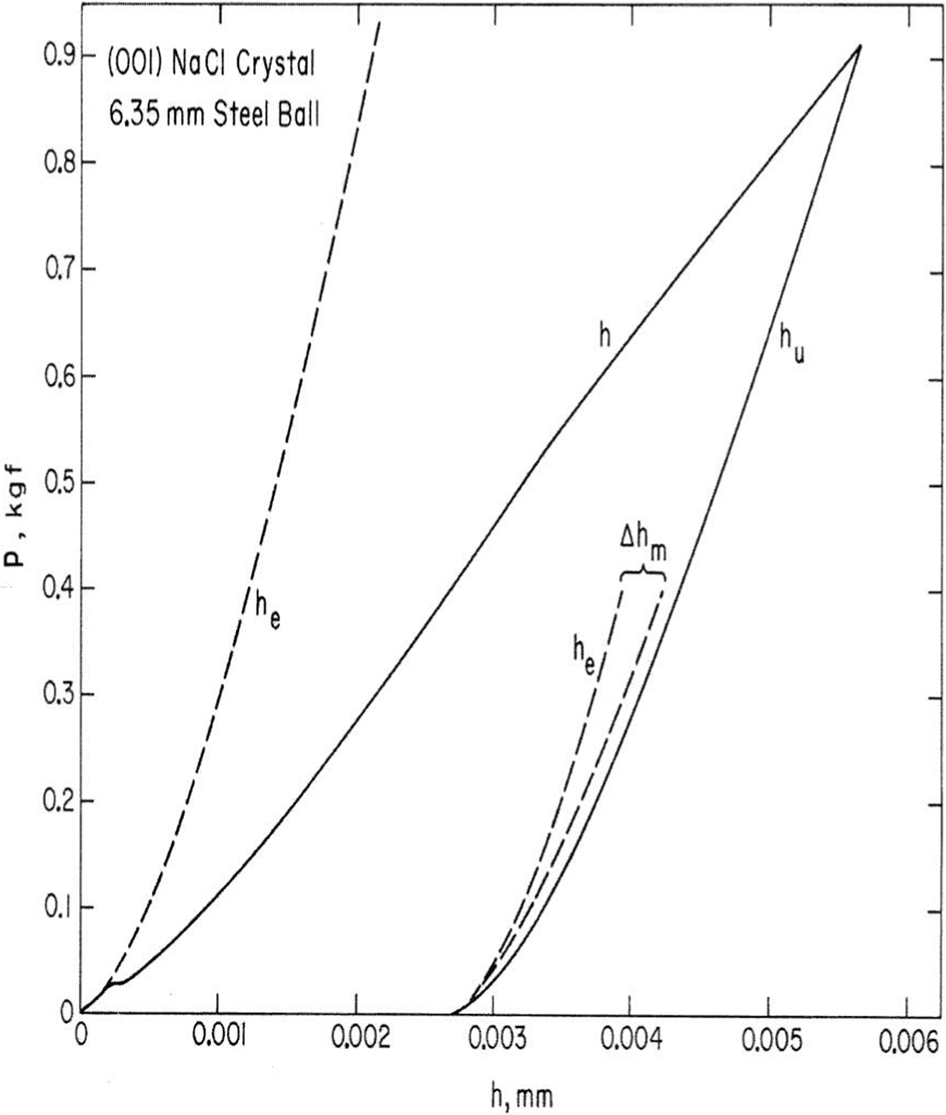
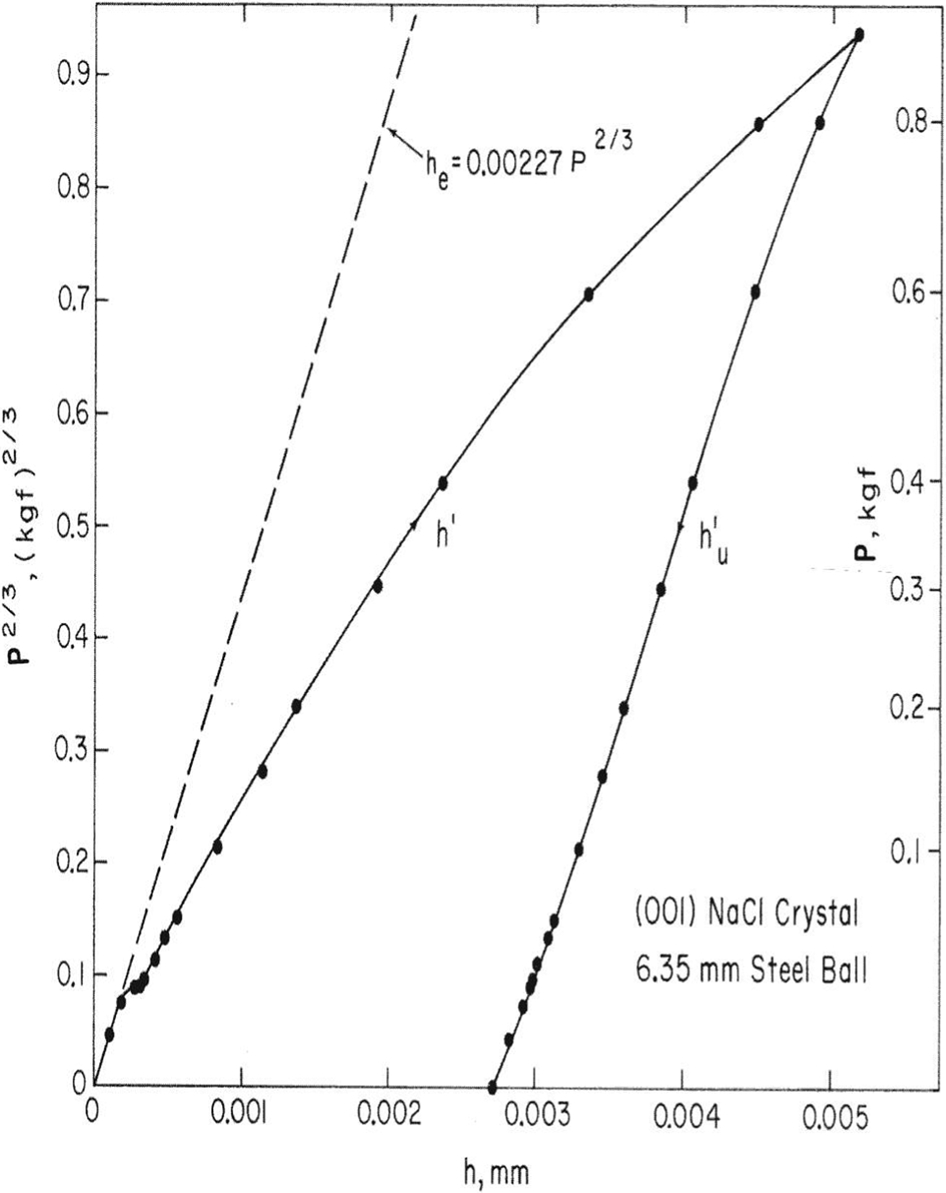
Figure 2 shows a reported continuous indentation loading curve obtained for an (001) NaCl crystal surface as obtained with a universal testing machine (Instron) and a 6·35 mm diameter ball indenter.
1
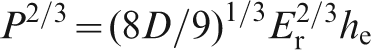
The left side Hertzian dashed line marked he was determined from equation (2) with ES = 43·6 GPa, νS = 0·21, EB = 210 GPa and νB = 0·28. The same he curve is shown at the right side unloading curve hu with addition to he of Δhm for the machine displacement determined by pressing the ball into a hardened steel platen. Thus, it may be seen that the unloading curve is given essentially by the same Hertzian prediction plus the machine deformation. The Hertzian prediction for load P dependence on he is obtained as
Macroindentation loading curve for NaCl crystal 1
Hertzian P2/3 versus h load–displacement comparison for NaCl crystal (adapted from Ref. 1)
Figure 4 shows a comparative nanoindentation continuous loading result to that shown in Fig. 3 but now obtained from the results reported for an oxidiser AP {210} crystal surface. 9 In this case, involving a spherically tipped diamond nanoindenter with D = 0·94 μm and EB = 1145 GPa and νB = 0·068, the initial elastic loading result is reasonably well established for the AP crystal constants of ES = 20·5 GPa and νS taken as ∼0·3. With such a small indenter D value, it is quite normal to observe significant ‘pop-in’ behaviour at yielding and extending onward into the plastic deformation regime, even for metal crystals. 4 Such results have been particularly presented for tracking the elastic loading behaviours for MgO crystal surfaces by Gaillard et al. 10 and for Al2O3 crystal surfaces by Lu et al. 11
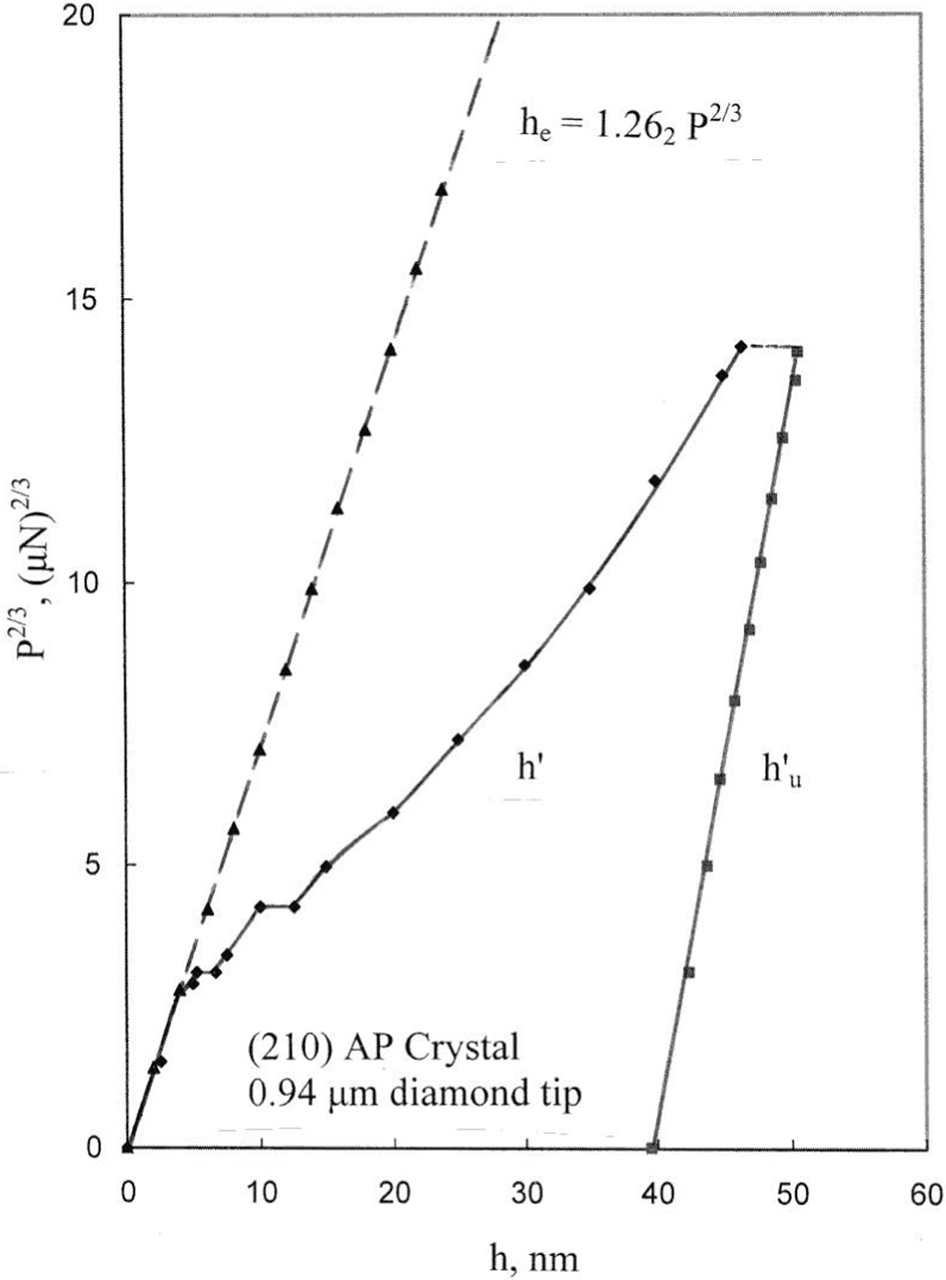
Hertzian P2/3 versus h load–displacement nanoindentation result for AP (adapted from results presented in Ref. 9)
The AP unloading curve in Fig. 4 is clearly seen to be steeper than that shown on initial loading and is different in that regard from the loading/unloading behaviour shown in Fig. 3. The reason is because of the larger strain for the AP case of (d/D) = 0·44. In addition, please note even with the successive pop-in steps the convex nature of the initial plastic loading dependence in Fig. 4 that may be compared with that obtained at the same smaller hardness strain behaviour measured in the macroindentation hardness test in Fig. 3. Furthermore, in larger strain results for the NaCl crystal, as observed here for the AP crystal result, the loading curve turns upward, thus indicating the occurrence of strain hardening.1,6 Otherwise, a constant ordinate slope of the plastic loading curve in Figs. 2 and 4 would correspond to an essentially constant hardness stress as seen from employment of the rigid ball expression for d.
Elastic–plastic deformation
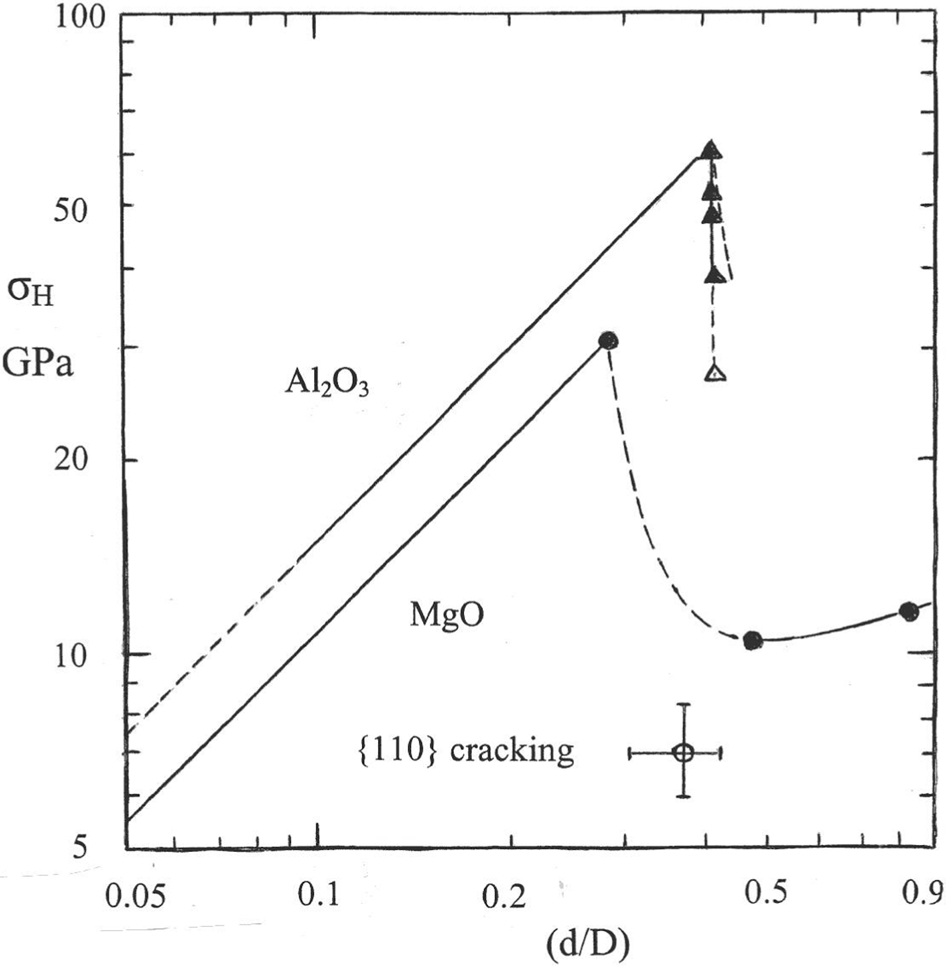
Figure 5 shows an important elastic–plastic loading curve result reported by Chaudhri for an MgO crystal indented with a spherically tipped diamond indenter with D = 0·40 μm, as determined for the indicated Hertzian elastic loading curve.1,12 The loading curve has been transformed into the stress–strain curve shown in Fig. 6, including the plastic yielding consequence shown of the dashed pop-in displacement. The figure also contains for reference the crack associated MgO point taken from Fig. 1 and, in addition, the elastic loading line for the Al2O3 result mentioned from Lu et al. 11 plus a number of filled triangle hardness values Lu et al. reported from careful measurement of their Berkovich indenter determined residual indentations. A fixed plastic value of (d/D) = 0·42 is assumed for the triangular Berkovich indenter, and thus, on indenting past the spherical diamond tip, the effective hardness strain remains constant. The lowest open triangle hardness point is a representative microhardness value taken from Gilman. 2 As already mentioned, the indicated smaller contact area associated with plastic yielding at smaller applied loads is responsible for the ‘indentation size effect’ that is attributed to the relative scales of indentation size and the size and distribution of dislocation defects being activated by the applied hardness stress. 4
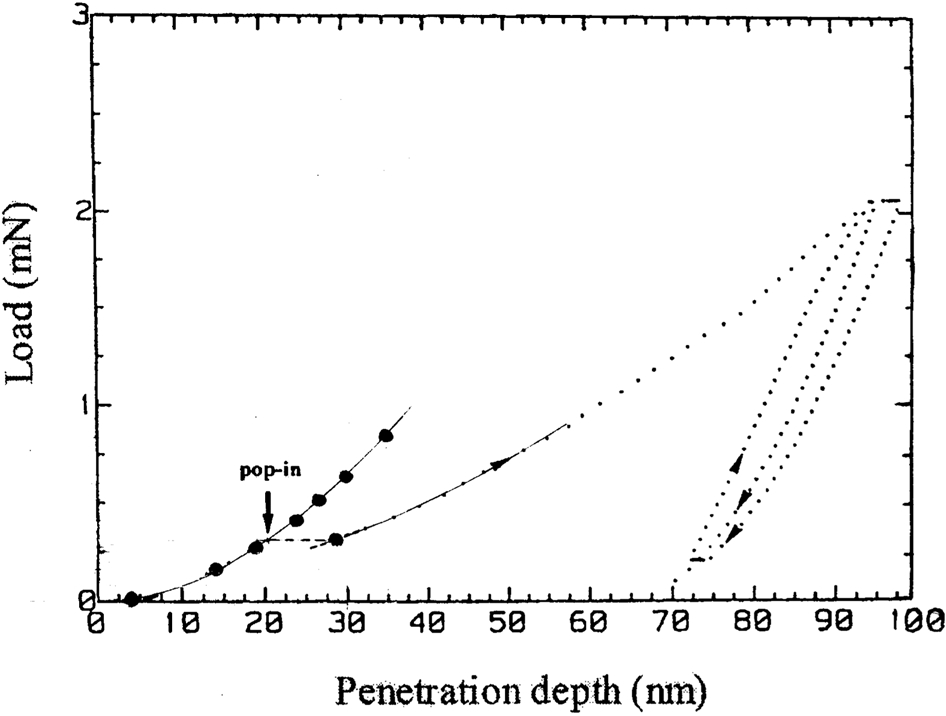
Elastic/plastic indentation curve from Chaudhri 12 for MgO crystal (as adapted in Ref. 1)
The IFM predicted onset of cracking, which is inversely dependent on the effective indenter size as shown for the two D values on the Hertzian line for MgO in Fig. 1, is greater than the experimental values shown for both MgO and RDX because of the internal stresses produced by dislocation pile-ups. Figure 7 shows crack free nanoindentation hardness stresses obtained for RDX from measurements reported by Ramos et al. 13 in comparison with the RDX microhardness measurements involving cracking and the NaCl continuous loading curve from Fig. 1. In Fig. 7, the Hertzian line for the microhardness results was obtained with a steel ball (EB = 210 GPa and νB = 0·28), and ES was taken as 18·4 GPa and νS = 0·3, whereas the line for Ramos et al. employed ES as 15·0 GPa, νS = ∼0·3, and a specified spherically tipped diamond indenter with EB = 1145 GPa, νB = 0·068 and D = 2·96 μm. The increasingly higher ‘yield stress’ measured by Ramos et al. was obtained for different qualities of the RDX crystal surface being indented; in moving to higher order Hertzian triangle points for thermally cleaved, roughly mechanically cleaved, smoothly cleaved and for a naturally smooth habit plane. The differences in stress levels were attributed to the underlying defect content of the thusly prepared crystal surfaces.
Nanohardness of RDX crystals obtained from results in Ref. 13 and comparison with RDX microhardness results and continuous loading curve for NaCl from Fig. 1
Dislocation model description for MgO
At microscale dimensions, dislocation slip and/or deformation twinning displacements are made obvious in the plastic deformation zones centred on residual hardness indentations. Figure 8 shows a well studied case for an aligned diamond pyramid indentation put into an (001) MgO crystal surface,3,14 resulting in prominent troughs, as modelled in Fig. 9. Close examination of the curvature of the angular lines within the residual indentation of Fig. 8 provides visual evidence of the apex of the indentation being raised on unloading. Estimation of an elastic strain value of ∼0·11 for the MgO microhardness result plotted at (d/D) = 0·375 in Fig. 1 gives indication of the importance of such elastic recovery. 3
Image (SEM) of MgO troughs 3
MgO dislocation model 14
The more encompassing model of the dislocation deformation field in Fig. 9 gives indication too that the cracking along diagonal 〈110〉 directions on the four vertical {011} planes containing the [00−1] load direction is attributed to the volume accommodating secondary slip on subsurface adjacent {110}〈110〉 slip planes and directions. The dislocation reactions were described originally in the pioneering work performed by Keh et al. 15 Figure 10 illustrates the specific crack type dislocation reactions that are produced along the inclined 〈111〉 directions. 16 Cracking is initiated by juxtaposed dislocation pile-ups whose opposing Burgers vector component displacements along the [−110] direction for the cited dislocation reaction in Fig. 10 split apart the (−110) lattice planes containing the loading direction. Such dislocation pile-ups, as will be described later in the present article, are responsible for the Hall–Petch (H–P) polycrystal strength dependence on the inverse square root of average grain diameter, as reviewed in terms of upper limiting strength properties achieved at nanoscale material grain sizes. 17 It is also important to point out relative to Fig. 8 that the downward ‘trough-like’ crossing structure produced along 〈100〉 directions by the primary indentation forming dislocations being forced away from the indentation in a screw orientation is uniquely connected to the dislocation explanation for the plastic deformation zone. 14 Such troughs have been observed also for microhardness indentations put into an AP crystal surface. 18
Dislocation pile-ups and cracking reaction in MgO 16
Plastic deformation and cracking measurements
The long standing observation of a P2/3 dependence for the depth of cone type cracking dimensions at ball type indentations made for relatively brittle ceramic and related crystals was explained on an IFM basis by Frank and Lawn. 19 Such analysis was rapidly extended to apply also to the radial extent of tip to tip cracking for diamond pyramid indentations, for example, with such applications as described by Elban et al. 20 for the results obtained on sucrose crystals. Figure 11 shows a compilation of such dependencies for tip to tip crack measurements made for MgO crystals in comparison with their corresponding diamond pyramid diagonal lengths and also including comparison with a less obvious log/log (3/2) dependence of P on tip to tip crack length for measurements made on RDX crystal surfaces.21–25 Figure 12 shows matching optical and X-ray imaging views of such cracking at macroindentations made on a cleaved MgO crystal surface and for which the local state of hardness was measured by placing very low load microindentations in the resultant plastic deformation zone. 24
P versus dI and dC for cracking of RDX and MgO 6
Macroindentation in MgO and X-ray topographic images (adapted from Ref. 24)
In accordance with the Frank and Lawn IFM analysis, the slope of the log/log (3/2) dependence of P on the extent of cracking provides the determination of a fracture surface energy for cracking. Elban 26 had pointed out that the surface energy value determined for RDX by Hagan and Chaudhri 23 of 0·07–0·11 J m−2 was above the thermodynamic value of 0·0432 J m−2 obtained from analysing contact angle measurements. The closeness of the values gives indication of only a small plastic work contribution to crack propagation relative to that established for other materials. The result is important because of concern for the role of plastic deformation in the generation of hot spots for explosive decompositions. The result favours a greater role of dislocation pile-up avalanches in initiation as compared with propagation of cracking being important for hot spot generations. 17 The higher stresses that are measured for the initiation of dislocation pile-ups shown for the smaller nanoindentations in Fig. 7 also favour an initial plasticity aspect in hot spot development. An increasing rate of loading pushes the hardness stresses to higher values, as reviewed by Chaudhri 27 and is shown here in Fig. 13 for the compilation of hardness and cracking results for MgO crystals.22,24,28 An increased hardness at higher applied forces and lesser extent of cracking is obtained at higher rates of loading, and very significantly, the extent of cracking follows the indentation size dependence rather than the (3/2) type IFM prediction. Clough et al. 29 have related such rate effect for ball impact deformations of metals to conventional deformation rate effects observed in compression tests and explained on a dislocation mechanics model basis. 30
P versus dI and dC for MgO at increasing loading rate
Similar indentation induced cracking in the hardness testing of Si crystals at ambient temperature is an interesting research topic both for consideration of the role for plastic deformation and for IFM application, plus inclusion of phase transformations.
27
Lawn
31
developed an IFM expression for the cracking stress σC in ball type tests performed on such crystals as

 and the other parameters have already been defined with respect to equation (1). The values of σC in Fig. 1 were determined in accordance with equation (4). The equation leads to the reduced values of σC that are shown for smaller D values on the dashed Hertzian line for MgO. Figure 14 shows a compilation of the results reported by Armstrong et al.
32
over a large range in load values and for several indenter types, all of which have been converted into equivalent ball test results.33–37 The measurements and their connection with the ball test results obtained by Lawn made clear that plastic yielding preceded cracking in the same manner in the Si crystals as occurred for the MgO results shown in Figs. 1 and 11. In fact, to help with minimising experimental scatter, Lawn had made his measurements on abraded Si crystal surfaces. The measurements shown in Fig. 14 were extended to investigate hardening and cracking effects at nanoscale dimensions in continuous loading curves obtained on (carbon ion/SiC implanted) Si crystal surface layers.
32
and the other parameters have already been defined with respect to equation (1). The values of σC in Fig. 1 were determined in accordance with equation (4). The equation leads to the reduced values of σC that are shown for smaller D values on the dashed Hertzian line for MgO. Figure 14 shows a compilation of the results reported by Armstrong et al.
32
over a large range in load values and for several indenter types, all of which have been converted into equivalent ball test results.33–37 The measurements and their connection with the ball test results obtained by Lawn made clear that plastic yielding preceded cracking in the same manner in the Si crystals as occurred for the MgO results shown in Figs. 1 and 11. In fact, to help with minimising experimental scatter, Lawn had made his measurements on abraded Si crystal surfaces. The measurements shown in Fig. 14 were extended to investigate hardening and cracking effects at nanoscale dimensions in continuous loading curves obtained on (carbon ion/SiC implanted) Si crystal surface layers.
32
Compilation of P versus di and dc for Si crystals 32
Hall–Petch grain boundary strengthening connections
Hall
38
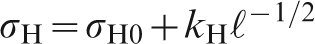
had proposed on the basis, first, that the hardness of metals could be correlated with their stress–strain behaviours and, second, that their yield stresses followed an inverse square root of average grain size dependence, therefore, that the hardness stress should also follow that dependence, now eponymously known as H–P dependence after related yield and fracture stress dependences on grain size measurements reported by Petch, that is
Subgrain boundary and grain boundary hardness
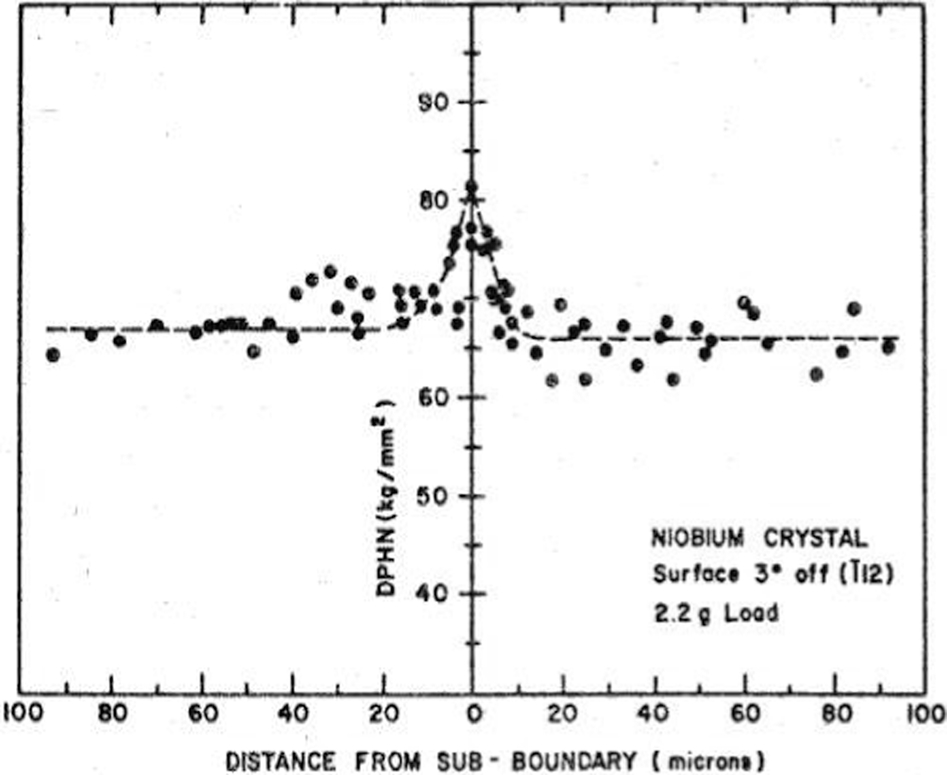
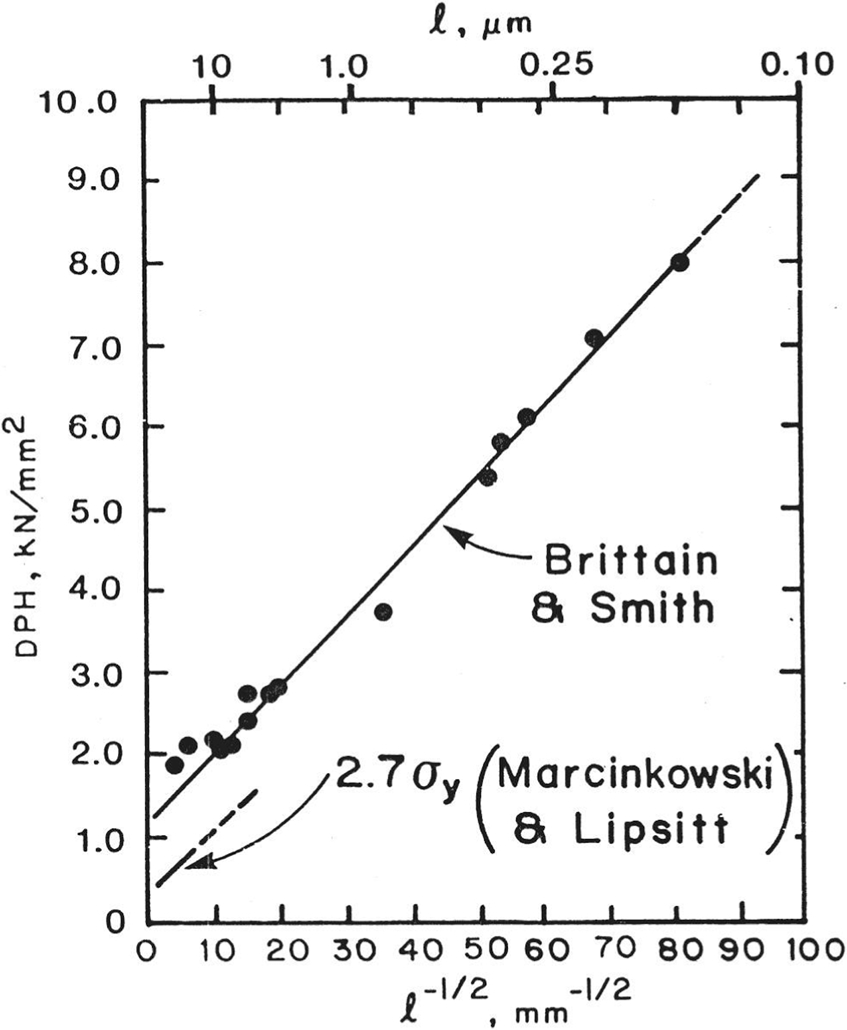
The H–P model description of grain boundary resistance to plastic flow led to the notion that grain boundaries or subgrain boundaries could exhibit exceptional hardness. In addition, there was particular interest in measuring the hardening produced by subgrain boundaries in Nb single crystal and polycrystal materials because of the known importance of substructural strengthening for the material. 46 Figure 16 shows such microhardness measurements obtained for a subgrain boundary in a relatively pure, electron beam grown Nb single crystal. Additional X-ray diffraction imaging (X-ray topography) of the subgrain structures and an H–P dependence based on measured subgrain boundary spacings in Nb crystals were also reported. 47 Essentially, identical H–P dependences were obtained on a subgrain size or grain size basis. Figure 17 shows a comparison of the reported microhardness measurements for both single crystals and polycrystals.48,49 Westbrook also reported polycrystal grain boundary hardness results for Mo materials. 49 Important grain boundary microhardness measurements were reported for Nb bicrystals by Chou et al. 50 Confirming modern nanoindentation measurements have been reported by Ohmura and Tsuzaki, 51 Eliash et al. 52 and Britton et al. 53
Nb subgrain boundary hardness 46
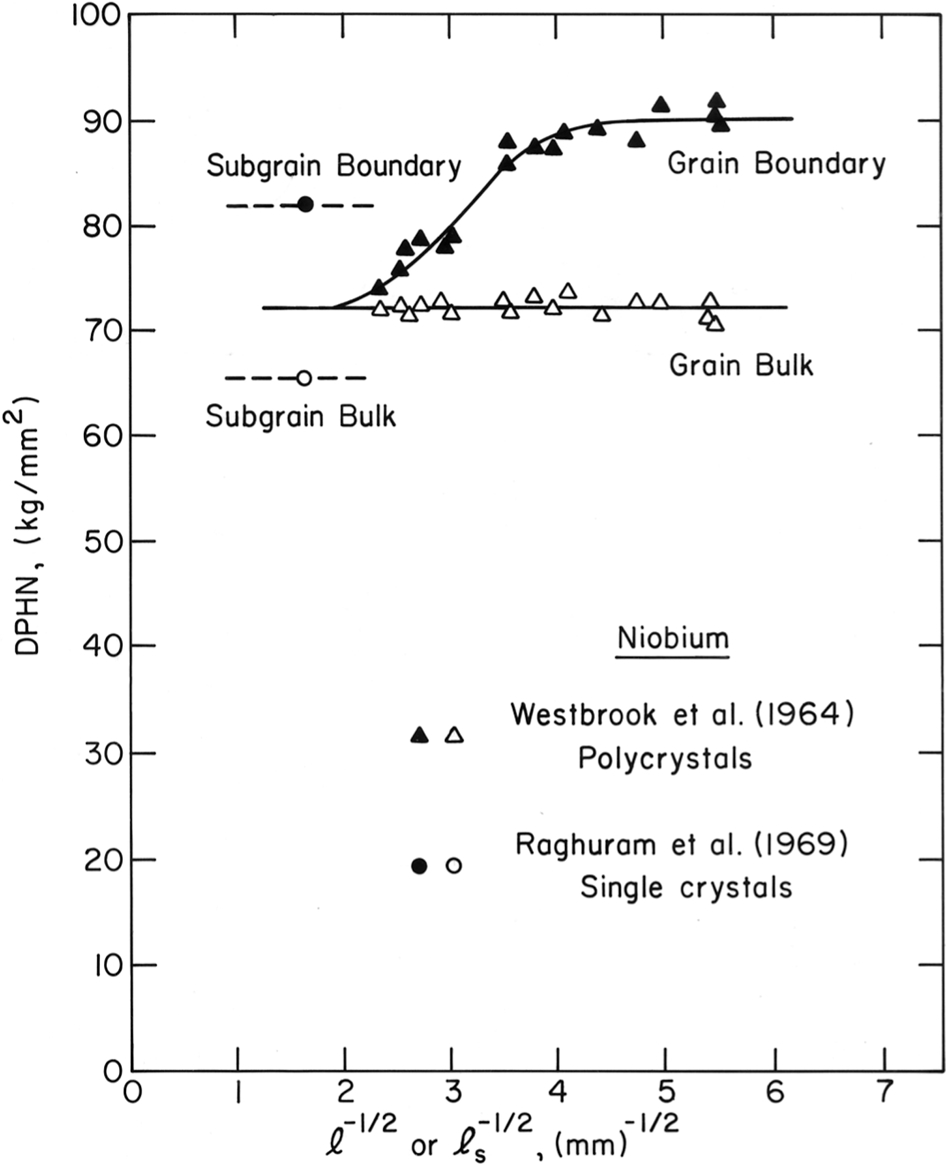
Nb single crystal and polycrystal grain boundary hardness 48
An interesting nanoindentation experiment and analysis associated with the determination of grain boundary hardness has been reported by Aifantis and Ngan 54 for 2·2 silicon–iron polycrystal and Nb bicrystal materials when tested in a particular geometry. The experiment involved indenting a material surface with an underlying parallel grain boundary interface for which a pop-in-like displacement in the loading curve could be associated with the indenter produced subsurface plastic deformation overcoming the grain boundary resistance. The experimental results were interpreted on a gradient plasticity basis applied to describing an increased resistance to deformation of the boundary interface as the indenter point was closer, and an H–P type of dislocation pile-up dependence was derived. The experiment compares with an earlier microscale experiment reported by Takamura and Muira 55 of indenting a prestrained alpha brass bicrystal surface at various distances from the boundary running normal to the surface and determining an increased hardness also as the indentation was positioned closer to the boundary. For this case also, the microhardness versus distance from the boundary was interpreted to follow an H–P type prediction in accordance with the dislocation density expected to be greater nearer to the boundary.
A macroscale hardness connection with such grain boundary measurements was made by Armstrong and Javadpour 56 for a textured Al–Li 2090 E41T651 material by performing macroindentation on the polished and etched surface of a longitudinal (L plane) section (see Fig. 18). Grain boundary resistances to deformation were identified at position a by their residual protrusions from the circumference of the residual indentation. Higher resolution of the boundary regions for apparent cases of grain boundary crossings, such as marked at position b, showed a mismatch of the slip lines at the boundary intersections, and such observations were modelled to require cross-slip at the grain boundary to assist in achieving continuity of the plastic strains. For certain orientations of the grains, cross-slip traces were especially prominent, such as at c, and are so marked in Fig. 18 because the current H–P model description of the k values of pure fcc metals is attributed to the need for cross-slip in the grain boundary regions. The obvious oblate ellipsoidal nature of the residual macroindentation was explained in terms of the greater effective length of slip bands (and dislocation pile-ups) at the top and bottom of the indentation as compared with the shorter slip lengths on either side, in line with the H–P model expectation. Armstrong and Douthwaite 57 related such measurements to the report of conventional Al–Li alloy H–P measurements that are comparable to the very substantial influences reported for grain size effects in the Al–Mg alloy system.
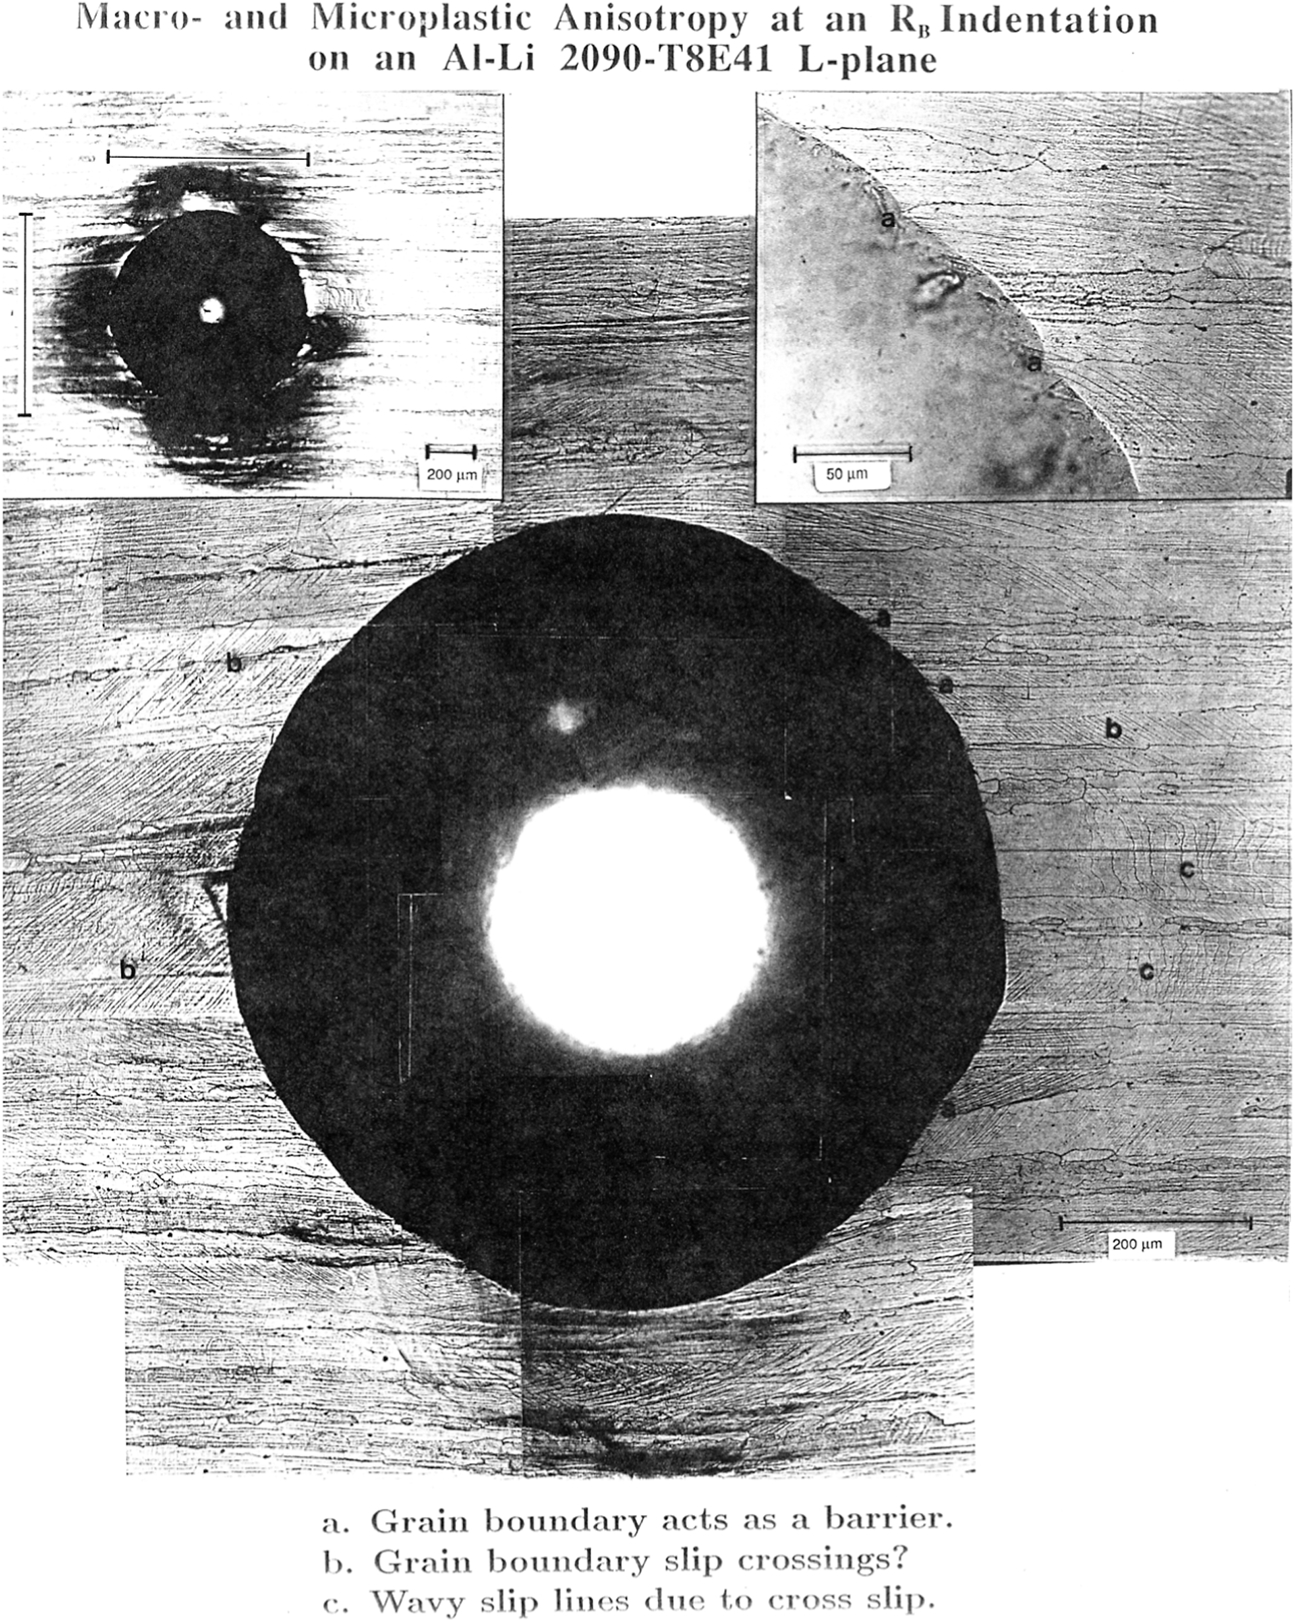
Grain boundary resistance in Al–Li 2090-T8E41 alloy 56
Hall–Petch hardness results for ultrafine grain polycrystals
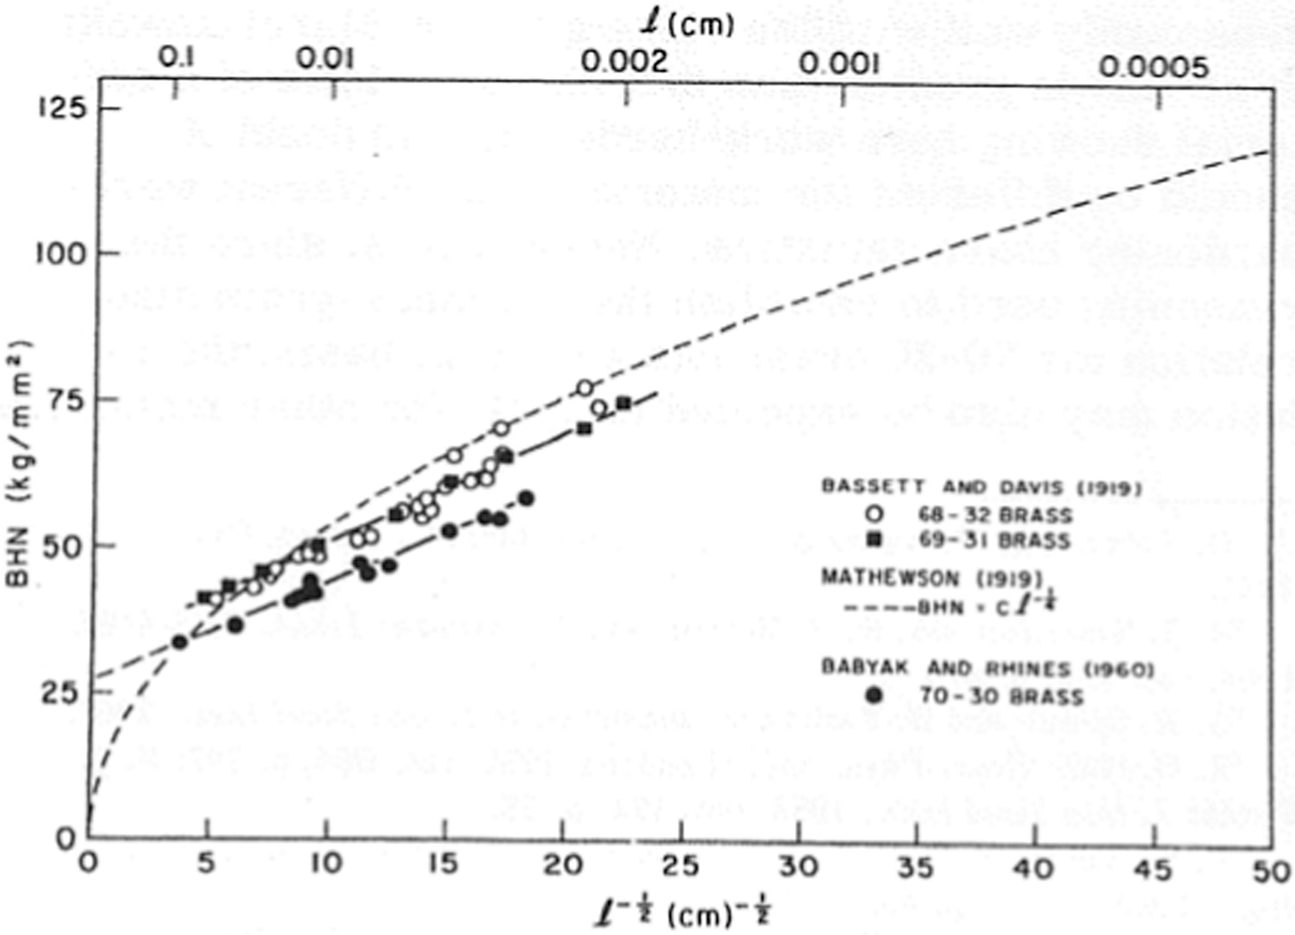
Microindentation hardness testing has often been employed in place of conventional tension or compression testing for measuring the influence of grain size on the plastic deformation behaviour of materials when a limited amount of material might be available or when it was desirable to test the material in the form to be used. Hardness testing provides a relatively easy method of probing the extent of H–P grain size strengthening for ultrafine grain size material. Figure 19 provides an example of the electroplated Cr material that was produced over a very large range in grain size. 58 As shown in the figure, the hardness results fitted the H–P dependence and are compared with similar results obtained for conventional grain size material in compression tests. 59 The higher intercept hardness for the electroplated material was attributed to the residual stress introduced by the electroplating procedure. Another example is shown in Fig. 20 for α-Ti material from an investigation by Hu and Cline, 60 who had employed microhardness testing to track the recrystallisation behaviour of the material. In this case, a single crystal hardness value 61 and hardness measurements reported for conventional grain size material 62 are also shown in the figure. A third example is shown in Fig. 21 for powder compacted W material, again extending into the ultrafine grain size regime. 63 In this case, an indication of difficulty associated with measuring the finer grain sizes of the W material is shown in the figure by comparison of measurements made of missed grain boundaries using the optical microscope as compared with replicas examined with the transmission electron microscope. In all three cases, such hardness testing provided a valuable method of assessing the material strength properties. Recent results have been reported on such H–P aspects of hardness testing for conventional grain size materials by Hou et al. 64 and especially for nanograin size materials by Qu and Zhou. 65
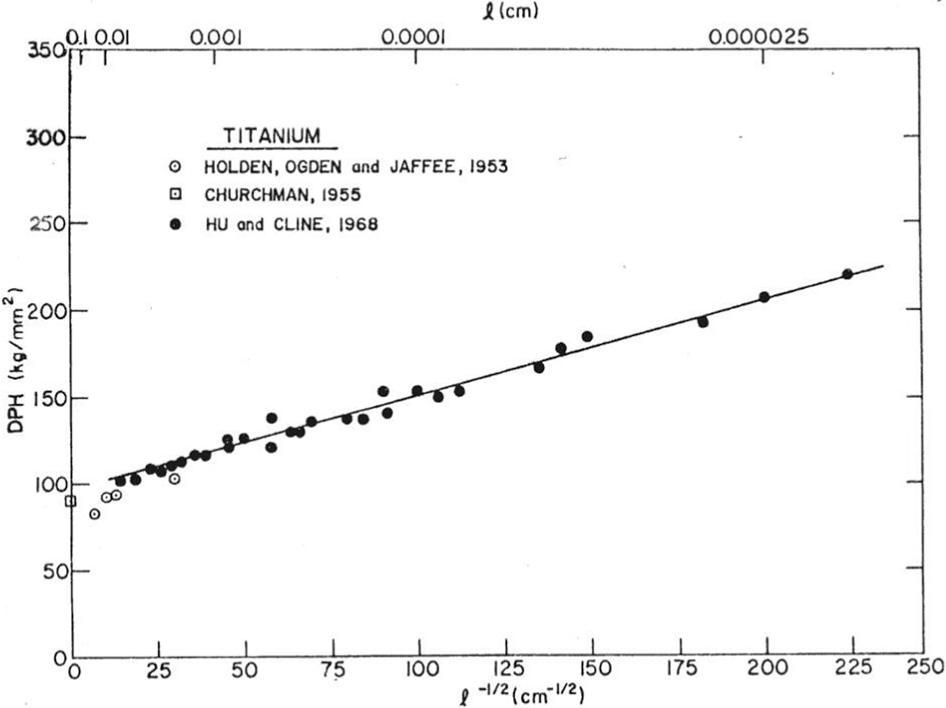
Hall–Petch result for α-Ti recrystallisation measurements, as adapted in Ref. 43 from results reported in Ref. 60 and now with added results from Refs. 61 and 62
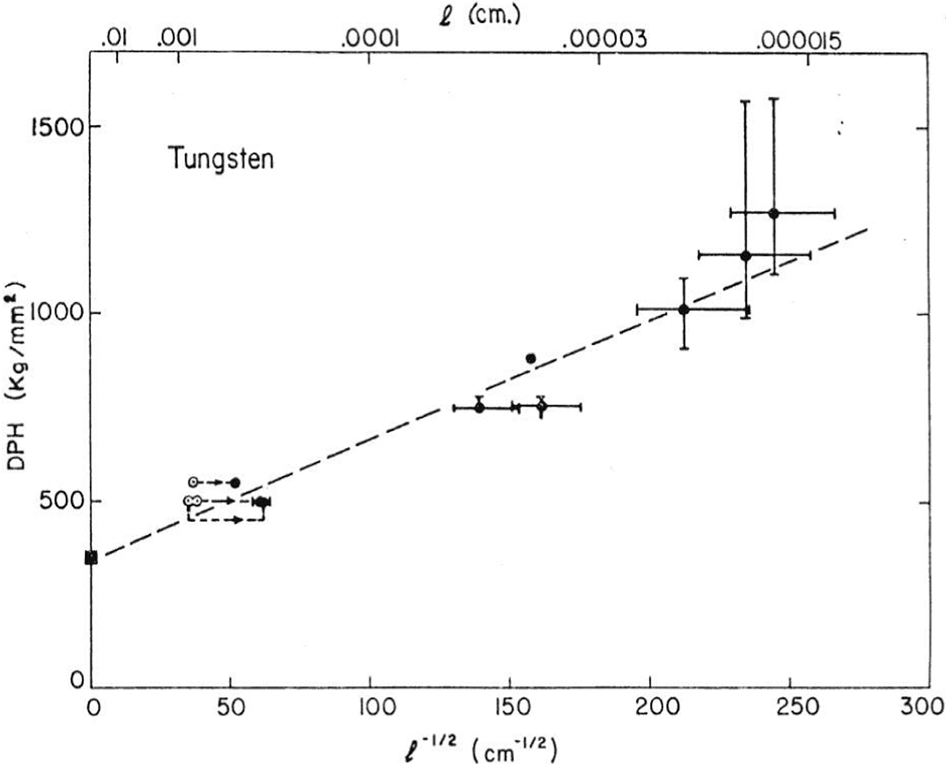
Hall–Petch result for W powder compaction results 63
Hall–Petch results for WC–Co composites
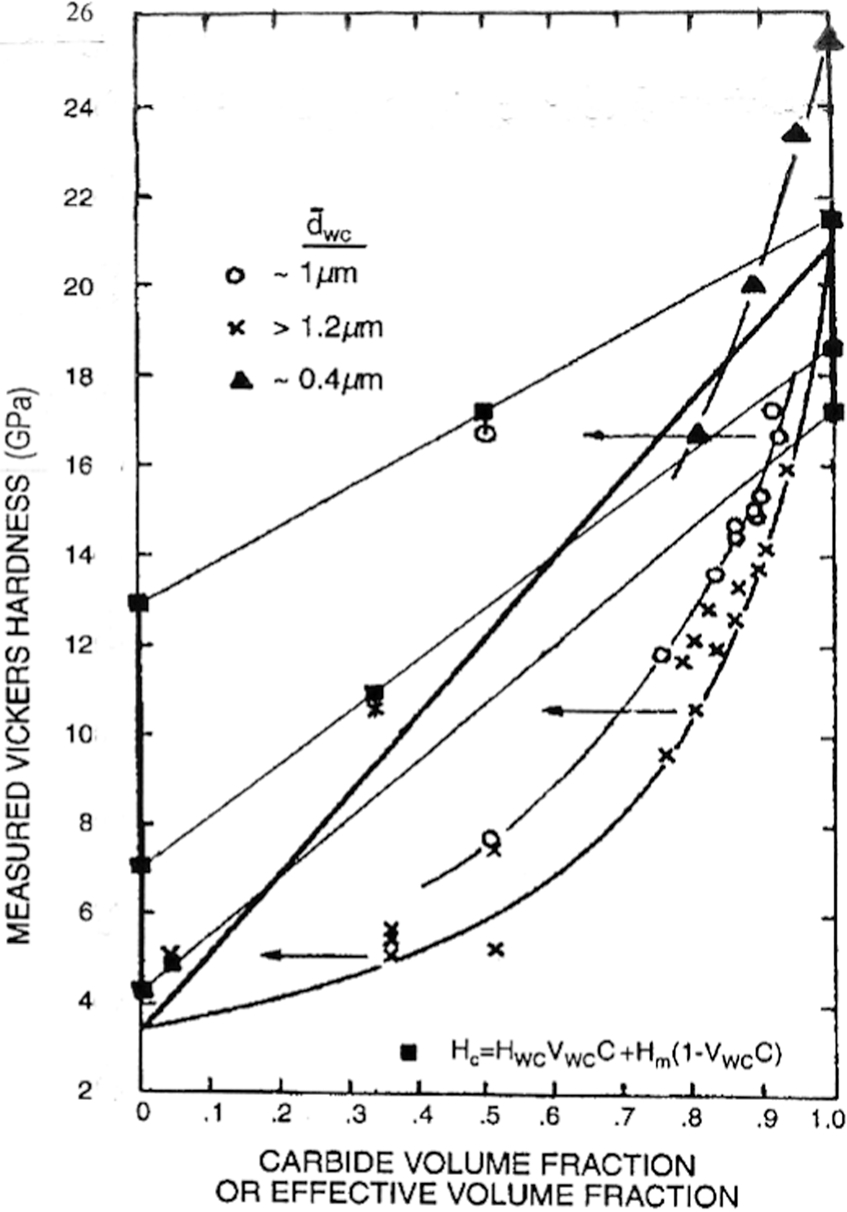
An important example of employing microhardness testing to provide useful information on the properties of a hard material system is provided by the pioneering investigation of the composite WC–Co (cermet) system by Lee and Gurland. 66 They investigated the influence of WC particle size, Co binder mean free path and volume fraction of constituents on the material hardness with the Vickers diamond pyramid test, as was employed for the other material measurements included in Fig. 1. Figure 22 shows both the microhardness measurements and a derived method of interpreting their meaning.
Adapted Lee and Gurland graph for WC–Co 66
In Fig. 22, attention is directed first onto the Lee and Gurland open circle and crossed points that show an influence of WC particle size on hardness at constant volume fraction for the (lower) crossed and (upper) open circle points. The total respective points have been fitted for each particle size to a conventional ‘rule of mixtures’ relationship. Additional experimental filled triangle points reported by Richter and von Ruthendorf
67
for finer WC particle sizes have been added to the graph to show continuation of the WC particle dependence at submicrometre size. Previously, Lee and Gurland had established individual H–P relationships both for the WC particle sizes and for the mean free path of the Co binder phase. Such reported measurements are plotted as filled square points for two crossed points and one open circle point on the opposite ordinate scales for the two material components. From microscopic evidence and a model description proposed for the composite deformation behaviour, Lee and Gurland determined further that the measured contiguity C of the WC particle to particle contacts should be taken into account in a modified rule of mixtures relationship that would include specification of the H–P dependencies of the individual constituents and also their volume fractions as expressed in the relationship

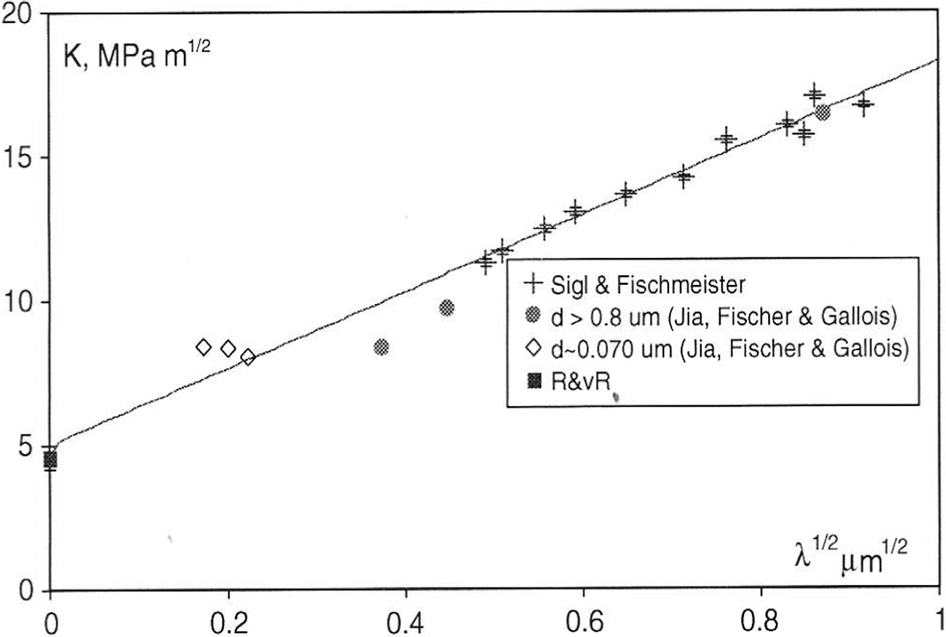
Such particle size effect demonstrated for the WC–Co system has been investigated also by means of conventional fracture mechanics (FM) measurements and by means of Frank and Lawn type IFM methods.67–69 The outcome has been to place important emphasis on the strength and fracturing properties of the Co binder phase and its mean free path length λ within the composite. Figure 23 shows a compilation of the results for the stress intensity K as obtained with IFM measurements reported by Richter and von Ruthendorf 67 for WC, Jia et al. 68 for IFM measurements extended to nanoparticle results and by Sigl and Fischmeister 69 for conventional FM measurements made in bend tests. An H–P based model interpretation of the measurements has been reported by Armstrong and Cazacu 70 involving compilation of extensive hardness results obtained for both WC–Co and Al2O3 material systems. The figure shows that a λ1/2 dependence of K applies reasonably well for the various measurements. The dependence was explained on the basis of the Co binder fracture strength following an H–P type dependence on λ−1/2 but with multiplication of the H–P relation by the square root of the crack tip plastic zone size that was also taken to be linearly proportional to λ. More recently, the hardness and strength properties of the WC–Co system have been extensively reviewed by Armstrong, 71 also including the relationship of the WC–Co material properties to those of MgO and Al2O3 crystal and polycrystal materials.
WC–Co IFM and FM dependencies for WC–Co 70
Summary
The elastic, plastic and cracking indentation behaviours of a number of crystal materials have been described on respective model Hertzian elastic, dislocation mechanics based plastic and IFM cracking descriptions. Consequent indentation size and crack size measurements are reported for ionic, molecular (energetic), covalent and metallic crystals. It is pointed out that effective Er values can be determined from the initial loading or, at small strains, even more easily from the unloading curve dependencies following from the Hertzian elastic equation. In addition, for plastic straining, a crystal lattice based description has been presented for internal dislocation pile-ups leading to cracking in MgO crystals. Exceptional subgrain boundary and/or grain boundary hardness results have been shown for Nb crystals and Nb and Mo polycrystals. For other α-brass, Cr, α-Ti and W polycrystals, H–P inverse square root of grain size dependencies have been presented for the hardness, extending downward to measurements made on ultrafine grain size materials produced by different fabrication procedures. For WC–Co composite material, a model description of the hardness property involves the particle size, the binder mean free path and the contiguity modified effective volume fraction of the constituents. The various size dependencies for WC–Co carry over to the interpretation of IFM measurements, including nanoscale WC particle sizes.