
Abstract
This paper presents a new micromechanical model for the prediction of the tensile modulus and strength of natural fibre reinforced polymer matrix composites. The model addresses issues linked to the statistical variation inherent in fibre reinforcements extracted from plants. The new model introduces a fibre area correction factor (FACF). Modulus and strength are estimated and compared to experimental data for a jute–epoxy composite. The predictions of tensile modulus and strength using the FACF show improvements over those from other micromechanical models presented in the literature.
List of symbols
proportion of the fibres oriented at a fibre angle θn
American Society for Testing and Materials (now ASTM International)
cross-sectional area
computer tomography
composite modulus in the fibre direction
fibre modulus
matrix modulus
fibre area correction factor
fibre diameter distribution factor
fibre length distribution factor
fibre orientation distribution factor
glass fibre reinforced plastics
multiple data set
natural logarithm interpolation model
relative humidity
rule of mixtures
fibre volume fractions
matrix volume fractions
weak link scaling
FDDF
FLDF
FODF
angle between the fibre axes and the composite load direction
fibre angle relative to the applied load direction
FACF
unidirectional composite tensile strength
quasi-unidirectional composite strength
tensile strength of the fibres
matrix tensile strength
matrix stress at a strain that is equal to the fibre failure strain
Introduction
Natural fibres are increasingly being considered as reinforcement for polymer matrix composites as they have the potential to play a significant role in sustainable product and infrastructure development. The use of natural fibres in this context has recently been reviewed by Hill and Hughes,1 Summerscales et al.,2,3 Pandey et al.,4 La Mantia and Morreale5 and Ku et al.6 Natural fibre composites have similar specific elastic moduli to glass fibre reinforced plastics and are perceived by the general public to be more environmentally friendly (i.e. natural fibres sequester carbon dioxide during the growth phase and dependent on the matrix may be biodegradable by composting). Despite the obvious benefits, their widespread use as reinforcements in structural composites has not materialised, at least in part due to the high (batch to batch) variation in their mechanical properties.
It is common practice in fibre reinforcement research to use fibre diameter (an average of several linear measurements) to compute the apparent fibre cross-sectional area (CSA). Virk et al.7 have reported that significant variation in mechanical property measurements may arise from the use of this apparent CSA, which exaggerates the variation in mechanical properties (modulus and strength) as the fibre cross-section is neither circular nor uniform along the fibre length. Alternative techniques to determine fibre CSA include weight per unit length divided by density (but density measurement is not trivial and the weight of individual test samples is very small) or non-destructive imaging (but X-ray computer tomography resolution is limited).
The mechanical properties of a composite can be predicted using micromechanical models. These models use the mechanical properties of the individual constituent materials, the relative volume fractions and the fibre reinforcement characteristics. Micromechanical models are frequently employed to optimise composite properties for a specific application, but the irregular CSA of natural fibres presents a further complication. Facca et al.8 have considered elastic modulus prediction of natural fibre reinforced thermoplastics and suggested that further study should include fibre angle and length distribution factors to improve predictions. The present paper seeks to validate a novel methodology for tensile modulus and strength estimation of natural fibre composites through careful consideration of each parameter in the rule of mixtures (RoM) combined with the introduction of a fibre area correction factor (FACF). Modulus and strength measurements for a jute–epoxy composite are compared to the FACF model predictions as well as to other micromechanical models that are frequently employed throughout in the literature.
Materials and methods
The present study considers jute–epoxy composites using one layer of 880 g m−2 carded quasi-unidirectional technical jute fibres from a single source in South Asia. The fibre dimensions,7 modulus, strength and fracture strain data for these fibres, assuming circular fibre cross-section, have been reported elsewhere.9–12 The composite plate was manufactured using fibres from the same batch by resin infusion with a flow medium/distribution mesh.13 The fibres for one plate were dyed black with Procion MX cold fibre reactive dye, and the epoxy matrix was pigmented white (West System 501 White Pigment for epoxy) to improve the contrast ratio between the fibres and matrix for optical microscopy and image analysis, enabling fibre reinforcement characterisation [i.e. volume fraction and fibre orientation distribution factor (FODF) using images similar to Fig. 1]. Three further plates were manufactured with undyed fibres and unpigmented resin with otherwise identical conditions.
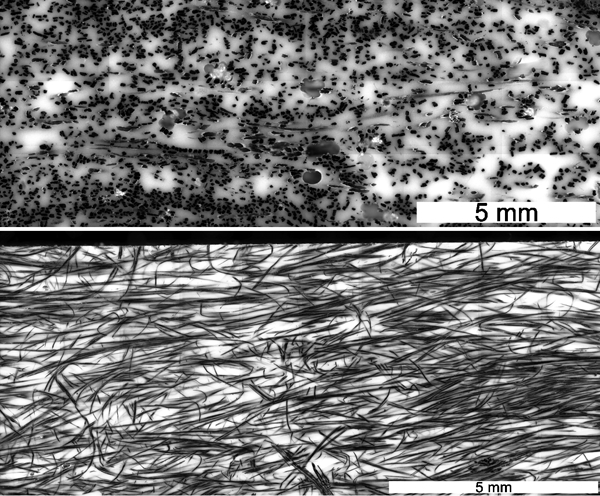
Typical cross-section (top: used to determine fibre volume fraction) and plan view (bottom: used to determine FODF) for dyed/pigmented plate
A flat glass plate treated with release agent was used as the mould. The reinforcement was laid directly on the mould surface. To attempt to achieve a uniform test plate thickness, a prereleased Perspex sheet wrapped in flash tape was placed on top of the fibres, and spacers were inserted between the glass plate and the Perspex sheet to control the plate thickness (in practice, some thickness variation does arise where the flash tape is overlapped). This resin infusion arrangement was bagged, and a vacuum of 10–15 mbar absolute drawn before the resin was infused along the fibre direction. The infusion system was a Sicomin 8100 epoxy resin and an SD8822 hardener mixed at 100∶31 ratio by weight.14 The infused plates were cured for 24 h at ambient temperature and then post-cured at 60°C for 16 h in accordance with the resin manufacturer's recommendation.
Tensile test specimens were machined from composite plates (parallel to the fibre direction) using a diamond slitting saw. The specimen ends were reinforced by gluing ±45° glass fabric–epoxy end tabs to encourage sample failure within the gauge length.15–18 The specimens (the dyed/pigmented samples are referred to from this point forward as S01–S06) were machined and tested according to ASTM D3039 standards.17 The test specimen dimensions were as follows: overall length = 250 mm, gauge length = 150 mm, width = ∼25 mm and mean thickness = ∼3·5 mm. The specimens from the dyed/pigmented plate were then used to characterise composite fibre volume fraction and fibre angle distribution.
Tensile tests were performed at ambient temperature [10°C (this is the correct temperature: there was a heating system failure on the days that the tests were conducted) and 70 relative humidity] on an Instron 5582 universal testing machine with an Instron 100 kN load cell (serial no. UK185) at a constant crosshead speed of 2 mm min−1. The tensile strain in the specimen was measured with a 50 mm gauge length Instron 2630-113 extensometer (serial no. 77). Samples S01 and S03–S06 failed within the gauge length, but S02 failed near the tab. All modulus results are included as this parameter only depends on the initial slope of the stress–strain curve, but the strength and fracture strain results for S02 are discarded.
The tensile modulus, strength and failure strain for each specimen were calculated in accordance with ASTM D3039, and the respective failure modes were recorded. The axial strain range of 1000–3000 μϵ was used to calculate the tensile modulus.17
Micromechanical models
There are numerous micromechanical models in the literature for modulus and strength prediction of fibre reinforced composites. Each model has in-built limitations and assumptions. These include a perfect bond between fibres and matrix, fibres are homogeneous, linear elastic and regularly spaced in the composite, and the matrix is homogeneous, linear elastic and void free. This section provides an overview of some of the most common micromechanical models. Their predictions are compared (in the section on ‘Modulus and strength: measurements and prediction’) to the experimental data for the jute–epoxy composites described in the section on ‘Materials and methods’.
Tensile modulus prediction
Rule of mixtures: the simplest micromechanical model used to predict the composite elastic modulus parallel to the principal axis is the RoM||. It is a parallel spring model based on the assumption that fibres and matrix will experience equal strain under loading in the fibre direction. It is assumed that the fibres can be anisotropic with different mechanical properties in the axial and transverse (radial) directions, while the matrix is isotropic.19
The RoM|| equation19,20 for the modulus of a continuous unidirectional fibre composite in the fibre direction is
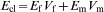
A more generalised form of the RoM is given by

The FLDF assumes that the matrix and fibre remain elastic and the interface bond is perfect, and the shear stress at the fibre ends is maximum and falls to zero after half the ‘critical length’. The tensile stress at the fibre ends is assumed to be zero rising to a maximum after half the ‘critical length’. The FLDF can be calculated using the Cox equation.22
The FODF enables fibre orientation to be considered using the Krenchel equation23

The modulus of natural fibres has been reported to decrease with increasing fibre diameter,9,24,25 and hence, Summerscales et al.3,26 proposed a modification to equation (2). The modification solely focuses on modulus with respect to ‘diameter’ and, hence, does not take account of the fact that natural fibres are not circular. The authors suggest that the modulus of a composite reinforced with natural fibres can be more accurately estimated if an additional fibre diameter distribution factor (FDDF) ηd is included

Tensile strength prediction
A common method used to predict the strength of unidirectional (continuous fibre) composites is to assume that all the reinforcing fibres have identical strength, and the strain in the fibres and the matrix is equal during loading. If the fibre failure strain is less than the matrix failure strain, then the fibre reinforced composite longitudinal tensile strength (parallel to the fibres) can be estimated using the Kelly–Tyson27 equation
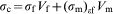

The composite strength is assumed to be the highest of the two values calculated from equations (5a) and (5b).
The tensile strength of the quasi-unidirectional composite loaded slightly off-axis to the fibre direction is given by28

Natural fibres show a large scatter in the tensile strength, and therefore, the mean fibre strength needs to be calculated from the fibre strength distribution. The tensile strength distribution of the natural fibres can be described by two-parameter Weibull distributions.10–12,29,30 However, as there is no factor in the standard Weibull model to account for different fibre lengths, and natural fibre strengths are dependent on the fibre gauge length,10,11 either a multiple data set (MDS) weak link scaling model10 or a natural logarithm interpolation model (NLIM)11,12 was used to predict the fibre strength. The mean fibre strength used in the Kelly–Tyson model was predicted at the geometric mean fibre length of 65·60 mm10 for this batch of jute fibres. The calculated mean fibre strengths using the MDS and the NLIM statistical models were 275 and 298 MPa respectively.
Fibre area correction factor model
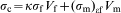
The tensile properties of natural fibre reinforcements are obviously critical to the resultant composite properties. A natural fibre has an irregular cross-section shape, and the CSA varies along the fibre length. All existing models (see section on ‘Micromechanical models’) assume a uniform CSA, except where the CSA is determined from weight, length and density. Many authors determine the mean of multiple projected fibre widths measured along the fibre length and use this ‘diameter’ to calculate the apparent CSA assuming a circular cross-section.10–12,29,30 This method results in an inaccurate CSA7 and hence inaccurate mechanical (modulus and strength) properties. To improve tensile modulus and strength predictions for natural fibre composites, it is postulated that a natural fibre model needs to compensate for the irregularity in the fibre cross-section. This compensation is included here as a FACF (denoted by the symbol κ) and is used to modify equations (4) and (5a), namely

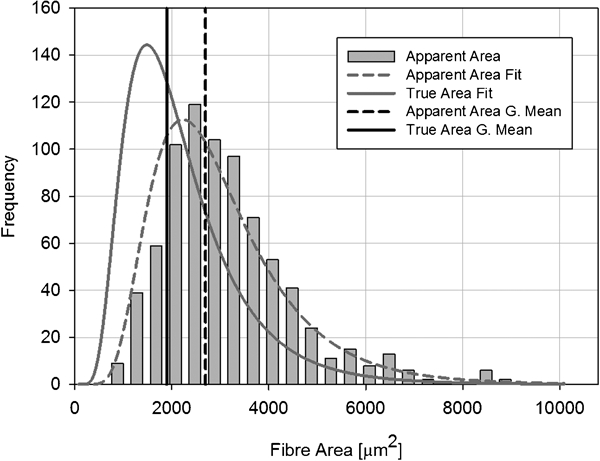
Apparent and true fibre area distributions
The value for FACF above is from the data generated during microscopical characterisation of a sample of >100 fibres from a single batch and, by default, includes variation along the fibre length as there was no selection of the analysed images for position. The FACF may be specific to particular varieties within a species of plant, a function of the conditions during plant growth and dependent on the age of the plant at harvest.
In a separate study of fibres from the batch used here, the projected width of the fibre was measured at 50 intervals (i.e. every 3·6° during rotation through 180°) from transverse sections of the fibre. The apparent CSA was calculated using the projected width as the diameter for circular cross-section. The mean FACF calculated by dividing the apparent CSA by the true CSA was found to be 1·375±0·485 (arithmetic mean) or 1·297 (geometric mean) with a median for the dataset of 1·303. The higher calculated value of 1·42 above from measurements transverse to fibres mounted on test cards probably arises because the pressure applied to the fibre during attachment to the card will move the centre of gravity lower and hence generate higher apparent CSA.
Modulus and strength: Measurements and predictions
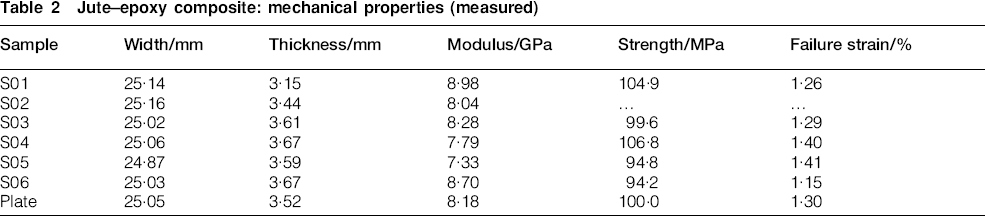
Typical stress–strain curves for the jute fibres used in the present study are presented in Ref. 11. A typical stress–strain curve for the composite is presented in Fig. 3. The mechanical properties for the epoxy–matrix and jute fibres are presented in Table 1. This table also shows jute fibre data from the literature34–41 to confirm that the reported values are consistent with the work of others. Table 2 shows typical experimental data (the six dyed/pigmented unidirectional jute–epoxy composite specimens) from the composite plates. The mean moduli and strengths were 8·19±0·6 GPa and 100·0±5·7 MPa respectively for the dyed/pigmented plate and 8·47±1·18 GPa and 101·0±17·2 MPa for the undyed/unpigmented plates respectively (i.e. the difference between the respective mean values is <50 of the lower standard deviation).
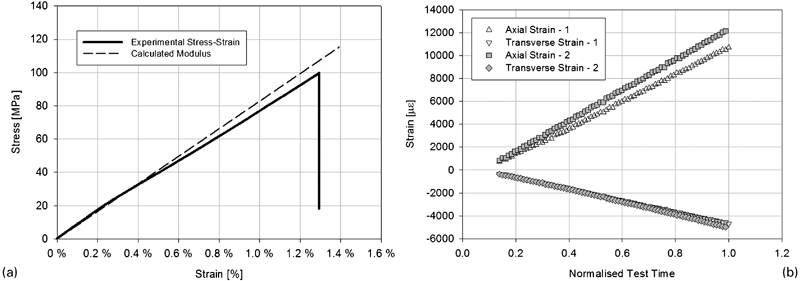
a typical jute fibre reinforced composite stress–strain curve and b typical axial and transverse strain gauge measurements from paired strain gauges on opposite sides of specimen
Matrix and fibre mechanical properties
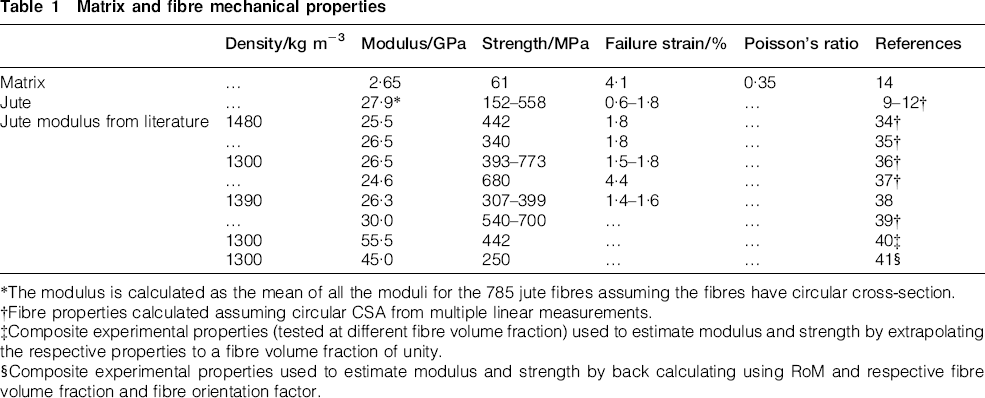
*The modulus is calculated as the mean of all the moduli for the 785 jute fibres assuming the fibres have circular cross-section.
†Fibre properties calculated assuming circular CSA from multiple linear measurements.
‡Composite experimental properties (tested at different fibre volume fraction) used to estimate modulus and strength by extrapolating the respective properties to a fibre volume fraction of unity.
§Composite experimental properties used to estimate modulus and strength by back calculating using RoM and respective fibre volume fraction and fibre orientation factor.
Jute–epoxy composite: mechanical properties (measured)
In the model predictions, the fibre volume fractions and FODFs of the composite specimens were calculated from micrographs. Further details of these calculations are reported by Virk.42 The FLDFs were calculated using the geometric mean of the measured fibre length of the 785 jute fibres (65·60 mm), and the mean apparent diameter (60·16 μm) was used to calculate the fibre CSA (assuming circular cross-section and uniform square packing). The well characterised fibres enable the FDDF to be taken as 1. Table 3 shows the modelling parameters for each specimen, the predicted modulus associated with each of the micromechanical models and the model error when compared to the empirical measurements. The Kelly–Tyson model27 and FACF predictions for tensile strength are compared to the experimental measurements in Table 4. Equation (6) has not been used as the average angle of 7·4° increases the composite strength by just 1·7, i.e. sec2 (7·4°) is 1·017.
Jute–epoxy composite: modulus prediction [and error ()] relative to mean experimental value of 8·18 GPa from Table 2
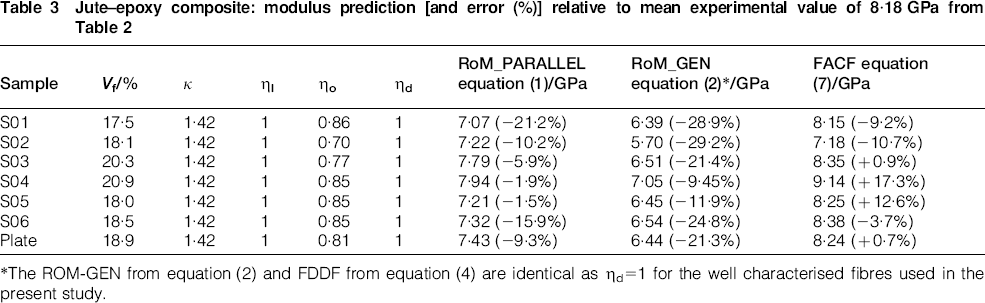
*The ROM-GEN from equation (2) and FDDF from equation (4) are identical as ηd = 1 for the well characterised fibres used in the present study.
Jute–epoxy composite: tensile strength prediction [and error ()]
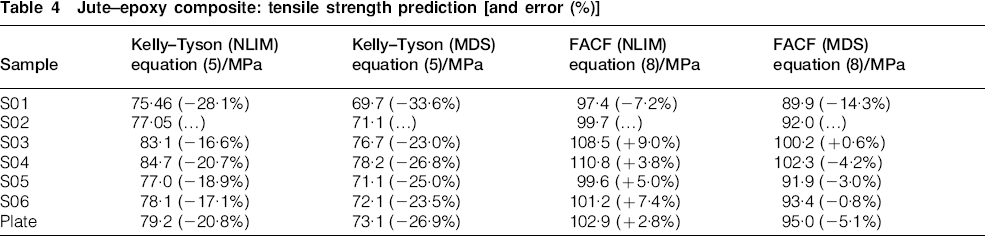
The RoM∥, generalised RoM and FDDF models all underestimated the jute–epoxy composite moduli. The Kelly–Tyson model significantly underestimates the composite strength in all cases. The FACF models proposed in equations (7) and (8) offer the smallest error in the predicted plate (mean) modulus and strength and typically offer better predictions on a sample by sample basis. The improvement results from the FACF which takes account of the ‘true’ fibre area to correct for the undercalculation of mechanical properties due to the apparent fibre CSA being larger than the true value.
Triangulation
In order to triangulate these findings, data from other authors have been analysed. The jute fibre reinforced composite properties reported by different authors are presented in Table 5. The generalised RoM with Krenchel equation (equations (2) and (3)) was used to predict the elastic modulus of the composite using the reported fibre volume fraction, fibre orientation factor and the form of reinforcement used. The jute fibre modulus used in the model was 27·8 GPa taken as the average of all the experimentally measured readings given in Table 1 (excluding 55·5 and 45 GPa as they are estimated from the composites). The calculated composite moduli are reported in Table 6. In each case (except one), it is observed that the calculated modulus is lower than the experimental modulus.
Reported elastic properties of jute fibre reinforced composite
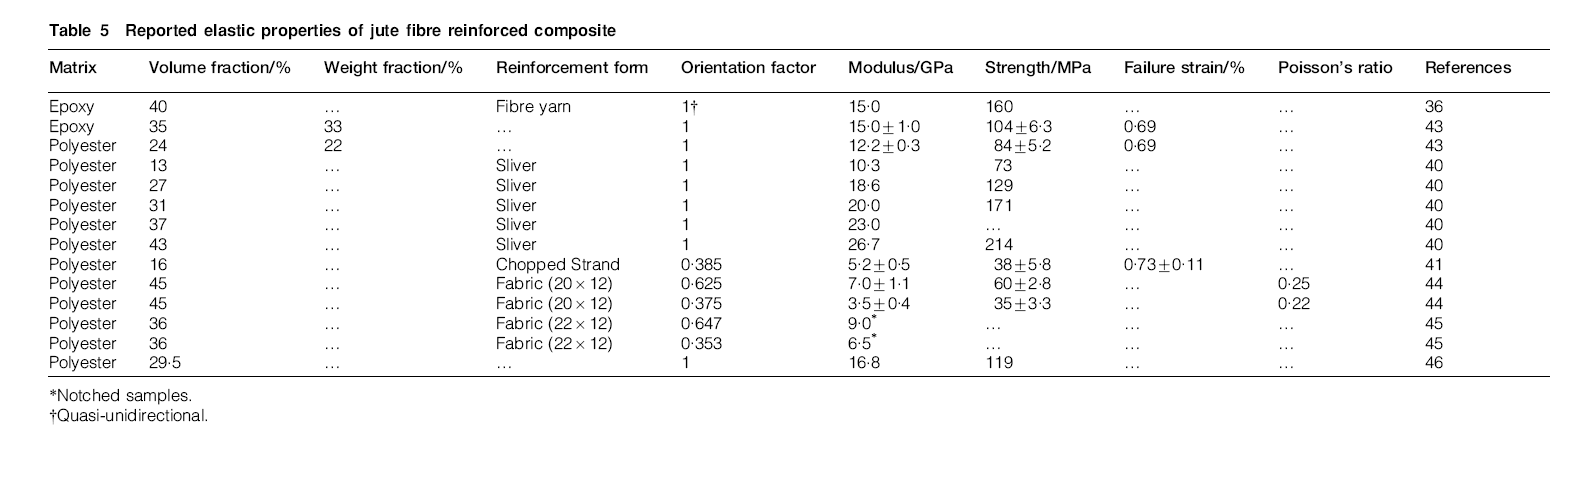
*Notched samples.
†Quasi-unidirectional.
Estimated composite modulus using equations (2) and (7) with error in estimated modulus
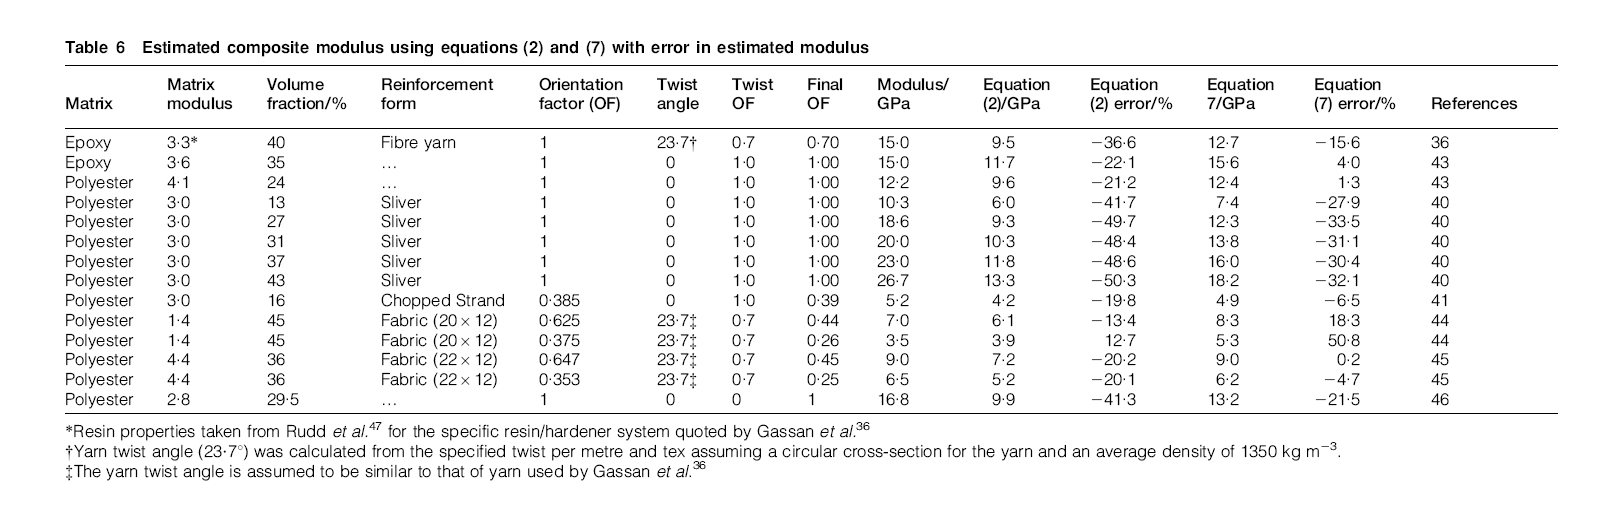
*Resin properties taken from Rudd et al.47 for the specific resin/hardener system quoted by Gassan et al.36
†Yarn twist angle (23·7°) was calculated from the specified twist per metre and tex assuming a circular cross-section for the yarn and an average density of 1350 kg m−3.
‡The yarn twist angle is assumed to be similar to that of yarn used by Gassan et al.36
Assuming that the FACF for the other batches of jute fibres used in the experiments conducted by others36,40,41,43–46 is similar to that reported in the present paper (1·42) and calculating the composite modulus using equation (7) (Table 6), it was observed that the error in the predicted composite modulus is reduced (for all but two cases).44 The large scatter could arise from any of the factors listed in the penultimate paragraph in the section on ‘Fibre area correction factor model’ and from the differences in experimental technique between research groups. The authors of the present paper propose that the value of FACF should be determined independently in other locations to establish whether it can be used as a constant for all batches of jute fibre.
Conclusions
It is common practice in the composite sector to measure fibre CSA using linear measurements of fibre diameter and an assumption of circular cross-section. This method overestimates the CSA and hence results in low values of key mechanical properties (i.e. modulus and strength) of natural fibres. A FACF is proposed and used in the RoM to predict the tensile modulus and strength of experimental jute fibre reinforced composites manufactured from well characterised fibres. The FACF has been shown to improve the prediction of tensile modulus and strength for both the authors’ samples and the other experiments reported in the scientific literature.
Footnotes
Acknowledgements
ASV is grateful to the University of Plymouth for a scholarship to pursue his doctorate. The authors would like to thank a former colleague J. Ellison for obtaining the fibres from IJIRA/IJSG. The present paper was presented at the International Seminar on Strengthening of Collaboration for Jute, Kenaf and Allied Fibres Research and Development, Secretariat of the International Jute Study Group (IJSG) and the Common Fund for Commodities (CFC), Dhaka, Bangladesh, 8–9 June 2011 and the 4th International Conference on Sustainable Materials, Polymers and Composites (EcoComp), Birmingham, UK, 6–7 July 2011.