
Abstract
Prediction of the crystalline structure formation of high entropy alloys is addressed in a novel way by applying principal components analysis to their thermodynamic and electronic parameters. In the simplest form, it shows an excellent discrimination between both face and body centred cubic structures when taking into account the valence electron concentration and enthalpy of mixing. Our analysis indicates that there is a stronger correlation between the formation of multiprincipal components alloys and these parameters than with entropy. The successful prediction of a multiphase structure in TiMnFeNi and the discovery of two novel four component HEAs, MnFeCoNi and TiVMnNb, lends credence to this approach.
Introduction
The discovery of a new class of metallic materials is a relatively uncommon event, which, when it does happen, is followed by a period of intense research activity. This is certainly true of the multiprincipal components metallic materials often referred to as high entropy alloys (HEAs). These alloys form solid solutions with simple crystal symmetries and may exhibit remarkable mechanical and functional properties (magnetism, high temperature strength, etc.). The formation of such alloys was first observed by Cantor et al. 1 in experiments investigating the confusion principal of glass formation: combinations of five, six or more metals were found to form face centred cubic (fcc) or body centred cubic (bcc) solid solutions rather than the intended amorphous alloys or the mixture of intermetallics one might expect. Yeh et al. 2 investigated this discovery and developed the central concept of the HEA, which was defined as being composed of five or more components in roughly equiatomic proportions between 5 and 30 at- and able to form simple bcc and fcc solid solution phases. On first examination, it would seem that these alloys break the Gibbs phase rule, but a simple explanation, first expounded by Kubaschewski, 3 is that, as the number of constituent phases increases, the entropy of mixing will, at most temperatures of interest, act to stabilise disordered solid solution phase and suppress the appearance of ordered intermetallics. However, this simple and rather appealing concept does not, unfortunately, provide a full explanation for the formation of HEAs, and there is a significant body of research related to thermodynamic, atomic size and electronic effects on their formation, stability and crystal structure.
Following on from the work of Yeh et al., 2 it is now accepted that the ability of HEAs to form solid solutions rather than a mixture of intermetallic compounds results, at least in part, from the stabilising contribution of configurational entropy on the system; as the number of components increases, the contribution of entropy to the free energy of the system begins to dominate at solidification temperatures.
In addition to these thermodynamically based analyses, Guo et al. 4 attempted to relate valence electron concentration (VEC) of HEA compositions to their crystal structure in a similar way to that which Hume–Rothery applied to the understanding of the crystal structures of certain copper alloys. Their research yielded the observation that for HEAs with a VEC < 6.87, the solid solution formed had a bcc crystal structure, those with VEC >8 formed fcc solid solutions, and alloys with intermediate VEC formed a mixture of bcc and fcc solid solutions.
These results are remarkable because they were achieved with models developed for ideal pure and dilute systems. This suggests that HEAs are acting as “good” metals and that the bonding in HEA solid solutions is predominantly metallic in nature.
It is therefore evident that many factors could contribute to the formation of single phases in multicomponent systems. Approaches exist to process data where many variables need to be taken into account, reducing dimensionality and allowing the grouping of data and the identification of patterns. One such technique is principal components analysis (PCA), a multivariate analysis method where a statistical tool is employed to reduce the variables of a data set into principal components (PCs) consisting of orthogonal linear combinations of the original variables, which retain as much as possible the original information.5,6
Therefore, applying PCA to the analysis of HEA data may help to highlight the most important variables, as well as provide a new empirical tool for prediction and discovery of novel materials.
Experimental
A multivariate analysis, based on PCA, has been performed using Matlab. The data set used is a combination of 79 alloy systems collected from those in the literature and is available in the online supporting information. These alloy systems have been reported as showing single phase bcc, single phase fcc, a mixture of multiple bcc and/or fcc phases, and multiple phases including intermetallic compounds. Five thermodynamic and electronic structure variables comprising the enthalpy of mixing of the solid solution (ΔHmix), the entropy of mixing (ΔSmix), the atomic size mismatch (δ), the electronegativity difference (Δχ) and the VEC were included in the analysis, being those variables identified and used by Guo and Liu. 7
Following the results of this analysis and examination of the trends observed, three novel alloy systems were selected to test the relationships: TiMnFeNi, MnFeCoNi and TiVMnNb were produced at equiatomic composition from high purity elemental material (>99.9). Five grams of each alloy was melted into buttons of ∼10 mm diameter in an argon backfilled vacuum arc melter (MAM-1 Edmund Buehler), and remelted five times to ensure homogeneity. The samples produced were prepared (by grinding and polishing surfaces to a mirror finish) for X-ray diffraction (XRD) scans for crystal structure characterisation using a Siemens model D5000 XRD with Cu Kα radiation (X-ray traces are corrected for systematic peak broadening with a Kα2 correction) and also examined under scanning electron microscopy (SEM, Siemens Inspect F), using secondary and backscattered electrons, and were subjected to Vickers hardness testing using a Struers Durascan 70 system, with a load of 100 g and a dwell time of 15 s.
Results and discussion
The PCA output provides the information required for the interpretation of the original data set, which is visualised through tables and biplots and which are given in the online supporting information.
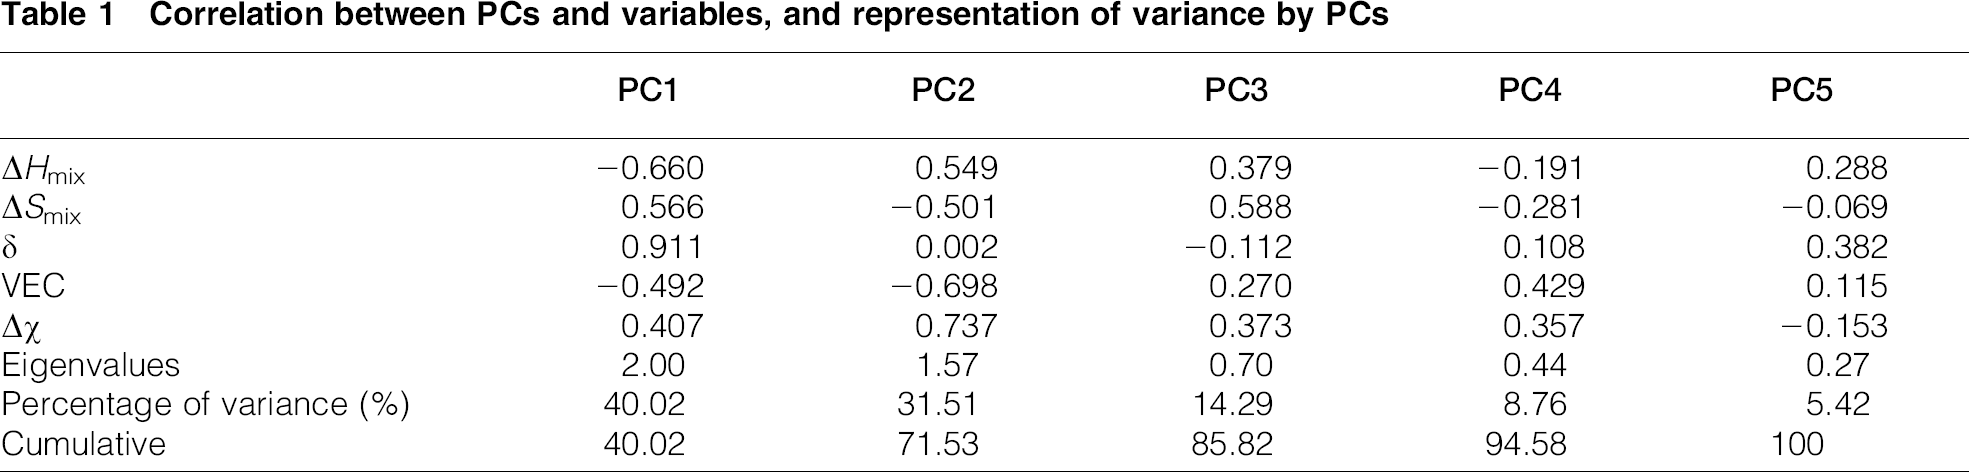
First, the number of PCs required to represent the data is shown in Table 1. It shows the correlation of PCs with the variables (1 means perfect correlation, − 1 inverse correlation and 0 no correlation) and the variance represented by each PC. One criterion for selecting the number of PCs needed is based on the cumulative percentage of the total variance, which is often considered satisfactory within the range of 70–90. 8 Therefore, the first PCs where the cumulative percentage exceeds the cutoff value would preserve most of the information. Looking at Table 1, the cumulative variance exceeds 70 after the second PC, which means that the first two PCs represent the 72 of the information given by the five variables. Three PCs are enough to describe 86 of the variance.
Correlation between PCs and variables, and representation of variance by PCs
Second, the effect of PC1 and PC2 is visualised through a biplot as shown in Fig. 1 (a set of biplots of the three main PCs is included into the online supporting information). This plot is useful for easy visualisation of the data as well as in the interpretation of the relationship between the alloy structure and the variables.
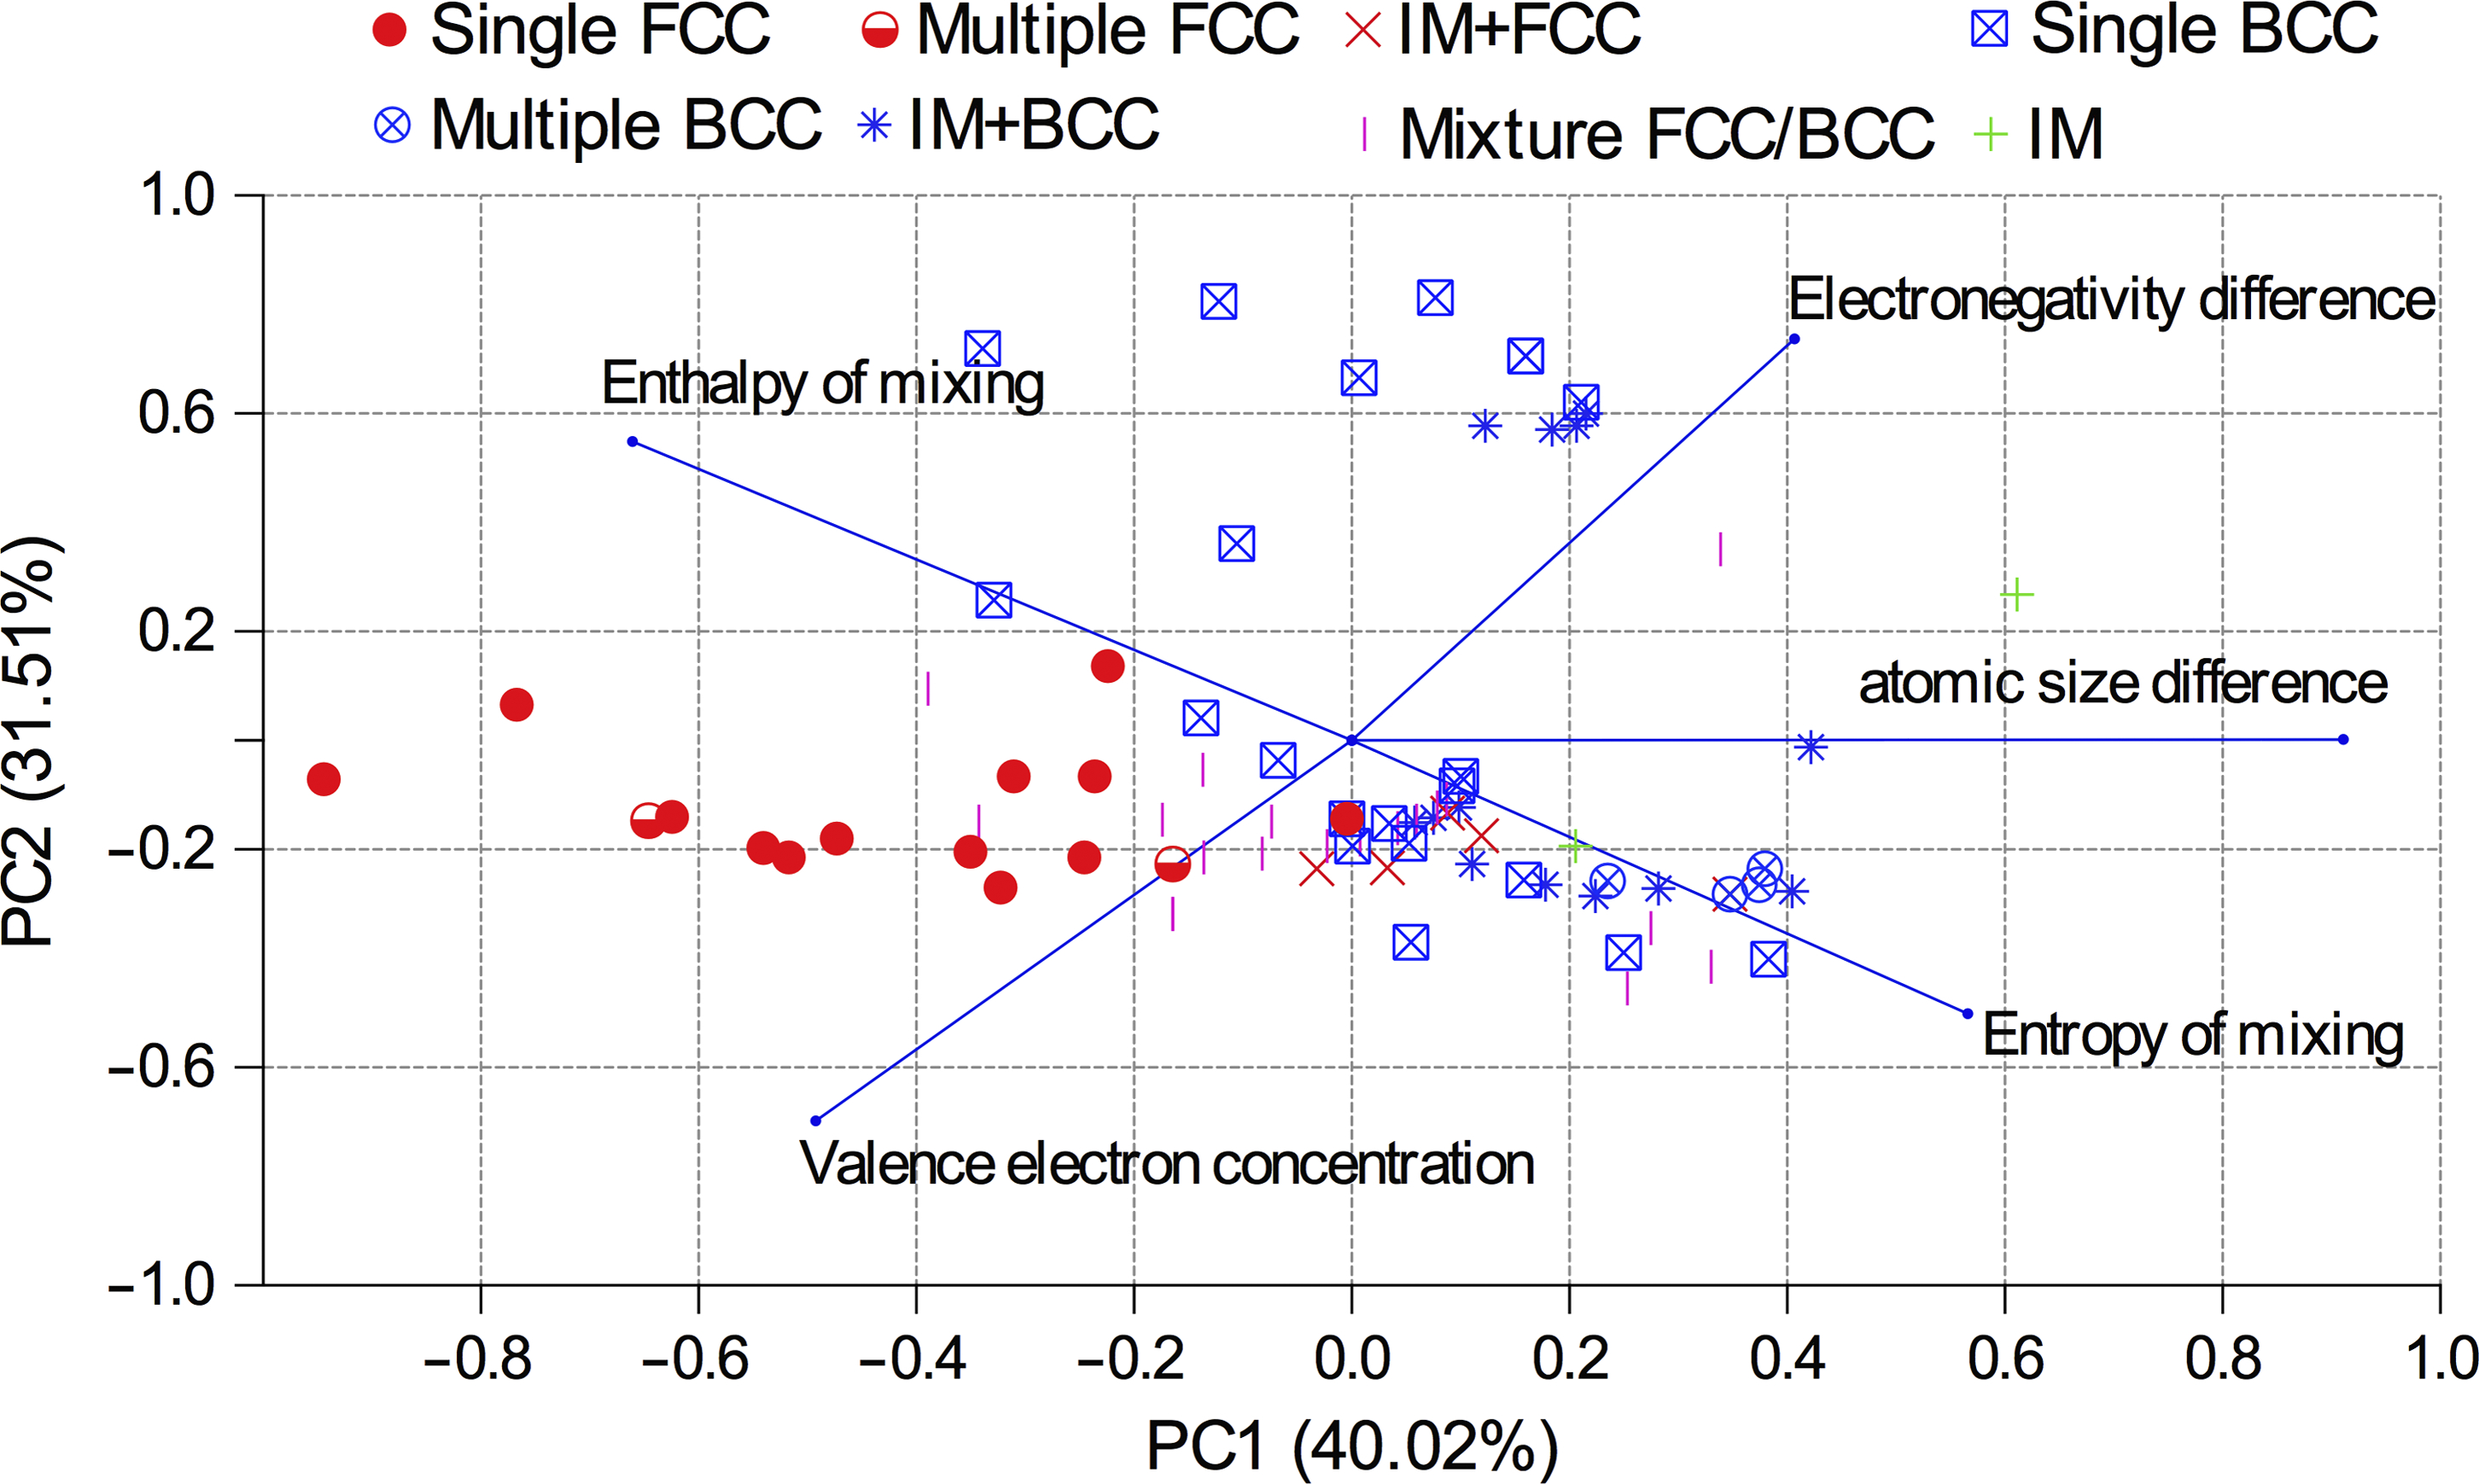
Biplot of first two PCs from PCA of literature data on multicomponent alloy systems (capturing 72 of variation), showing strong sensitivity of HEA formation to ΔHmix and VEC
It includes not only the alloys reported as intermetallics or multiple phases, single phase fcc and single phase bcc, shown by different symbols, but also the positions of the axes corresponding to variations in each of the different input variables as lines. It is clearly observed that alloy systems giving different structures tend to segregate into different regions on the plot. This implies that the crystalline structure of novel HEAs can be predicted in a simple way by identifying the region where the candidate alloy could lie in from its thermodynamic and electronic properties or even by identifying the target properties for an alloy to have a desired structure (for example, by orthogonal projections of the observations onto the PC axes).5,9 There is a certain region of overlap between regions, but from the alloys plotted, the discrimination obtained would be expected to be good.
It should be noted that the enthalpy of mixing used here is a parameter relating to the solid solution, though this could be much larger and negative if the enthalpy of formation of certain intermetallics were considered. This, coupled with the small entropic contribution in (highly ordered) intermetallics, means that the Gibbs free energy of such phases can easily be very low, making them more stable than the solid solution due to the effects that are not directly considered in this approach. Here, we are effectively assuming that the interactions driving ordering are small, and it is somewhat unexpected that the predictions work in spite of this.
However, even this type of plot may not be necessary in all cases. For example, it can be noted from Fig. 1 that the axes representing the variation in δ and VEC are at a non-zero angle to each other, showing that between the two done, a proportion of the variance can be represented. This is expected as plotting these parameters (or parameters derived from them) against each other has been found by previous authors to go some way to isolating the structures, such as Guo and Liu 7 and Poletti and Battezzati. 10 Nevertheless, the angle between the vectors representing VEC and δ is obtuse, indicating some degree of (negative) correlation. The angle between some other variables is closer to 90°, indicating that they express the variability in a more independent manner (vectors at right angles are fully independent in terms of the plotted components). An example of this would be VEC and ΔHmix.
Examples of the data plotted against only two of the five variables are shown in Figs. 2 and 3. These graphs show VEC against δ, representing the type of plot demonstrated in previous work, and VEC against ΔHmix, where trends are found to be particularly clear. The online supporting information also includes a complete series of plots containing the alloy systems reported with respect to parameter pairs.
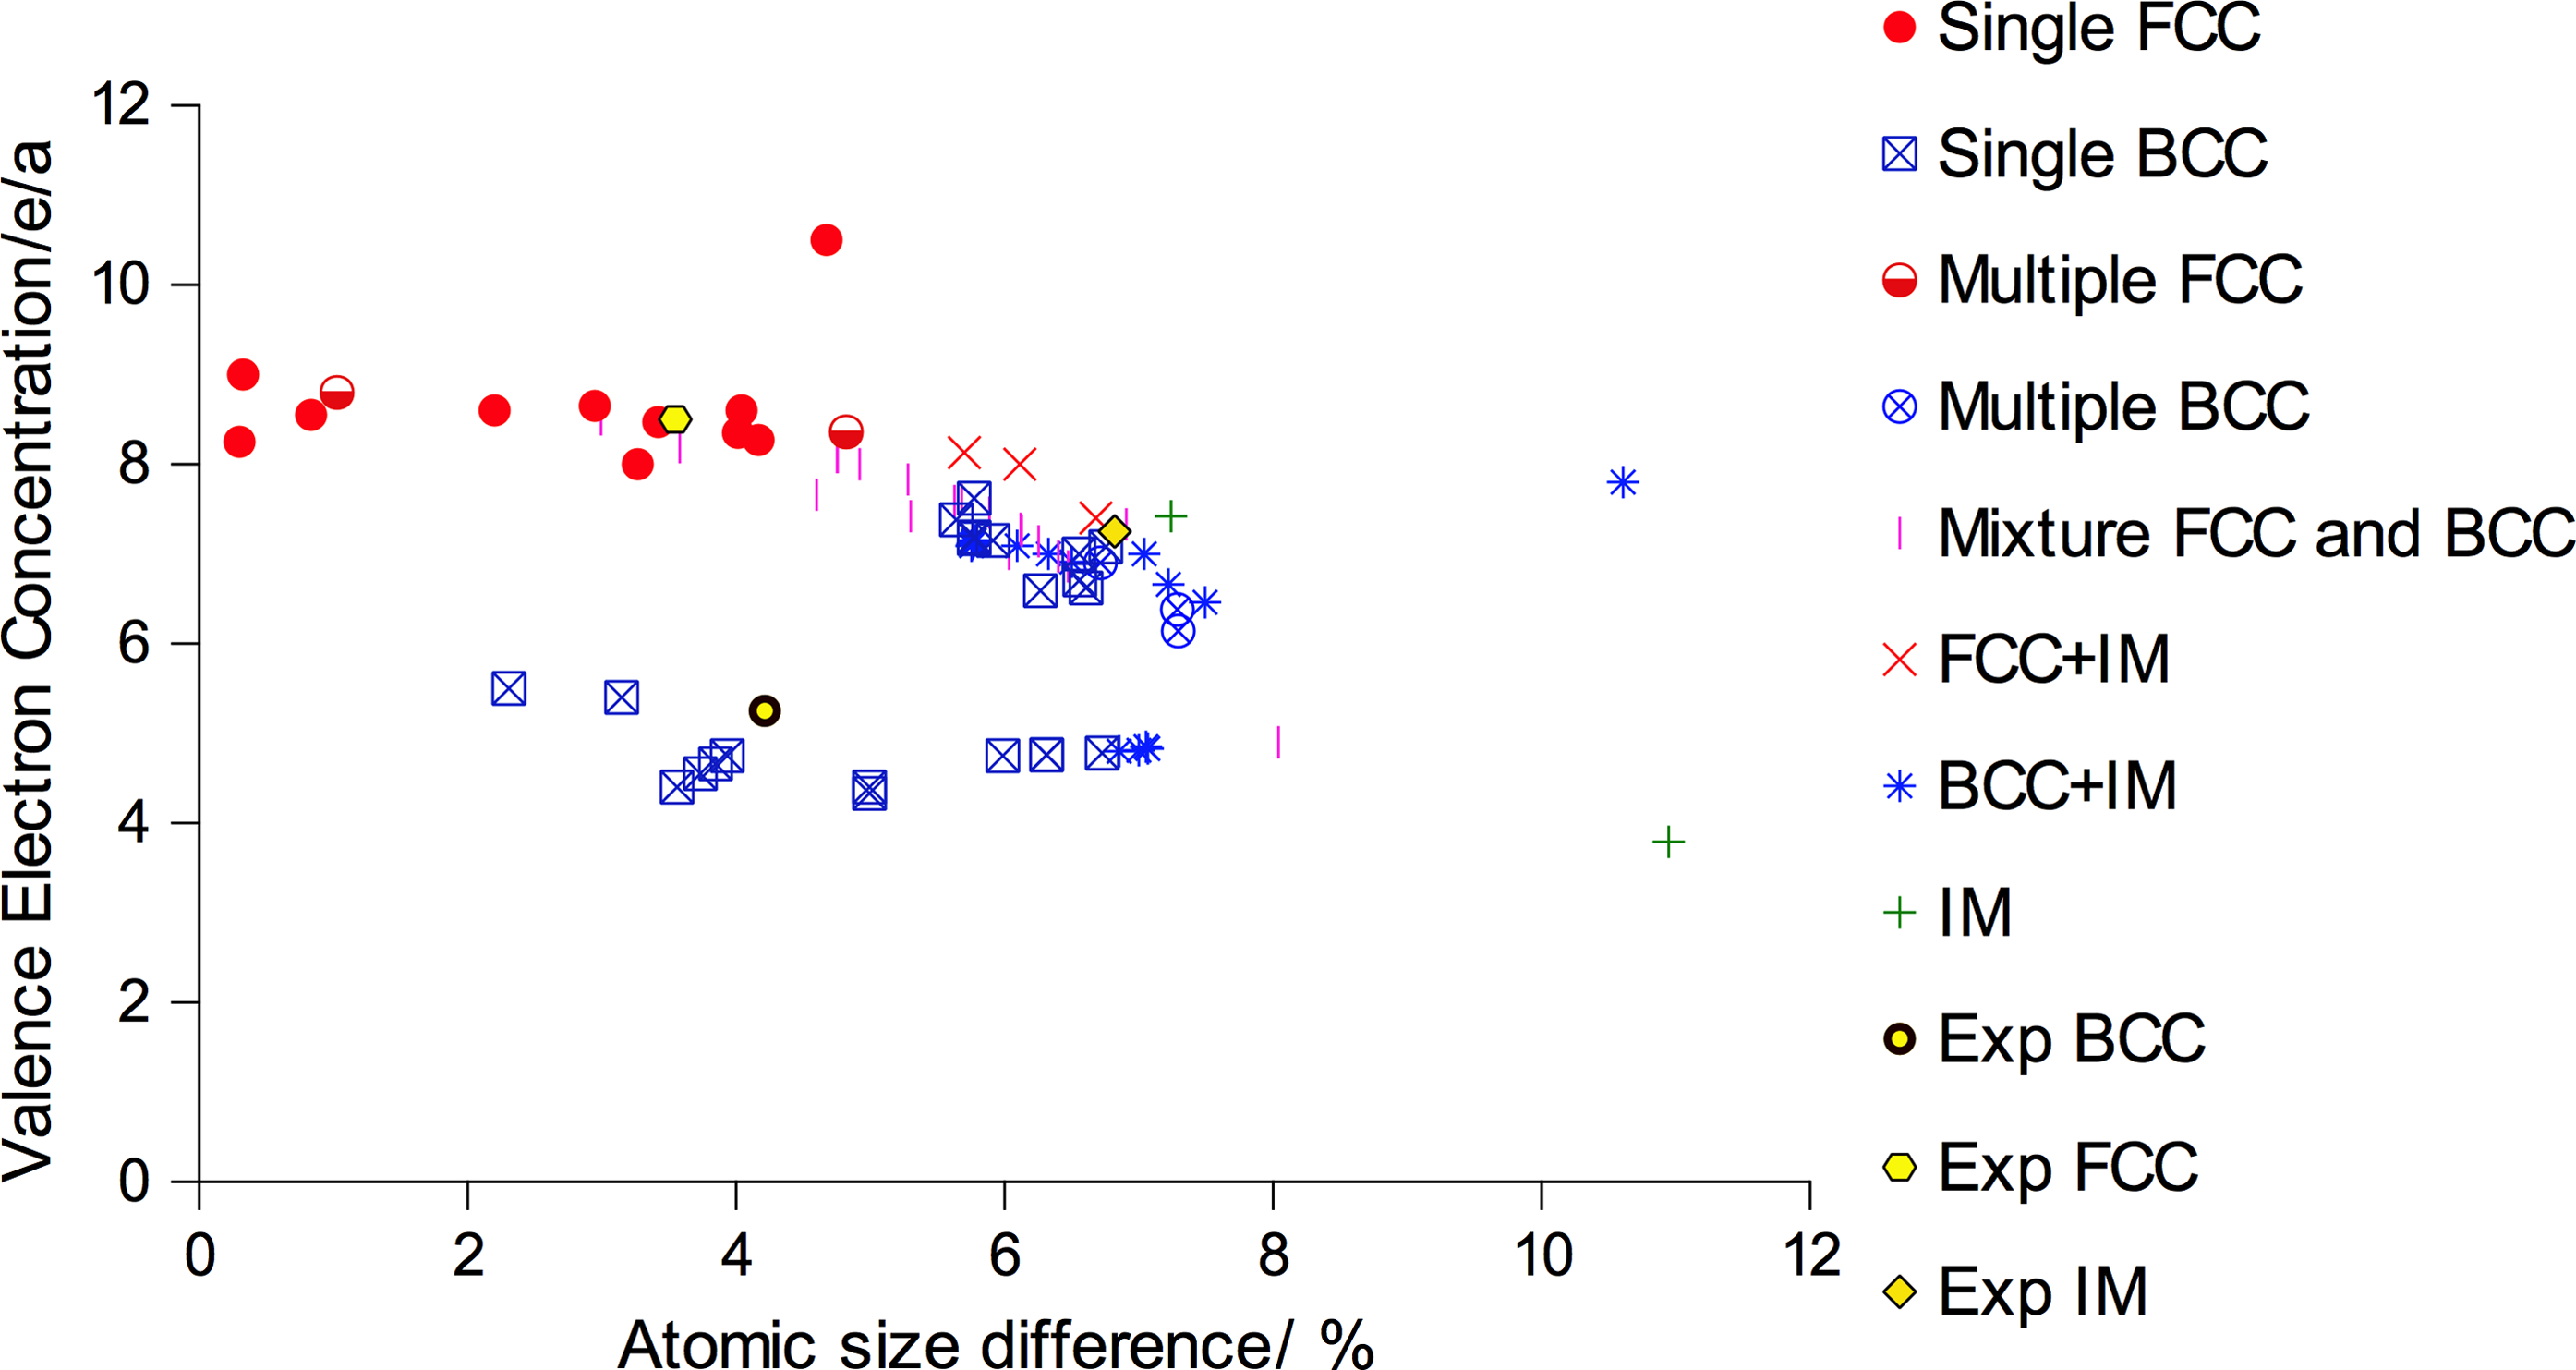
Correlation between parameters VEC and δ and formation of HEAs with different structures; this plot does not allow discrimination between fcc and bcc
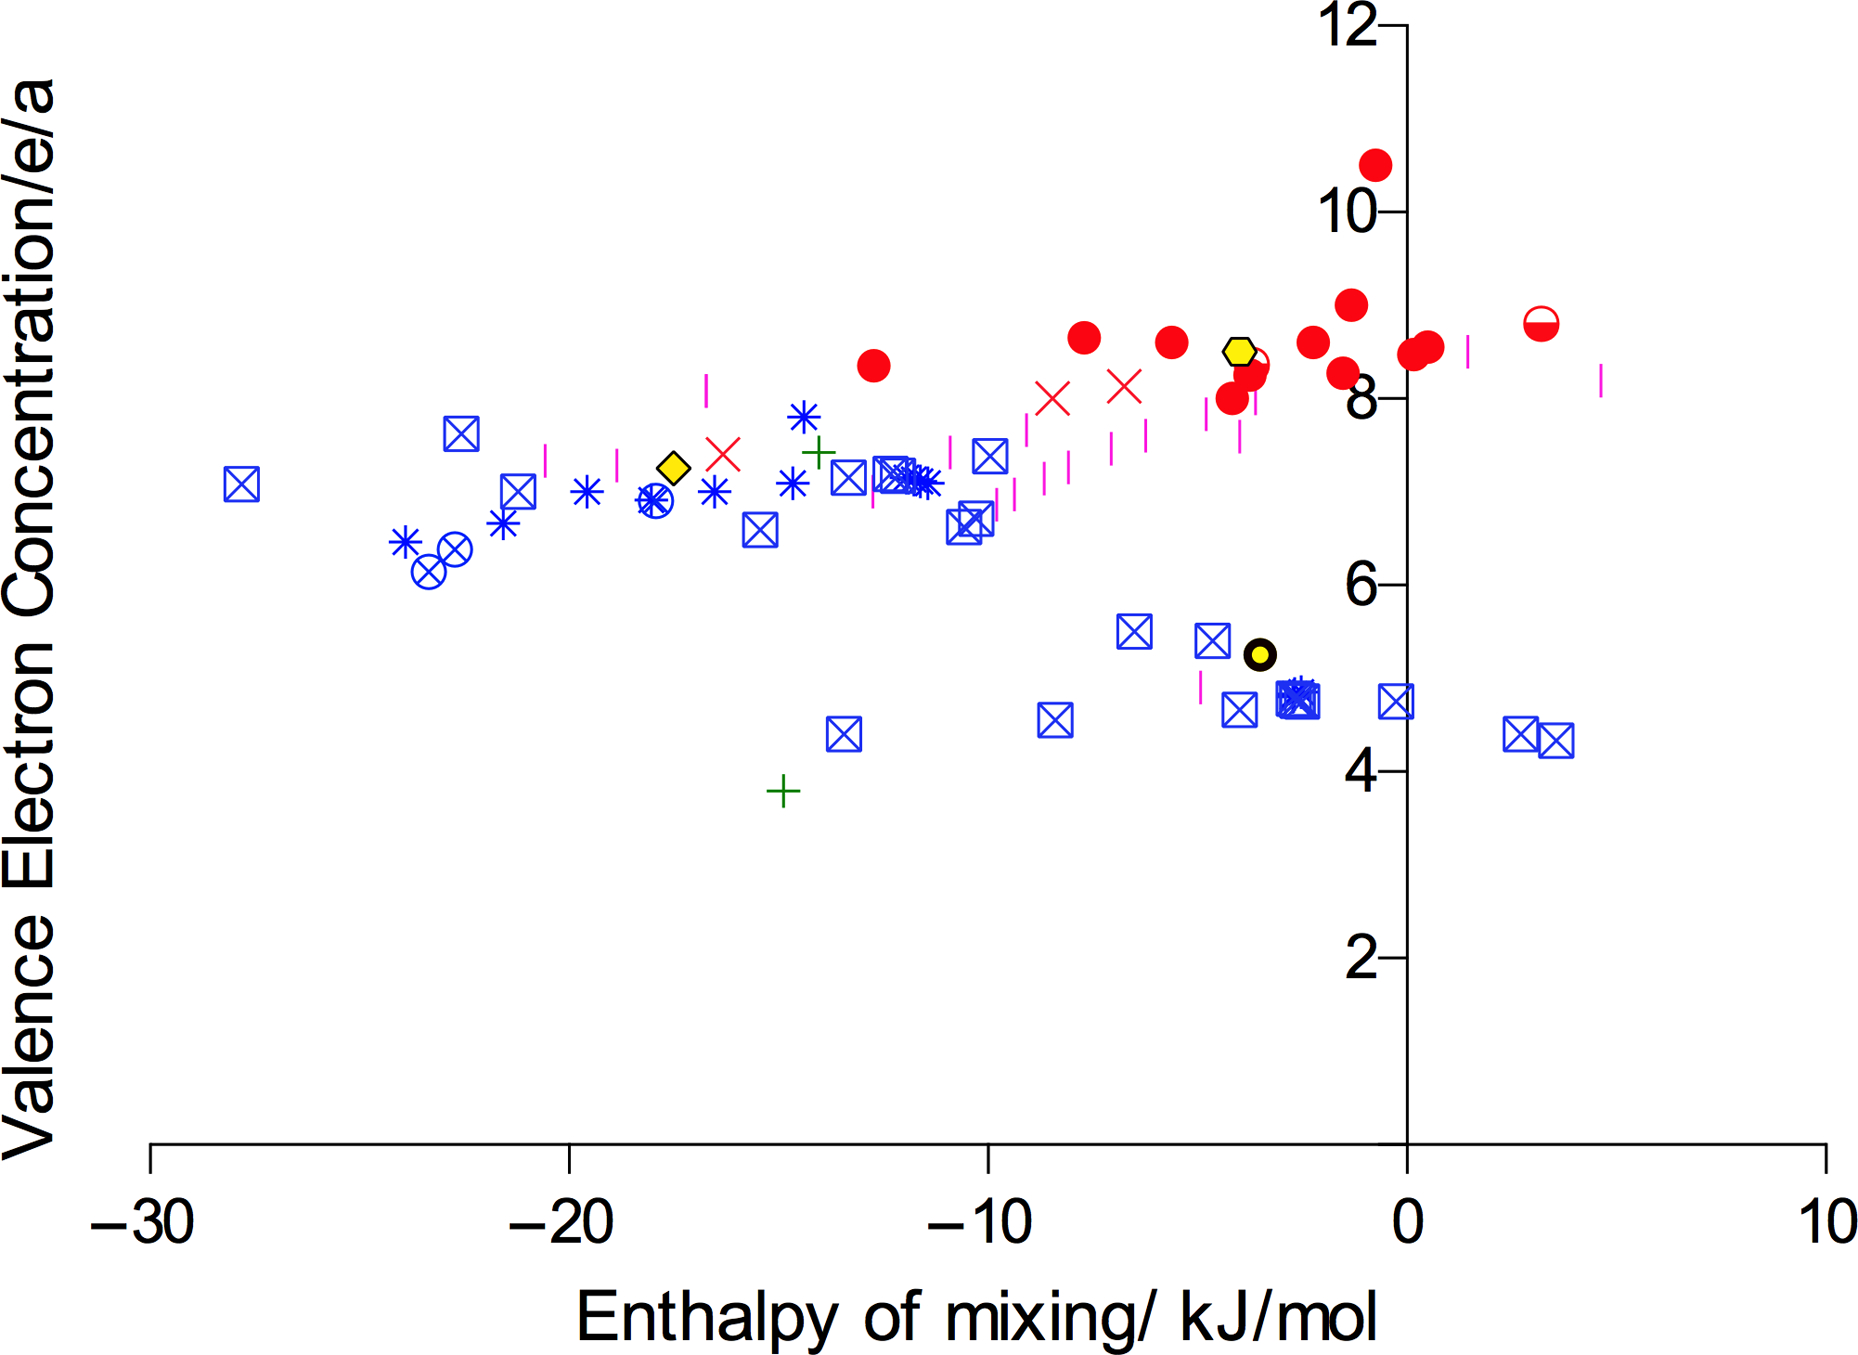
Correlation between parameters VEC and ΔHmix and formation of HEAs with different structures
VEC and δ are plotted against each other for the full data set in Fig. 2, with different symbols used to indicate the alloys that are reported to form intermetallics or multiple phases, single phase fcc and single phase bcc. These data show clear groupings of the structures in different regions of the plot. However, it is also clear that there are important variables affecting the behaviour that are not fully represented in this plot; the majority of the data points track an apparent curve, hinting at a more complex interrelationship between the parameters.
VEC against ΔHmix is shown in Fig. 3. This way of presenting the data does show almost entirely separated regions for intermetallic or multiphase alloys, and single phase fcc or single phase bcc. The separation between multiple and single phase appears to occur on the ΔHmix axis, while the VEC seems to influence the split between fcc and bcc structure, harking back to the ideas of Hume–Rothery. Importantly, this would appear to permit the design of HEAs, as both the VEC and ΔHmix can be calculated for a candidate alloy, and the location on the graph of the resultant point was evaluated to determine the structure.
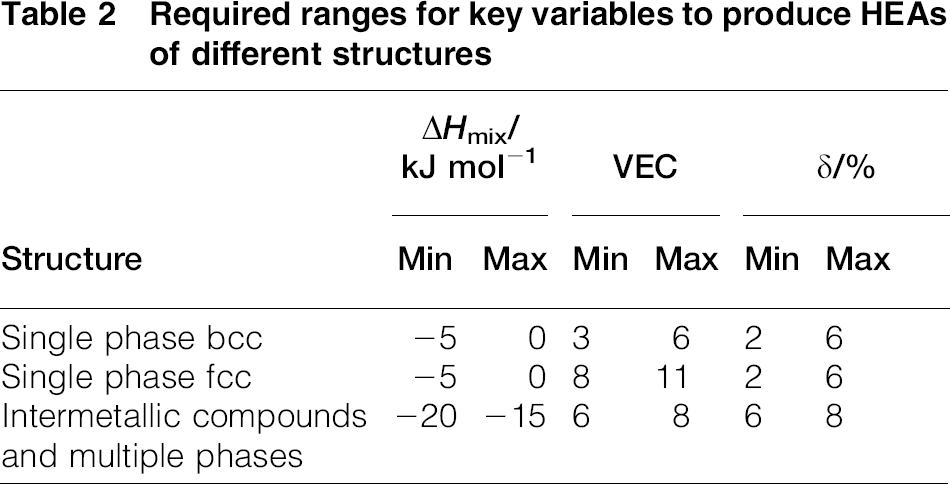
Taking both of these plots into account, ranges can be defined for each of the three parameters where the formation of different structures would be expected (Table 2) (note that these represent the ranges in which these structures are most likely to form without confusion with other structures, not the full extent of their observed envelopes). These ranges can form the basis of design of new alloys.
Required ranges for key variables to produce HEAs of different structures
To test these relationships, the novel alloy compositions were selected and designed so that their ΔHmix, δ and VEC values spread them across the plots in Figs. 2and 3, with each one falling in a different region. To fully challenge the predictive capabilities, the alloys were further all chosen to have four components (at equiatomic composition), as four component HEAs are particularly rare, and therefore challenging to predict, although the same approach would be expected to be successful for the prediction of HEAs composed of higher numbers of elements. After the predictions were made (values represented as yellow dots in Fig. 2), samples of each alloy were produced by arc melting and were examined using XRD and SEM (Figs. 4 and 5). Note that secondary electron images were observed but did not reveal any additional features to the backscattered images shown. These results show that the structures have formed as expected: TiMnFeNi is a mixture of phases, and MnFeCoNi and TiVMnNb are two novel four component fcc and bcc alloys respectively. According to the definitions that we have applied, the TiMnFeNi alloy would not be classed as a HEA, because it contains multiple phases, which are likely to be intermetallics, but MnFeCoNi and TiVMnNb may be as their constituent phases are both solid solutions and simple.
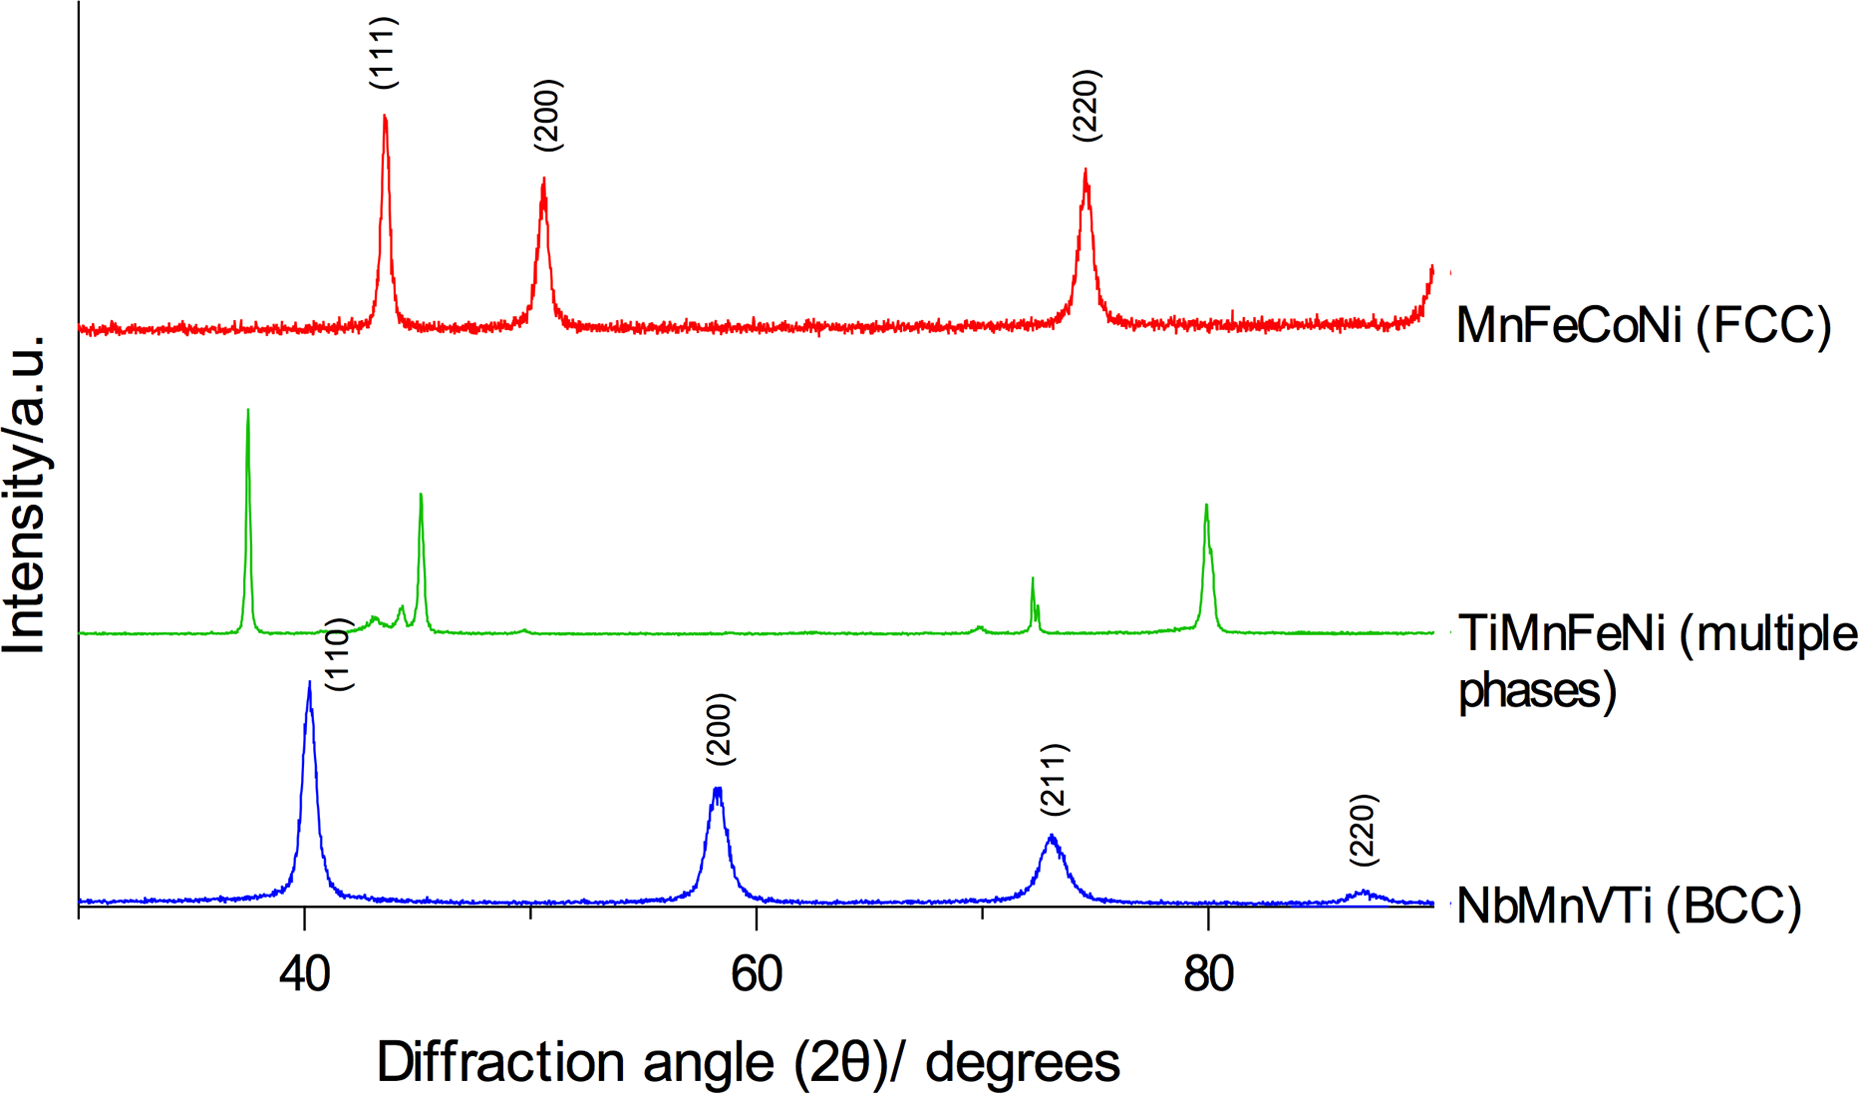
X-ray pattern θ–2θ scans for samples predicted to be multiphase, fcc and bcc: a TiMnFeNi (multiphase); b MnFeCoNi (fcc); c TiVMnNb (bcc)
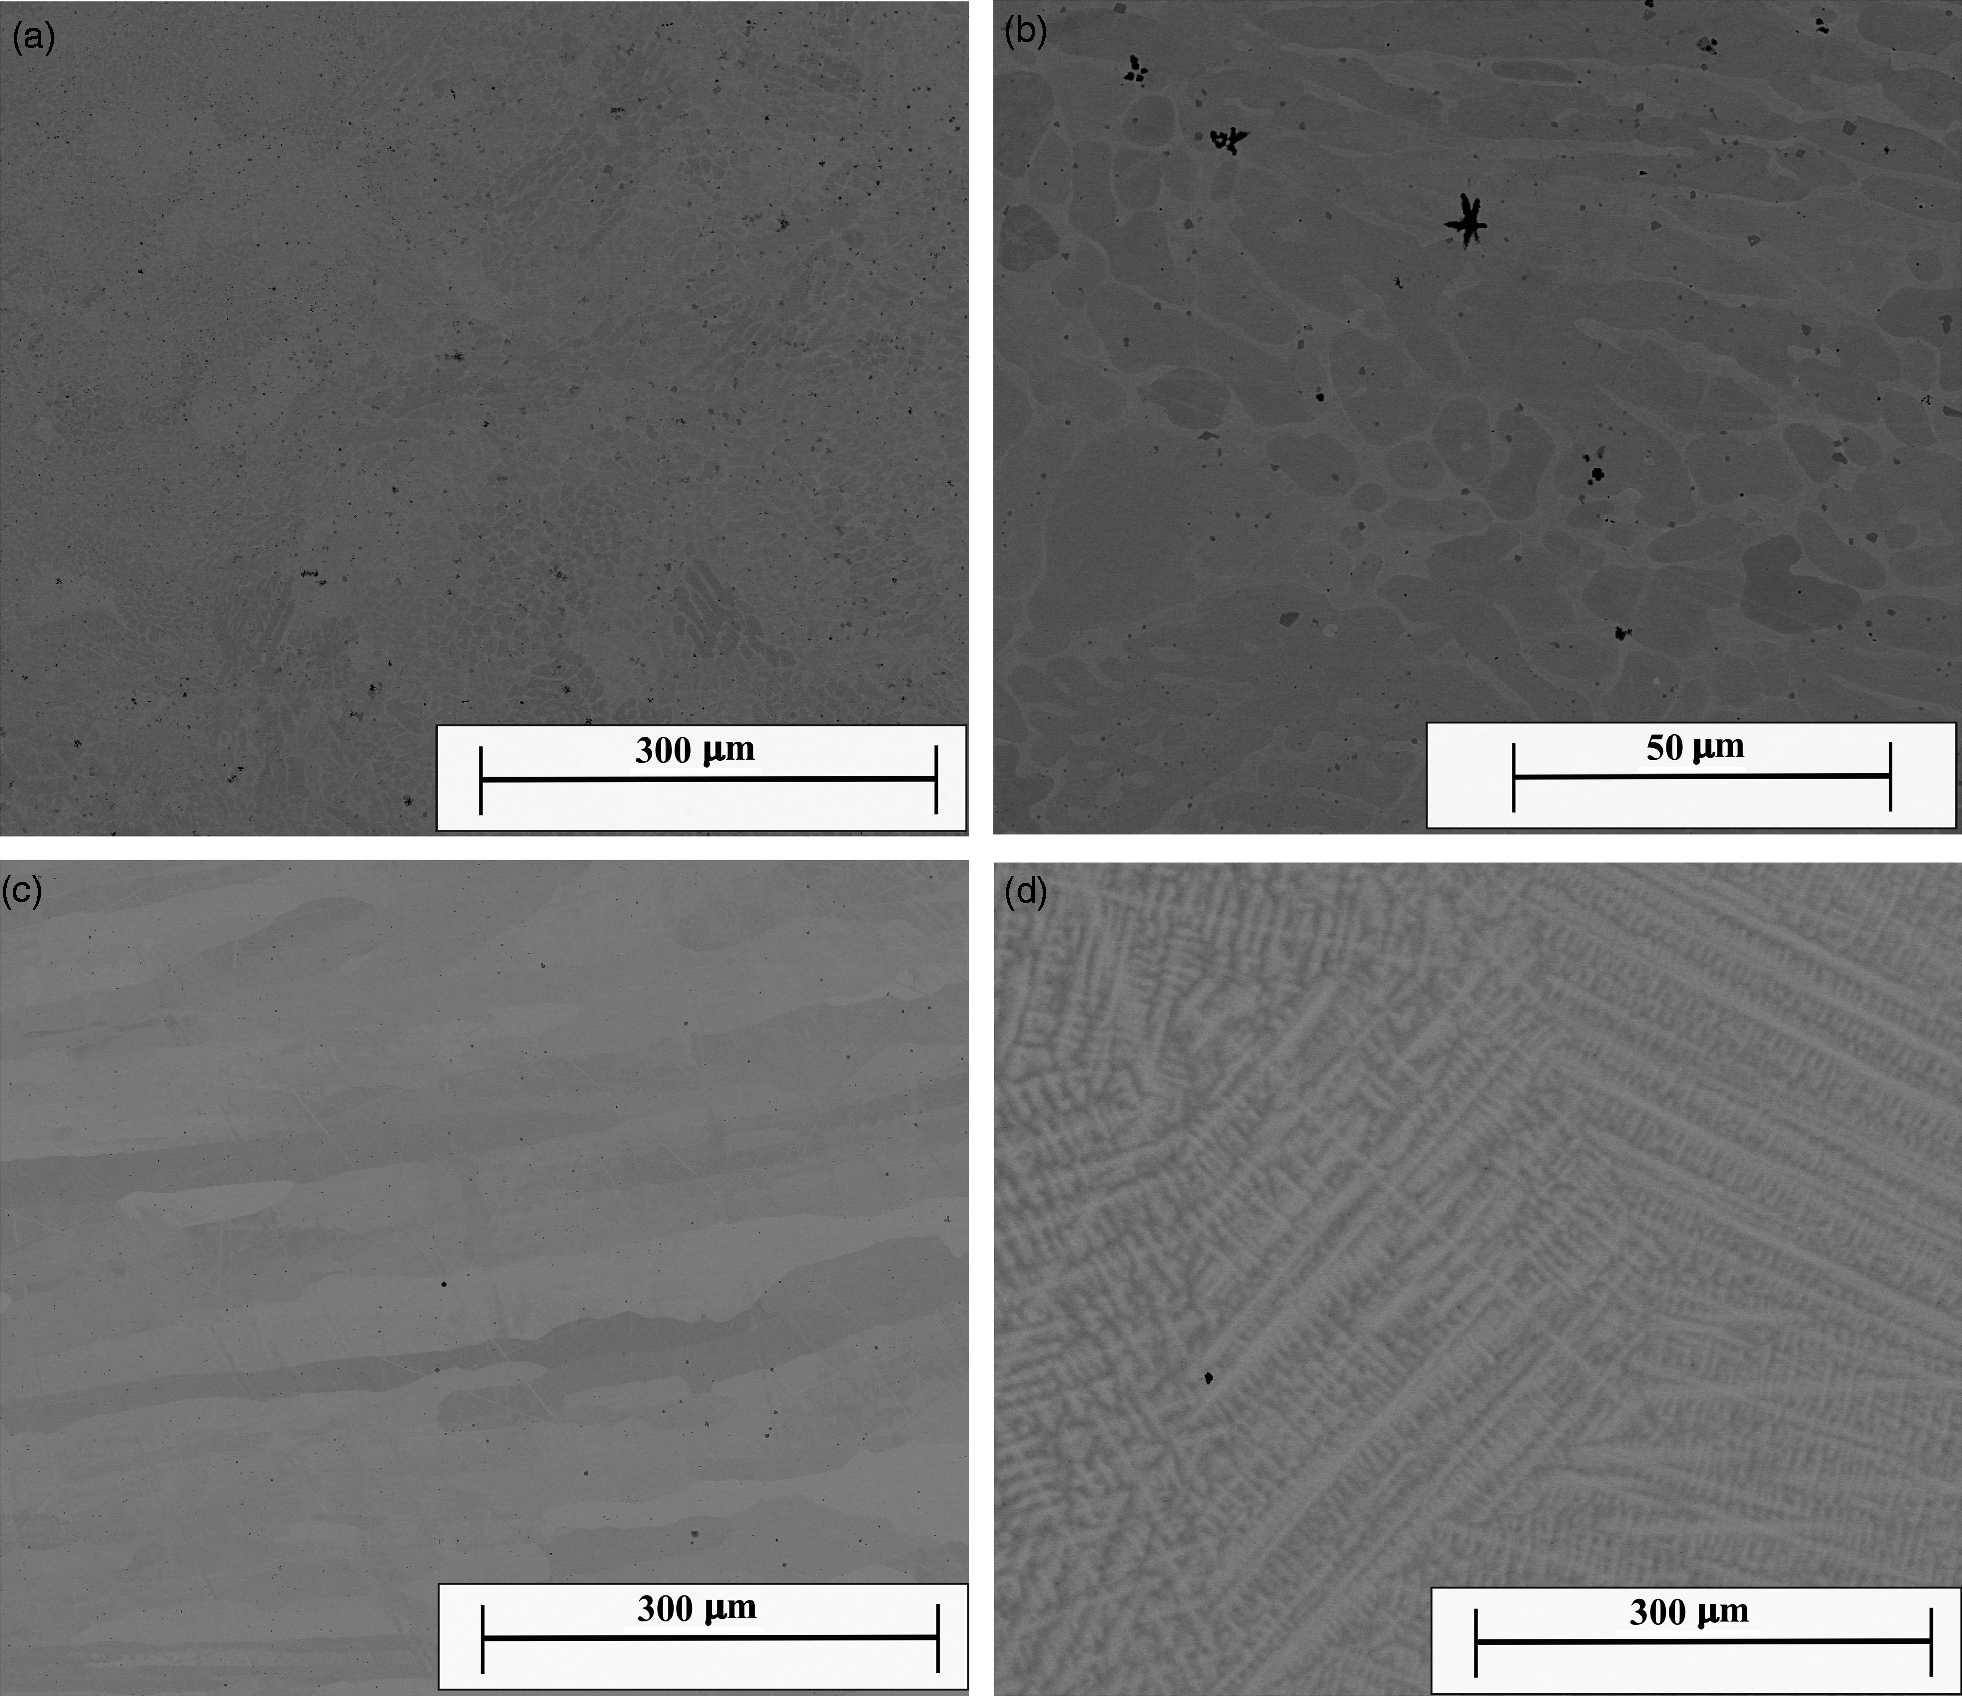
Backscattered images of a, b multiphase TiMnFeNi at low and high magnification respectively, c single fcc MnFeCoNi and d apparently single bcc TiVMnNb
The X-ray traces of the alloys show peaks consistent with the majority of the material being made up of the predicted phases (fcc for MnFeCoNi, bcc for TiVMnNb and mixed phases/intermetallics for TiMnFeNi). While these traces may not show if there are small amounts of other phases present, results of this type are usually taken as evidence of the formation of HEAs (it should be noted that recent work indicates that many HEAs thought to be single phase actually show segregation on a fine scale 11 ). The images shown in Fig. 4 are consistent with this view, with a multiphase structure shown by TiMnFeNi (shown in more detail in the high magnification image for clarify), a grain structure present in MnFeCoNi and interesting dendritic structure observed in TiVMnNb.
Examining the 110 X-ray peak for TiVMnNb and analysing the data more closely, Fig. 6 reveals that this is in fact a two-phase microstructure. The deconvolution shows the presence of two peaks, corresponding to two bcc phases with similar lattice parameters (∼3.14 and 3.15 Å). It is interesting to note that this type of microstructure (i.e. comprising two solid solutions with simple crystal structures) seems to be relatively common in multiprincipal components alloys, having been observed in Refs. 12 and 13, indicating that this may be an interesting area for future research.
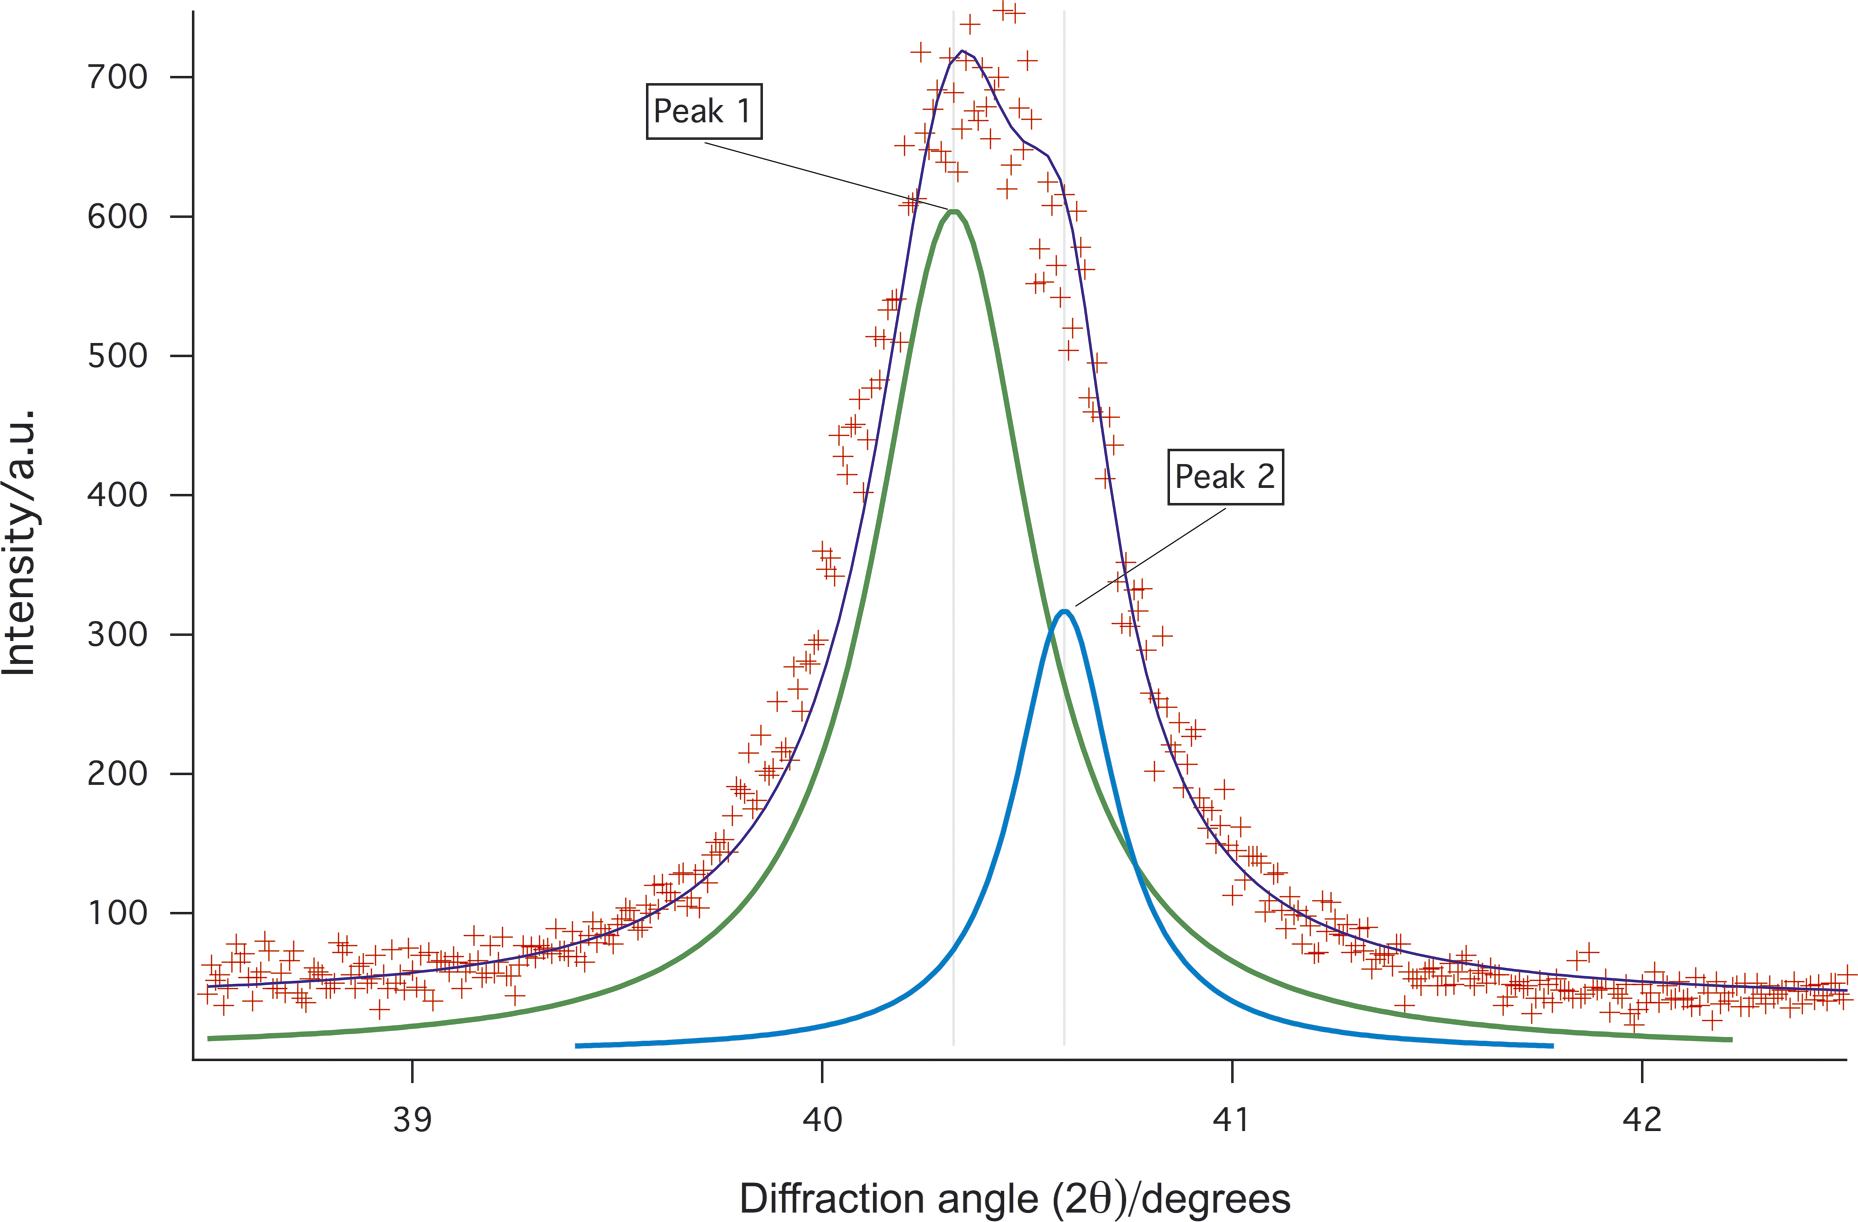
X-ray trace for sample predicted to be bcc (TiVMnNb) for diffraction angle between 38.5 and 42.5
The hardness data for the alloys show that the fcc structure has the lowest hardness with a value of 164.2 ± 12.4 HV, and the bcc with a value of 476.3 ± 16.5 HV is the next highest with the highest value occurring for the structure exhibiting multiple phases with a value of 751.5 ± 26.7 HV. This would be expected from the nature of dislocation motion in single and multiphase microstructures. 14 We note in passing that TiVMnNb, which shows a high hardness and bcc structure, would be predicted to show a high melting point. It could be an attractive material for applications in high temperature aggressive environments.
Conclusions
This work has performed PCA on a data set of HEAs for the first time. This has shown that while the previously introduced method of exploring the likely phase formation in these materials of plotting electronegativity against atomic size difference captures some of the variability, a greater amount can be expressed in plots of other parameters. In particular, when plotting the wider data set of multicomponent alloys, the structures formed resolve themselves with an unusually high degree of consistency into largely separate regions on a plot of VEC against enthalpy of mixing. The explicit consideration of entropy is not required in this approach.
Using this, a series of novel four component alloys are predicted with different structures, which on production are found to be consistent. While not giving a conclusive explanation for the reasons behind the formation of these phases, this work provides a simple to use tool for the prediction of HEA forming compositions of many types, which has so far proved accurate.
Acknowledgements
The authors wish to acknowledge financial support from the Accelerated Metallurgy Project, which is co-funded by the European Commission in the 7th Framework Programme (contract NMP4-LA-2011-263206), by the European Space Agency and by the individual partner organisations.