
Abstract
The different crack initiation modes from different internal defects of a high carbon chromium bearing steel are investigated in the present paper. The relative granular bright facet (GBF) size is approximately proportional to  . The critical applied stress intensity factor range at the periphery of inclusion ΔKinc,th, above which the GBF will no longer be formed, was obtained. For the present SUJ2 steel, ΔKinc,th = 8 MPa m1/2. The crack growth process in GBF is further investigated by the low–high two-step variable amplitude loading tests. The crack growth process in GBF can be described by
  . The exponent m0 is a material constant independent of the applied stress amplitude and the inclusion size and increases with increasing of HV.
List of symbols

the square root of the projected area of GBF on the fracture surface perpendicular to applied stress axis, μm m− 1

the square root of the projected area of inclusion on the fracture surface perpendicular to applied stress axis, μm m− 1
the coefficient in Paris law
constant amplitude loading
granular bright facet
Vickers’ hardness, kgf mm− 2
the applied stress intensity factor range at the periphery of inclusion, MPa m1/2
the critical applied stress intensity factor range at the periphery of inclusion, MPa m1/2
the exponent in Paris law
parameters in equation (6)
low–high two-step variable amplitude loading
parameters in equation (7)
Introduction
From a historical perspective, noteworthy engineering research on fatigue was initially carried out by A. Whöler who basically related the stress life to the asymptotic behaviour of some steels in the S–N curves in the 1860s. Some materials show a ‘fatigue limit’, but most other materials do not exhibit this behaviour; instead, they display a continuously decreasing of the stress life response, even at number of cycles longer than 107 cycles. 1 In the middle 1980s, Japanese researchers for the first time found that structural metal alloys could fail after 107 cycles, rather than exhibit an indefinite fatigue limit. 2 Since then, more and more researchers began to study the phenomenon of fatigue at high number of cycles not only for the interest in scientific research but also for industrial applications. In several industries, such as aeronautics, aerospace, high speed train, marine and ground transportation, there are several structural elements that are subjected to recurrent loads of high frequency and low amplitude, many times more than 108 cycles during their work duration.3,4 From this point of view, it becomes very urgent to investigate this specific fatigue phenomenon, which is called very high cycle fatigue (VHCF), 5 also called ultrahigh cycle fatigue, 6 ultralong life fatigue 7 or gigacycle fatigue. 1
As for VHCF of high strength steels, it is observed that the fatigue crack is often initiated from internal non-metallic inclusions. In the vicinity of a non-metallic inclusion at the fracture origin, a distinctive area can generally be observed. This area is termed as the ‘optically dark area’ by Murakami et al.,
8
the ‘fine granular area’ by Sakai et al.,
9
the ‘granular bright facet’ (GBF) by Shiozawa et al.,
10
the ‘rough surface area’ by Ochi et al.
11
and ‘facet’ (FCT) by Tanaka and Akiniwa.
12
In the present paper, the term ‘GBF’ is adopted. It is generally accepted that more than 90 of fatigue life is attributed to the creation of GBF, even up to 99.
13
In view of the significance of GBF, some researches have been conducted on the GBF morphology,8–12,14 the GBF size,15,16 the crack initiation and growth process in GBF17–20 and the formation mechanism of GBF.4,21–23 Some qualitative interpretations on the formation mechanism of GBF were proposed, i.e. ‘hydrogen embrittlement coupled with fatigue’ by Murakami et al.,
8
‘dispersive decohesion of spherical carbide’ by Shiozawa et al.,
22
‘polygonisation and microdebonding’ by Sakai,
4
‘microstructurally irreversible cycle strain’ by Mughrabi
21
and ‘continuous process of grain refinement and propagation’ by Grad et al.
23
The crack growth life in GBF, i.e. the initiation life from an inclusion, was predicted by several models. Paris et al. indirectly obtained the initiation life by integrating the Paris–Hertzberg–McClintoc k law, which demonstrated24,25 that the crack propagation life in the fish eye (a white circular area in the vicinity of the inclusion at the fracture surface observed by the optical microscope) was very small compared with the total life. Xue et al.
20
and Wagner et al.
26
determined the number of cycles to initiation by infrared thermography method, which also demonstrated that more than 90 of the total lifetime was associated with the initiation of the crack. The conventional Paris law, 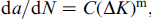 was also used to analyse the internal crack propagation rule in GBF in the vicinity of the inclusion and demonstrated that the Paris law was able to describe the crack growth in GBF preferably.12,27–29
In our previous paper, the crack propagation rule in GBF in the vicinity of internal inclusion of SUJ2 bearing steel was qualitatively investigated by low–high two-step variable amplitude loading (TSAL) tests. 30 It was demonstrated that the GBF crack at a given stress amplitude was formed at the early stage of fatigue life and that more than 90 fatigue life was spent in discrete crack growth inside GBF by experiments. The effect of inclusion size on crack growth in GBF was also analysed qualitatively. In this paper, the different crack initiation modes for different types of internal defects are investigated, and the relationship between fatigue life and the applied stress intensity factor range at the periphery of GBF ΔKGBF is analysed. In addition, the critical applied stress intensity factor range at the periphery of inclusion ΔKinc,th, above which GBF will no longer be formed, is also calculated. In the end, the crack growth rule in GBF will be further explored.
Materials and experiments
The experimental material in this study was JIS SUJ2 (equivalent to SAE 52100 or Chinese brand GCr15) high strength bearing steel of which the initial state was round bar with a diameter of 16 mm. The chemical compositions were as follows: 0.98C, 0.29Si, 0.36Mn, 1.60Cr, 0.10Cu, 0.057Ni, 0.0039Mo, 0.0039P, 0.003S, 0.017V and 0.9 × 10− 4H expressed as mass- (Fe balance). The raw round bars were rough machined into ultrasonic fatigue specimens with a certain machining allowances. Details of the heat treatment after rough machining are austenitising at 1133 K for 20 min, followed by directly air cooling and then tempering in 453 K for 120 min. The average Vickers hardness after heat treatment is 807 kgf mm− 2. Then, the rough machined specimens were fine machined into final dimensions after heat treatments. The final dimensions of the fatigue specimens are shown in Fig. 1.
Dimension of sample used in very high cycle fatigue testing
The ultrasonic fatigue testing was conducted on a Shimadzu USF-2000 testing system with a resonance frequency of 20 kHz, at a load ratio of R = − 1. All experiments were tested at room temperature in air for 150 ms in period of duty and pause alternatively. The fatigue specimens were cooled by compressive air during testing in order to keep the test specimens from overheating. S–N curve was taken up to 109 cycles, and all the fatigue crack origins were observed by a ZEISS-SUPRA55 field emission scanning electron microscope, and the chemical compositions of fatigue origins were ascertained by energy dispersive X-ray spectroscopy (EDX).
The crack growth process in GBF was qualitatively investigated by TSAL tests. The TSAL tests will be introduced in detail in the following. The specimens are first fatigued under a lower stress level, until it reaches a certain number of cycles and run out, then raise the stress amplitude to the secondary higher stress level (1020 MPa) and make the specimens failed in a short lifetime. As the secondary higher stress 1020 MPa, amplitude is mainly based on the fact that the fatigue crack is initiated from inner inclusion, and GBF is not formed in the vicinity of inclusion under 1020 MPa. The fatigue lifetime under the higher stress amplitude for TSAL specimens are usually < 106 cycles, which demonstrates again that the GBF is formed under the first lower stress level. If GBF was observed after TSAL tests, then it was considered that the GBF was formed under the lower stress level. The crack propagation rule in GBF will be obtained by repeating the above TSAL tests. The life consumed in GBF was approximately considered to be the total fatigue life during analysing the crack growth process in GBF, which was verified by many researches.1,3,12,17,28,30 In order to distinguish with TSAL, the constant amplitude loading is denoted by CAL in the present paper.
Experimental results
Fatigue crack initiation modes from different internal defects
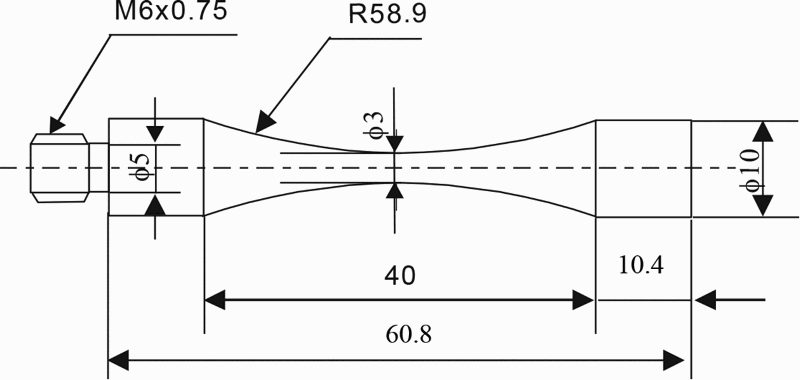
The tensile test was carried out on a WinWDW-300E machine, with a tensile strain rate of 10− s− 1. The ultimate tensile strength σb of this bearing steel is 1745 MPa, and the metallurgical structure after heat treatment is tempered martensite. The fatigue strength σW at 109 cycles determined by the staircase method is 765 ± 25 MPa. The fatigue ratio (σW/σb) is 0.44.
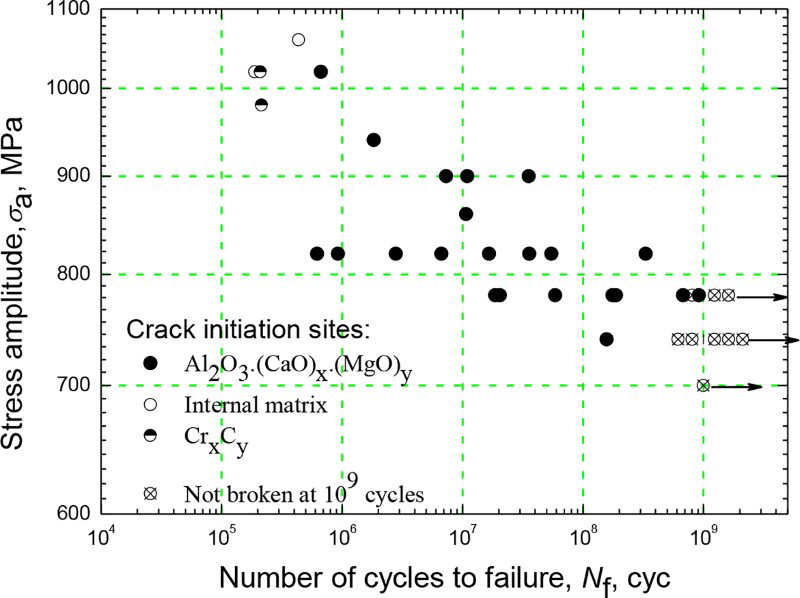
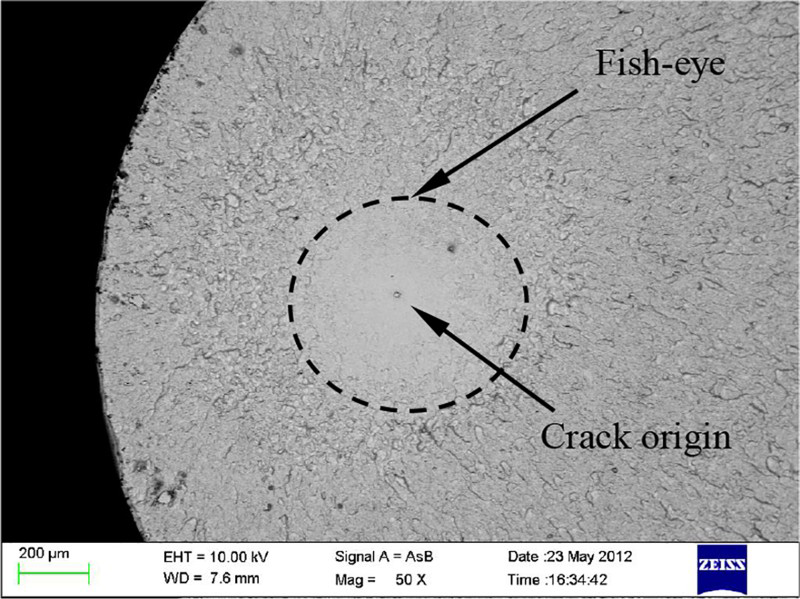
The S–N curve is shown in Fig. 2, which showed a continuous decline type. It was observed by field emission SEM that all the fatigue origins of TSAL and CAL specimens were inner defects. Fractographies at lower magnifications showed that all fish eye marks were clearly displayed (Fig. 3. The inner crack origins were observed at higher magnification, and the compositions of crack origins were analysed by EDX. The inner crack origins ascertained by EDX are classified into four types: the composite oxide of Ca, Al and Mg [Al2O3· (CaO)x·(MgO)y], the chromium carbide (CrxCy), the internal matrix and occasionally TiCN. Most origins at the fractures are Al2O3·(CaO)x·(MgO)y, the ratio of which is ∼82. Both sides of the fracture surface for the four types of origins are shown in Fig. 4, in order to analyse the different cracking modes. Figure 4a and b shows the fracture morphologies at both sides initiated from Al2O3·(CaO)x·(MgO)y (the fracture condition: σa = 780 MPa, Nf = 1.76 × 10⁸). It was shown that the inclusion only appeared on one side (Fig. 4a and that a cavity due to falling off of the inclusion appeared on the other side (Fig. 4b. Therefore, the fatigue crack was initiated from the interface between matrix and inclusion in the case of Al2O3·(CaO)x·(MgO)y. Figure 4c and d shows the fracture morphologies at both sides initiated from TiCN (the fracture condition: σa = 740 MPa, Nf = 5 × 10⁷ runout, σa = 1020 MPa, Nf = 5.57 × 10⁴). Similar to Al2O3·(CaO)x·(MgO)y, the TiCN only appeared on one side; therefore, the cracking mode for TiCN was the same as that for Al2O3·(CaO)x·(MgO)y. It was observed from Fig. 4c and d that the shape of TiCN with sharp angle was almost octahedra. A particular morphology area beside the TiCN was observed; this was the so called GBF by Shiozawa et al. 10 Compared with Fig. 4a and b, the boundary between GBF and crack growth morphology by pure fatigue was much sharper in Fig. 4c and d. This demonstrated that the GBF was formed at the first lower stress amplitude and verified that TSAL test was able to investigate the crack propagation in GBF. Figure 4e and f shows that the fracture morphologies at both sides initiated from CrxCy (the fracture condition: σa = 1020 MPa, Nf = 2.11 × 10⁵). Different with the cracking modes from TiCN and Al2O3·(CaO)x·(MgO)y, CrxCy appears at both sides of the fracture surface, which demonstrates that the fatigue crack is initiated from the cracking of CrxCy itself. This was in accordance with experimental results of Furuya et al. 31 Fig. 4g and h shows that the fracture morphologies at both sides initiated from the matrix (the fracture condition: σa = 1060 MPa, Nf = 4.35 × 10⁵). The compositions of the origin is ascertained by EDX, which shows that no other alloy elements are detected besides the matrix's compositions. The internal matrix origin was also named as ‘supergrain’. 19 The GBF beside the internal matrix origin is observed even in a short life, which will need a further investigation in the future.
S–N curve
Morphology of fish eye
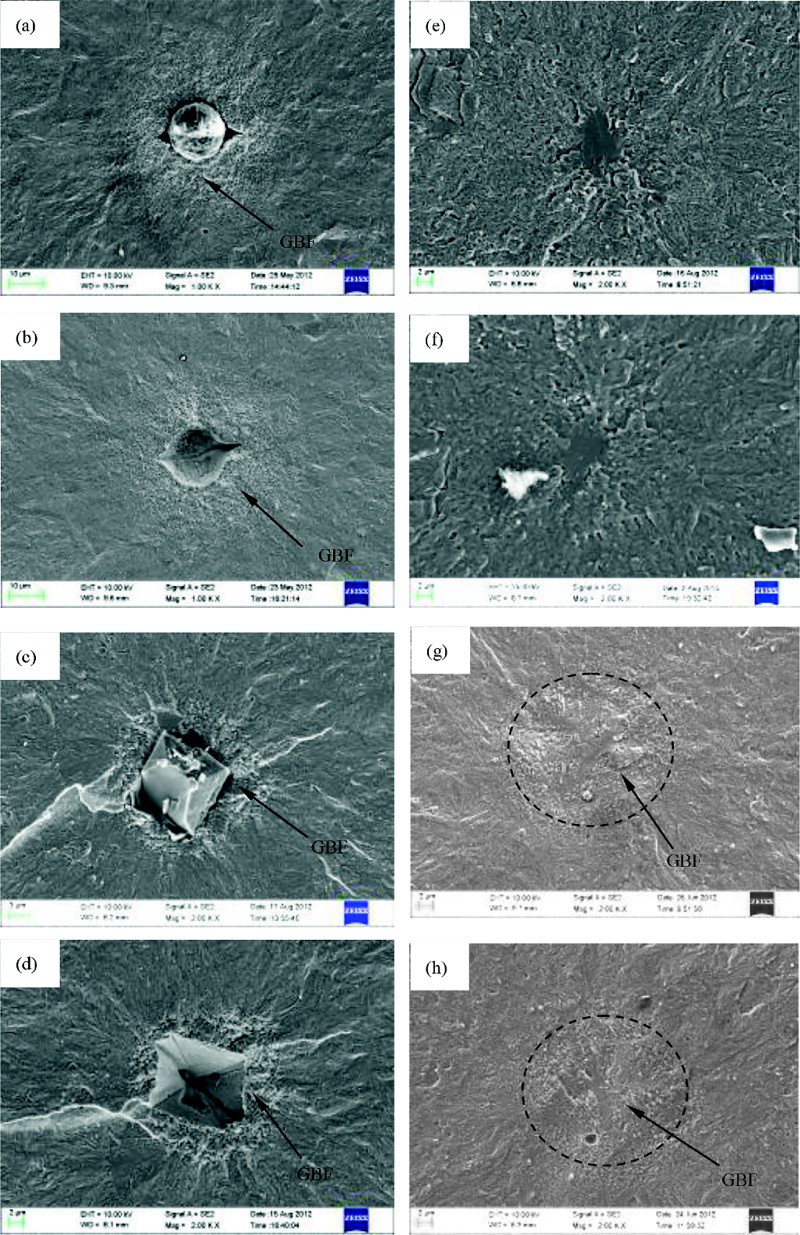
a, b pair of fractures in case of Al2O3.(CaO)x.(MgO)y as crack origin; c, d pair of fractures in case of TiCN as crack origin; e, f pair of fractures in case of Crx.Cy as crack origin; g, h pair of fractures in case of matrix as crack origin
Statistics of internal cracking origins
The inner defect size (including the four kinds of origins mentioned above) at the fracture surface was measured and analysed using statistics. The defect size (area)1/2, i.e. the square root of the projected area of the defect on the fracture surface perpendicular to applied stress axis, ranges from 5.8 to 48.2 μm, and the average size is 19.2 μm. Figure 5a shows the distribution of the defects (distance from specimen surface) at the fracture origins over the cross-section of specimens. It is shown that these defects are not uniformly distributed over the cross-section; instead, more crack initiation sites are located near the specimen surface. The inclusion at a fracture origin can be regarded as the largest inclusion in the test section of a specimen in the tension–compression fatigue test, so its size distribution over a number of specimens is expected to obey extreme value statistics (EVS).
32
In the present paper, the inclusion size [ , the square root of the projected area of inclusion on the fracture surface perpendicular to applied stress axis] and GBF size [
 , the square root of the projected area of inclusion on the fracture surface perpendicular to applied stress axis] were plotted on EVS probability paper according to EVS procedure, as seen in Fig. 5b. It is shown that both the inclusion and GBF at the fracture origin obeys EVS distribution. For N specimens, the return period T can be defined by T = N. Then, we can predict the maximum size of inclusion and GBF contained in N specimens. By predicting the maximum size of inclusion and GBF, the lower bound of fatigue limit can be obtained by Murakami's fatigue limit expression,
  (where HV is the Vickers’ hardness, in kgf mm− 2).
32
(where HV is the Vickers’ hardness, in kgf mm− 2).
32
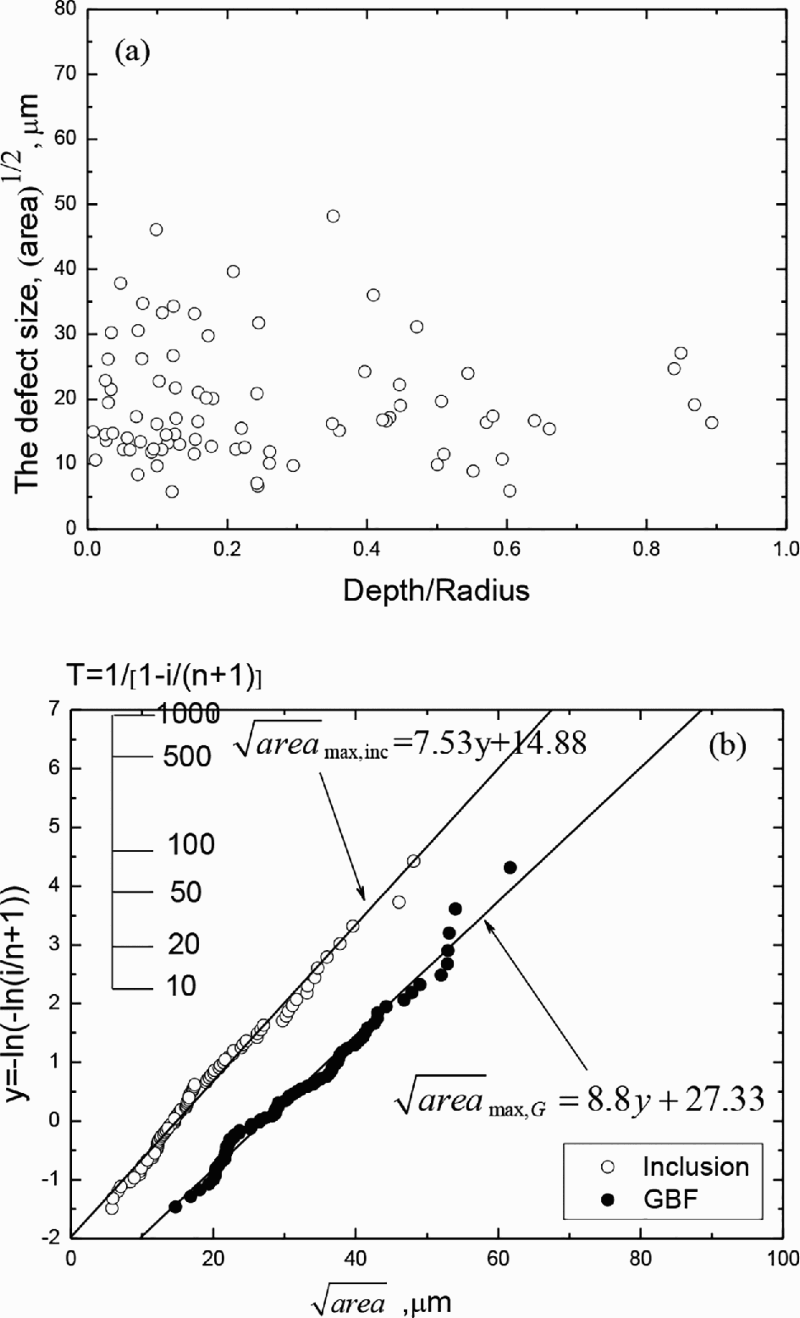
a relationship between inclusion size and inclusion location at fracture surface; b extreme value statistics for inclusion and GBF at fracture origin
Relationship between relative GBF size 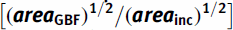 and applied stress intensity factor range at periphery of inclusion ΔKinc
As far as the fatigue crack emanating from inner inclusion is concerned, the applied stress intensity factor range at the periphery of inclusion ΔKinc can be calculated according to the area1/2 model by Murakami
32
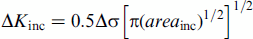
 is the inclusion size in m.
The previous researches demonstrate that ΔKinc decreases with increasing the fatigue life,4,11,12,28 and that the relative GBF size increases with increasing the fatigue life.
16
Nevertheless, the quantitative relationship between ΔKinc and the relative GBF size has not been investigated until now. In the present paper, the quantitative relationship between ΔKinc and  was investigated by analysing the present and others’ results.28,33–35
Yang et al. proposed the estimation equation of GBF size by considering the relationship between the plastic zone size in front of crack tip and crack growth rate; it reads as
28
 , expression 2 is rewritten as
 ], the following expression is obtained after rearrangement of expression 3)
 and
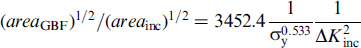
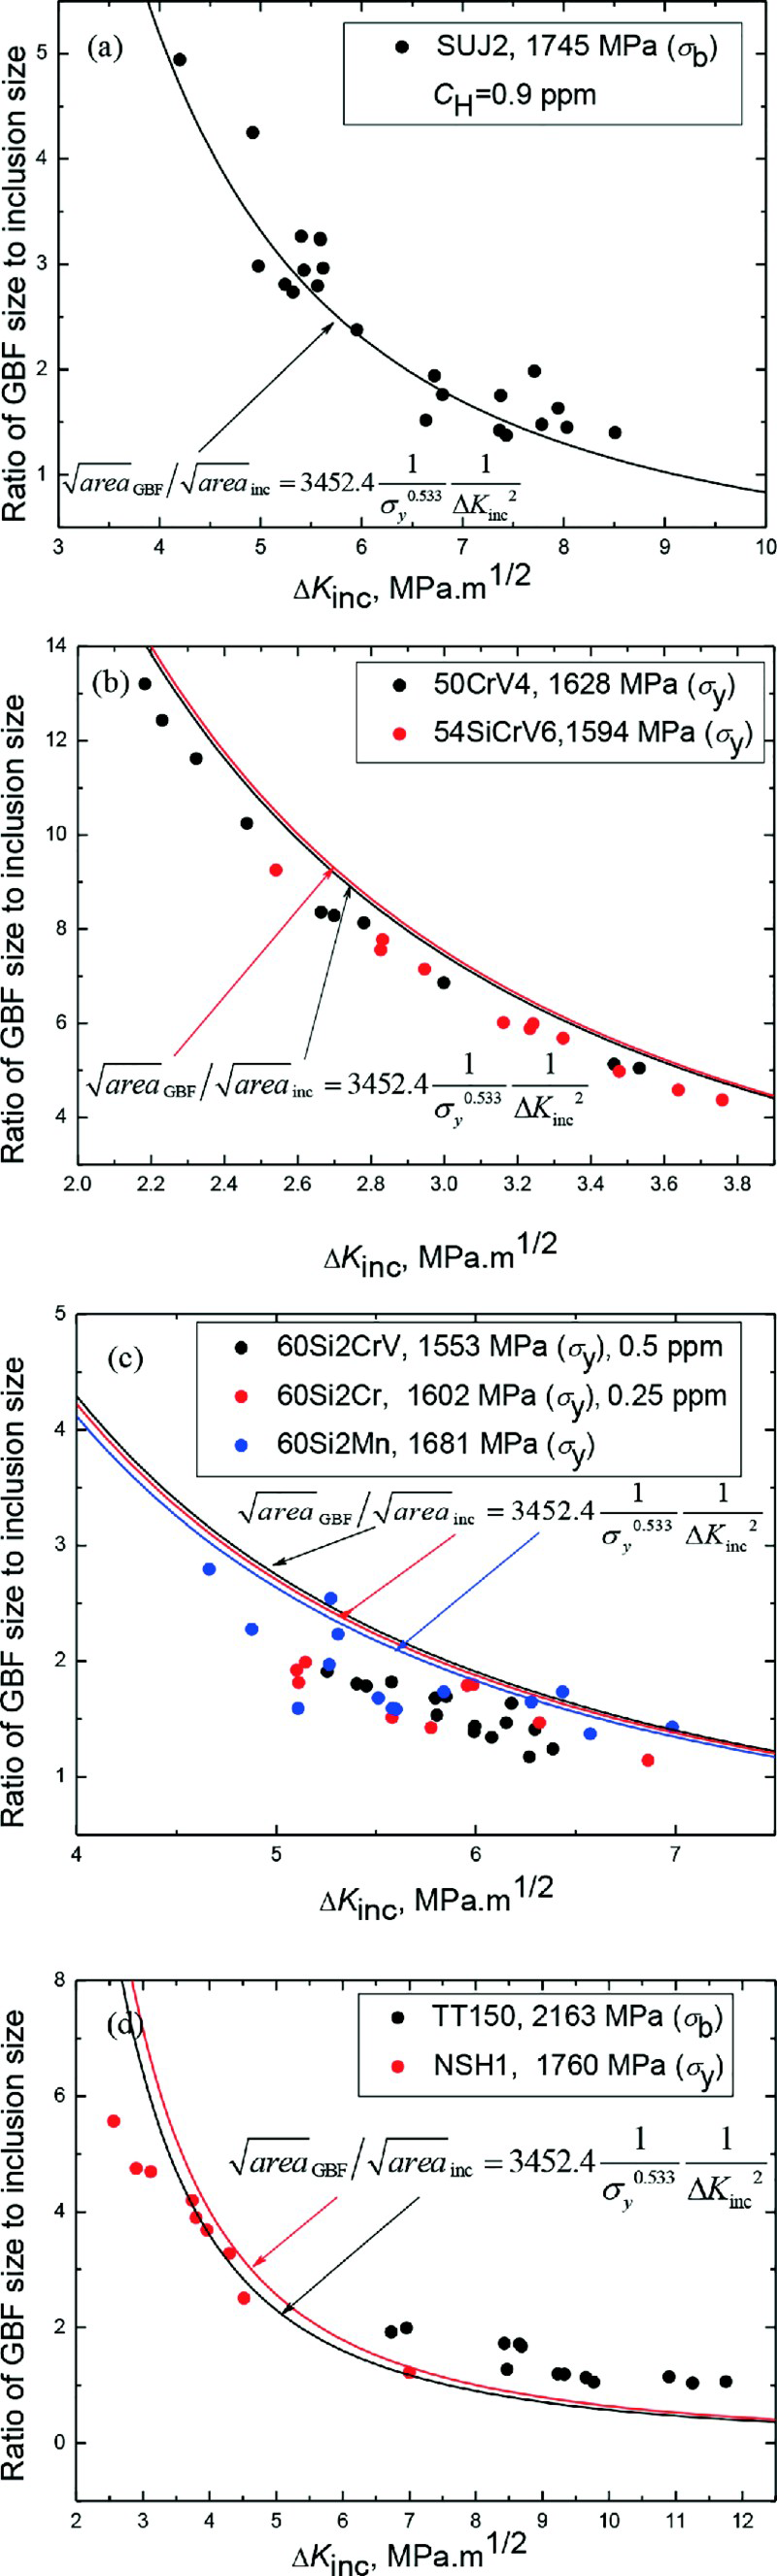
and  . Figure 6 shows the experimental results of the present work and others.28,33–35 It was demonstrated that the relative GBF size, which decreased with increasing ΔKinc, was approximately proportional to
  . The solid curves of different colours represent the corresponding fitted curves based on equation (4), which demonstrates that the experimental results preferably coincide to fitted curves according to equation (4). Thus, the reasonability of equation (4) is verified. The materials’ yield stress σy was not presented in some references; therefore, the ultimate tensile stress σb substituted for σy was used in the process of fitting equation (4). Actually as far as the high strength steels are concerned, the difference between σy and σb is not big in general. Sometimes, rupture even happens before yielding for some high strength steels (for example, the present SUJ2 steel). Therefore, in the present paper, σb was substituted into equation (4) for some high strength steels of which σy was not provided. All the experimental materials mentioned above were quenched and tempered high strength steels; the effect of hydrogen was not considered. However, actually, hydrogen had a major effect on GBF size of high strength steels in the VHCF regime, which had been reported in our previous work.
36
Therefore, the deviation between experimental results and fitted curves in Fig. 6 might be caused by different hydrogen content in materials (hydrogen contents of some materials are shown in Fig. 6). The influence of hydrogen on equation (4) will be discussed in the future work.
. The solid curves of different colours represent the corresponding fitted curves based on equation (4), which demonstrates that the experimental results preferably coincide to fitted curves according to equation (4). Thus, the reasonability of equation (4) is verified. The materials’ yield stress σy was not presented in some references; therefore, the ultimate tensile stress σb substituted for σy was used in the process of fitting equation (4). Actually as far as the high strength steels are concerned, the difference between σy and σb is not big in general. Sometimes, rupture even happens before yielding for some high strength steels (for example, the present SUJ2 steel). Therefore, in the present paper, σb was substituted into equation (4) for some high strength steels of which σy was not provided. All the experimental materials mentioned above were quenched and tempered high strength steels; the effect of hydrogen was not considered. However, actually, hydrogen had a major effect on GBF size of high strength steels in the VHCF regime, which had been reported in our previous work.
36
Therefore, the deviation between experimental results and fitted curves in Fig. 6 might be caused by different hydrogen content in materials (hydrogen contents of some materials are shown in Fig. 6). The influence of hydrogen on equation (4) will be discussed in the future work.
Another important conclusion can be drawn from equation (4). When ΔKinc2 = 3452.4/ ,
,  , i.e. the fatigue crack would be directly emanated from inclusion rather than from GBF. Substitution σb of the present SUJ2 steel (substituted for σy) into ΔKinc2 = 3452.4/
 , the critical applied stress intensity factor range at the periphery of inclusion ΔKinc,th, above which GBF will no longer be formed, can be calculated (ΔKinc,th = 8 MPa m1/2). The relationship between inclusion size and ΔKinc is illustrated in Fig. 7. It was shown that the GBF was not formed when ΔKinc was bigger than 8 MPa m1/2, which verified the rationality of equation (4).
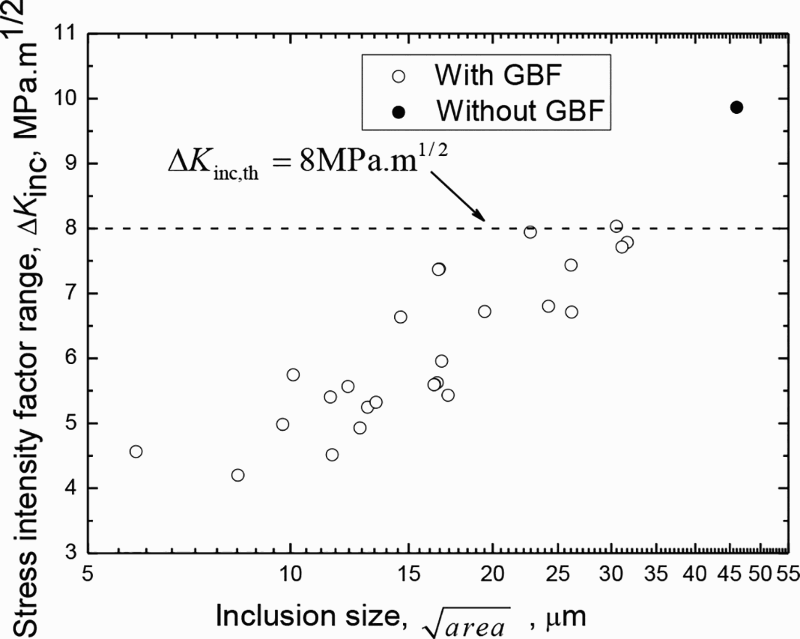
Relationship between inclusion size and ΔKinc
Discussion
Crack growth process in GBF
The fatigue life consumed in GBF is considered nearly as the total fatigue life for specimens with longer life ( ≥ 1 × 10⁷). In our previous work, the crack growth process in GBF was qualitatively investigated by TSAL method. 30 The detailed TSAL tests were introduced in the last paragraph in the section on ‘Materials and experiments’. The crack growth process under different stress levels is shown in Fig. 8. It was found that the inclusion size at the fracture origin had an important effect on crack growth in GBF. After classifying the inclusions at the origins according to the sizes, the crack growth process in GBF was clear. The final fatigue life and GBF size were ascertained by fatigue tests of CAL specimens at the first lower stress amplitude. It was found that the GBF crack at a given stress amplitude was formed at the early stage of fatigue life and that more than 90 fatigue life was spent in discrete crack growth inside GBF. After this, the GBF crack grew rapidly to the ultimate GBF size in a short time. The black solid lines represent the schematic diagrams for fatigue crack growth in GBF from the inclusions with different sizes. The detailed experiments and interpretations for crack growth process in GBF were reported in our previous work. 30
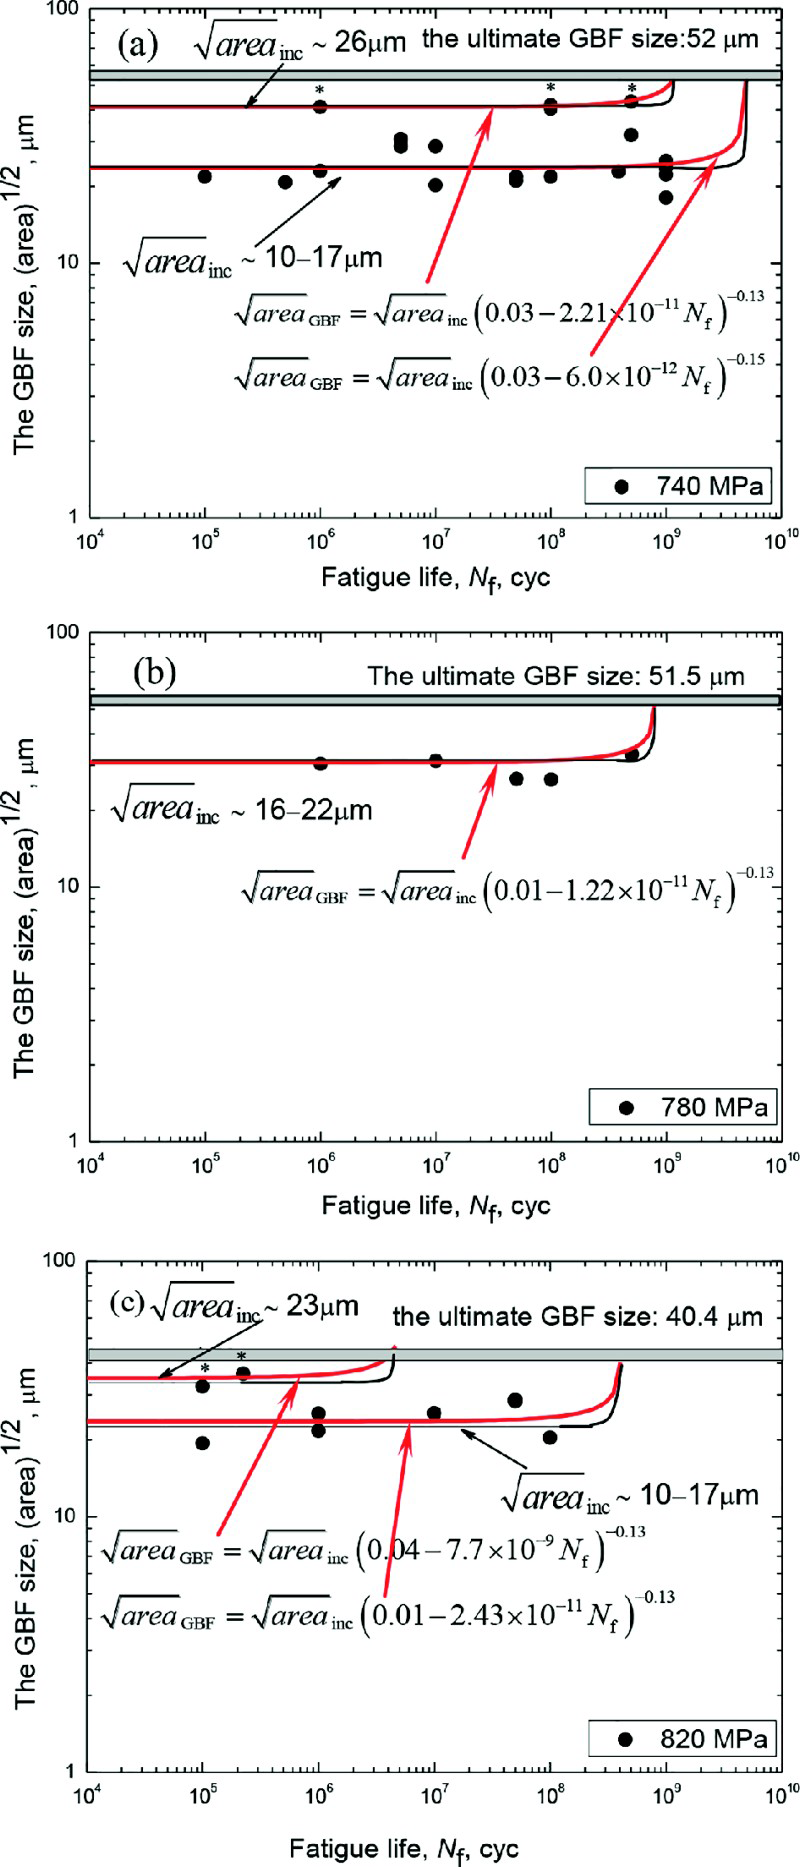
a 820 MPa; b 780 MPa; c 740 MPa
In the present work, the crack growth process from the inclusions with different sizes under different stress levels were fitted based on the experimental results. The fitted equations were displayed by a red colour curves in Fig. 8. It is shown that the fitted curves are in good agreement with the experimental results. The fitted curves are in the form of composite power function.
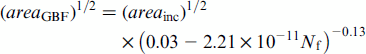
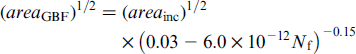
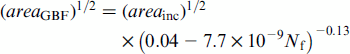
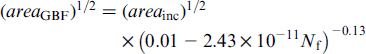
The fitted equations for different initial inclusion sizes [26 μm and 10–17 μm (the average size is 14 μm)] under 740 MPa are as follows:
(26 μm, 740 MPa)
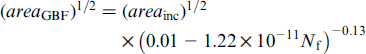
(17 μm, 780 MPa)
(23 μm, 820 MPa)
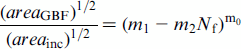
After rearrangement of equation (6), we get
 and
and  . Owing to 0 ≤ m1 ≤ 1 and m0 < 0; thus,
  . A conclusion can be drawn based on the above analysis. The crack growth rule in GBF is in accordance with the composite power function equation in the form of equation (7), and the initial inclusion size plays an important role in crack growth in GBF.
Tanaka et al. analysed the fatigue crack propagation inside GBF by the Paris law, 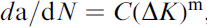 , and obtained the following expression by integrating the Paris law12,27
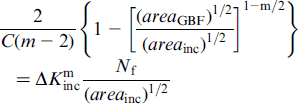
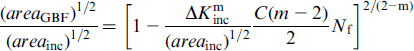
 . It was shown in Fig. 8 that the present experimental results can be preferably described by equation (7); therefore, the Paris law might need to be modified when being applied to analyse the crack growth inside GBF. Much more investigations on the parameters in equation (7) would be needed.
In the work by Tanaka et al., the exponent in the Paris law m was gained by fitting the results of SUJ2 steel (777 HV), m = 14.2.12,27 Then, the value of 2/2 − m in equation (9), which was corresponding to m0 in equation (7), was − 0.16, which was smaller than − 0.13 in the present work (807 HV). In the previous work in our group, the exponent in the Paris law m of 60Si2CrV steel (565HV) was obtained, m = 13.54. 37 Then, the value of 2/2 − m in equation (9) was − 0.17, which was also smaller than − 0.13 in the present work. Thus, it can be seen that the exponent in equation (7) m0 is a constant for one material and only related to the material's intrinsic property. It seems from the three groups of data that m0 increases with increasing of HV, i.e. the exponent in the Paris law m increases with increasing HV.
It was generally accepted that hydrogen played an important role in forming of GBF in the VHCF regime.7,8,15 In the present work, the same batch of specimens with the approximate hydrogen contents were chosen to investigate the crack growth in GBF in order to eliminate the influence of hydrogen as far as possible. However, the hydrogen contents trapped by the inclusions at the crack origins in different specimens might also be different. Therefore, the data scatter in Fig. 8 at the same stress level and inclusion size was supposed to be caused by different hydrogen contents in the vicinity of inclusions. The crack growth in GBF after considering the effect of hydrogen will be discussed in further work.
Conclusions
The crack initiation modes are different for different inner defects. The fatigue crack is initiated from the interface between matrix and inclusion in the case of Al2O3·(CaO)x·(MgO)y and TiCN, and the fatigue crack is induced by the cracking of the inclusion itself in the case of CrxCy.
The relative GBF size, which is approximately proportional to  , decreases with increasing ΔKinc. The critical applied stress intensity factor range at the periphery of inclusion ΔKinc,th, above which GBF will no longer be formed, is obtained. For the present SUJ2 steel, ΔKinc,th = 8 MPa m1/2, which is verified by the experimental results.
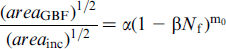
The crack growth process in GBF can be described by  , the form of which is similar to the deduced equation based on the Paris law. The exponent m0 is a material constant, which is independent of the applied stress amplitude as well as the inclusion size and increases with increasing HV.
Footnotes
Acknowledgements
The present work was financially supported by the National Natural Science Foundation of China (grant no. 51101094) and Science and Technology Project of Hebei Province (grant no. 13211035).