
Abstract
Axial loading test was performed to investigate the S–N characteristics and the failure mechanisms of a high carbon chromium bearing steel under very high cycle fatigue (VHCF). Compared with the experimental results under rotating bending, the bearing steel under axial loading also exhibited two failure modes including surface failure and interior inclusion-induced failure. In the life regime beyond about 106 cycles, the fine granular area can occur around the inclusion. But under the axial loading with the uniform stress distribution on the cross-section of specimen, the duplex S–N characteristics of bearing steel was not so distinct. In view of the limitation of common statistical method, a statistical method based on mixed Weibull distribution and parameter optimisation was proposed to evaluate the VHCF property of bearing steel corresponding to two failure modes. Based on the proposed statistical method, the P–S–N curves of bearing steel under axial loading can be better established.
Keywords
Introduction
In consideration of current economy and environment, more and more mechanical parts and components have to endure for a long-term up to 109–1010 loading cycles beyond their original design lives very much. Moreover, studies have shown that the unexpected failures still can occur in very high cycle fatigue (VHCF) regime larger than 107 cycles, though the parts and components are made of ferrous metals that are assumed to have a distinct fatigue limit.1–3 The conventional fatigue design concepts or methods based on high cycle fatigue are not meeting the safety requirement of current engineering technology, the study on VHCF properties of structural materials has become an important and active subject to ensure the long-term safety of the actual parts and components.4–6
Bearing steels are one of the most important structural materials for the manufacturing of bearing rings and rolling elements due to good fatigue resistance and long service life. However, it should be noted that there is no infinite fatigue life in bearing steels. In other words, the VHCF failure has been a typical feature of bearing steels, and no obvious fatigue limit can be observed.3,7–14 Furthermore, this failure is often accompanied with a change of failure mechanism from surface to interior. Just because of the change from surface to interior, bearing steels can represent peculiar S–N characteristics in the VHCF regime, i.e. the so-called ‘duplex S–N curve characteristics’ or ‘stepwise S–N curve characteristic’.15,16 Under this circumstance, maybe the traditional logarithmic normal or Weibull distribution function is not suitable to evaluate the distribution characteristics of test data corresponding to multiple failure modes. 17 As a result, this is growing demand for new statistical methods safely served in the VHCF regime.
In this study, the VHCF properties of a high carbon chromium bearing steel under axial loading was investigated. Based on the analysis of S–N characteristics, loading condition and failure mechanisms, a new statistical method based on the mixed Weibull distribution and the parameter optimisation was proposed to evaluate the fatigue life distribution characteristics with two failure modes, and on this basis the P–S–N curves were established.
Material and specimen
Material investigated in this study is a high carbon chromium bearing steel (JIS: SUJ2), and its chemical composition is presented in Table 1. From the annealed material, the raw specimens were machined into the hourglass-shape with a certain amount of finishing margin, and then quenched at 835°C × 40 minutes + oil cooling and tempered at 180°C×120 minutes + air cooling. After heat treatment, the surface of specimen was grinded in the direction of parallel to the axis of specimen by using a grinder of #100 to the final shape shown in Fig. 1. For the round-notched surfaces of specimens, the expected value of average roughness, Ra, is not more than 0.32. The minimum diameter and the round-notched radius of specimen are 3 and 15 mm, respectively. Based on Person's handbook,
18
the stress concentration factor of specimen is evaluated to be 1.04. The hardness distribution over the cross-section of specimen is almost uniform and the average value of Vickers hardness is about 737. Furthermore, the tested tensile strength is about 2316 MPa.
Shape and dimensions of specimen (mm) Chemical composition of SUJ2 bearing steel (wt-%)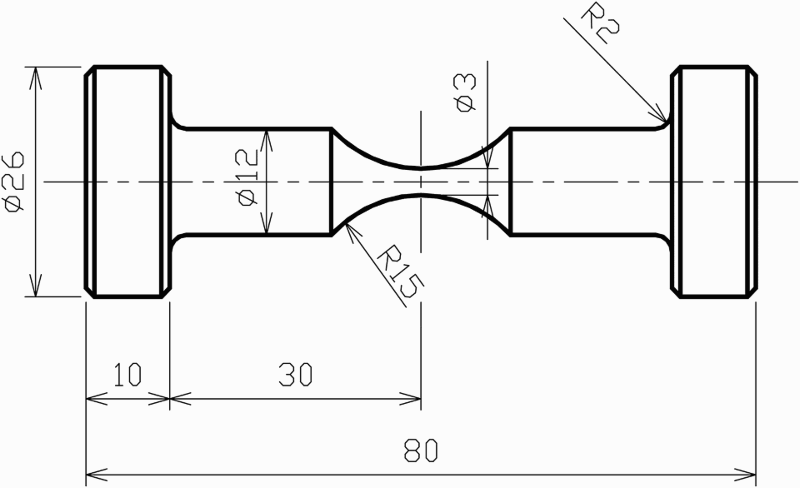

Fatigue testing method
A multi-type fatigue testing machine (PMF4–10) at frequency of 80 Hz was adopted to carry out the VHCF test of SUJ2 bearing steel under axial loading, by which four specimens can be tested simultaneously. Fatigue tests were all performed in an open environment at room temperature, and the stress ratio was given as  . After the experiment, fracture surfaces of all failed specimens were carefully observed by using scanning electronic microscope (SEM), paying particularly attention to the crack initiation sites and the failure mechanisms.
S–N characteristics
The obtained S–N diagram of SUJ2 bearing steel under axial loading is shown in Fig. 2. According to the preliminary SEM observation of fracture surfaces, fatigue failures of specimens can be classified into two failure modes: surface failure and interior failure. In Fig. 2, the hollow and solid marks indicate the S–N data with surface failure and interior failure, respectively. Obviously, it can be found that the surface failure mainly occurs at the relatively high stress region ( S–N diagram of SUJ2 bearing steel under axial loading ) with shorter fatigue life (
 ), whereas the interior failure mainly occurs at the relatively low stress region (
 ) with longer fatigue life (
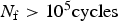 ). It should be noted that in the transition stress region from surface to interior failure, i.e. from σa
= 1200 to σa
= 1400 MPa, two failure modes coexist. Basically, at the stress regions below 1200 MPa, the interior failure becomes the predominant failure mode of SUJ2 bearing steel under axial loading.
). It should be noted that in the transition stress region from surface to interior failure, i.e. from σa
= 1200 to σa
= 1400 MPa, two failure modes coexist. Basically, at the stress regions below 1200 MPa, the interior failure becomes the predominant failure mode of SUJ2 bearing steel under axial loading.
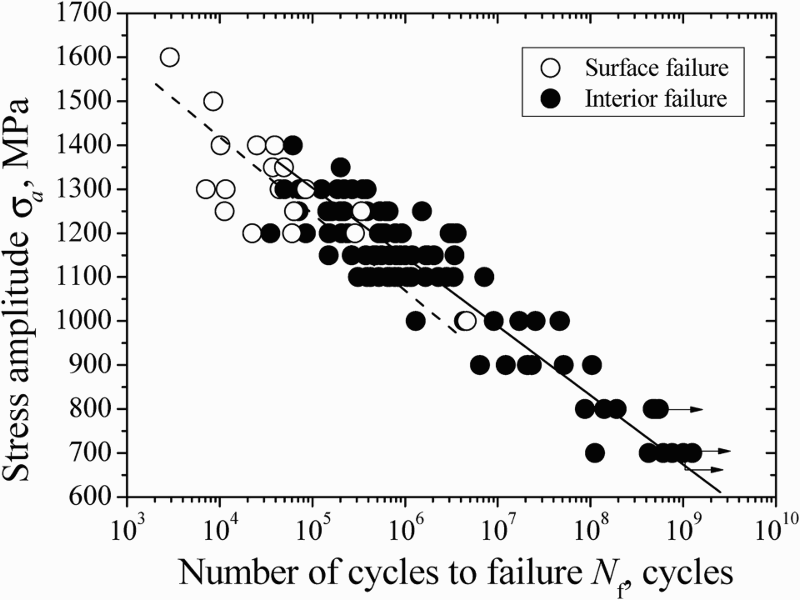
In view of the presence of two failure modes, the two S–N curves corresponding to the surface failure and the interior failure, fitted by the least square method, can be indicated by a dashed line and a solid line in Fig. 2, respectively. Two S–N curves all exhibit the continuously decreasing trend with the decreasing of stress amplitude, and a duplex S–N characteristics is approximately exhibited. However, it should be noted that compared with the experimental result of SUJ2 bearing steel under rotating bending,
9
as shown in Fig. 3, the herein presented duplex S–N characteristics under axial loading is not so distinct. In other words, the separation of S–N data respectively corresponding to these two failure modes is not clear. Moreover, the fatigue strength under axial loading is lower than that under rotating bending. To some extent, these are all attributed to the difference of stress distributions on the cross-section of specimen between axial loading and rotating bending.
S–N diagram of SUJ2 bearing steel under rotating bending
9
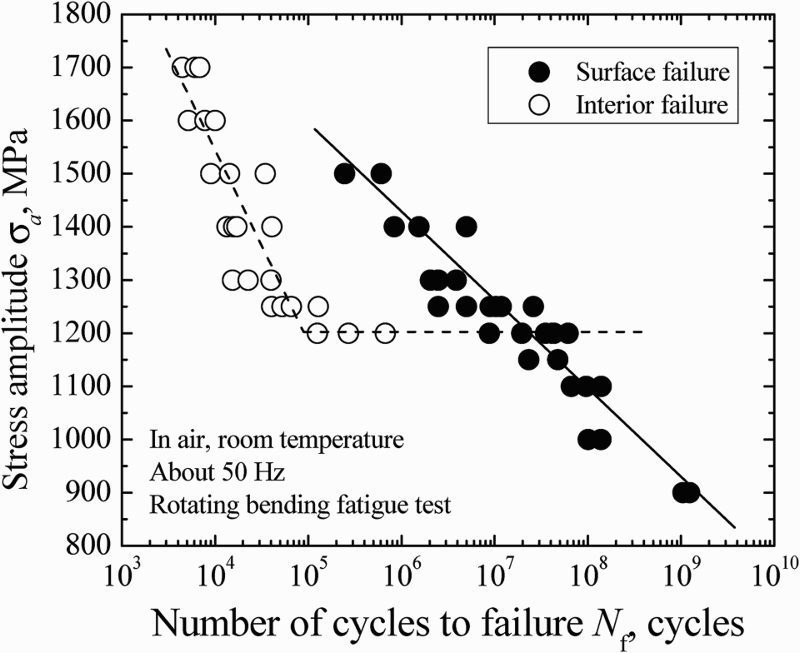
Figure 4 shows the schematic diagram of stress distributions on the cross-section under these two loading conditions. Under rotating bending, the stress distribution on the minimum-cross-section of specimen is not uniform. The stress level is the highest at the surface and is gradually reduced to 0 at the centre of minimum-cross-section. There is an obvious stress gradient effect under rotating bending. But under axial loading, the stress distribution on the minimum-cross-section of the specimen is uniform, and there is no stress gradient effect. Under the same nominal stress level, the net stress applied on the interior material beneath the surface layer under axial loading is obviously higher than that under rotating bending. In view of the fact that material defects such as non-metallic inclusions are all randomly distributed in the material, the number of critical defects likely causing fatigue crack under axial loading, also considered as ‘fatigue damage zone’, is much larger than that under rotating bending. Therefore, from statistical consideration, fatigue strength under axial loading must be lower and the possibility of interior failure also become larger if the number of critical defects becomes larger.
Stress distribution characteristics under two loading conditions
Crack initiation mechanism
As mentioned above, fatigue failure of specimen under axial loading is divided into the surface failure and the interior failure. The surface failure is mainly caused by the surface fine flaws, as shown in Fig. 5a. The interior failure is all caused by the interior inclusion. A fish-eye can be observed on the fracture surface, as shown in Fig. 5b. The inclusion is basically located at the centre of the fish-eye. If fatigue life is larger than around 106 cycles, the fine granular area (FGA) can occur in the vicinity of the inclusion, as shown in Fig. 5c.
Observation of fracture surfaces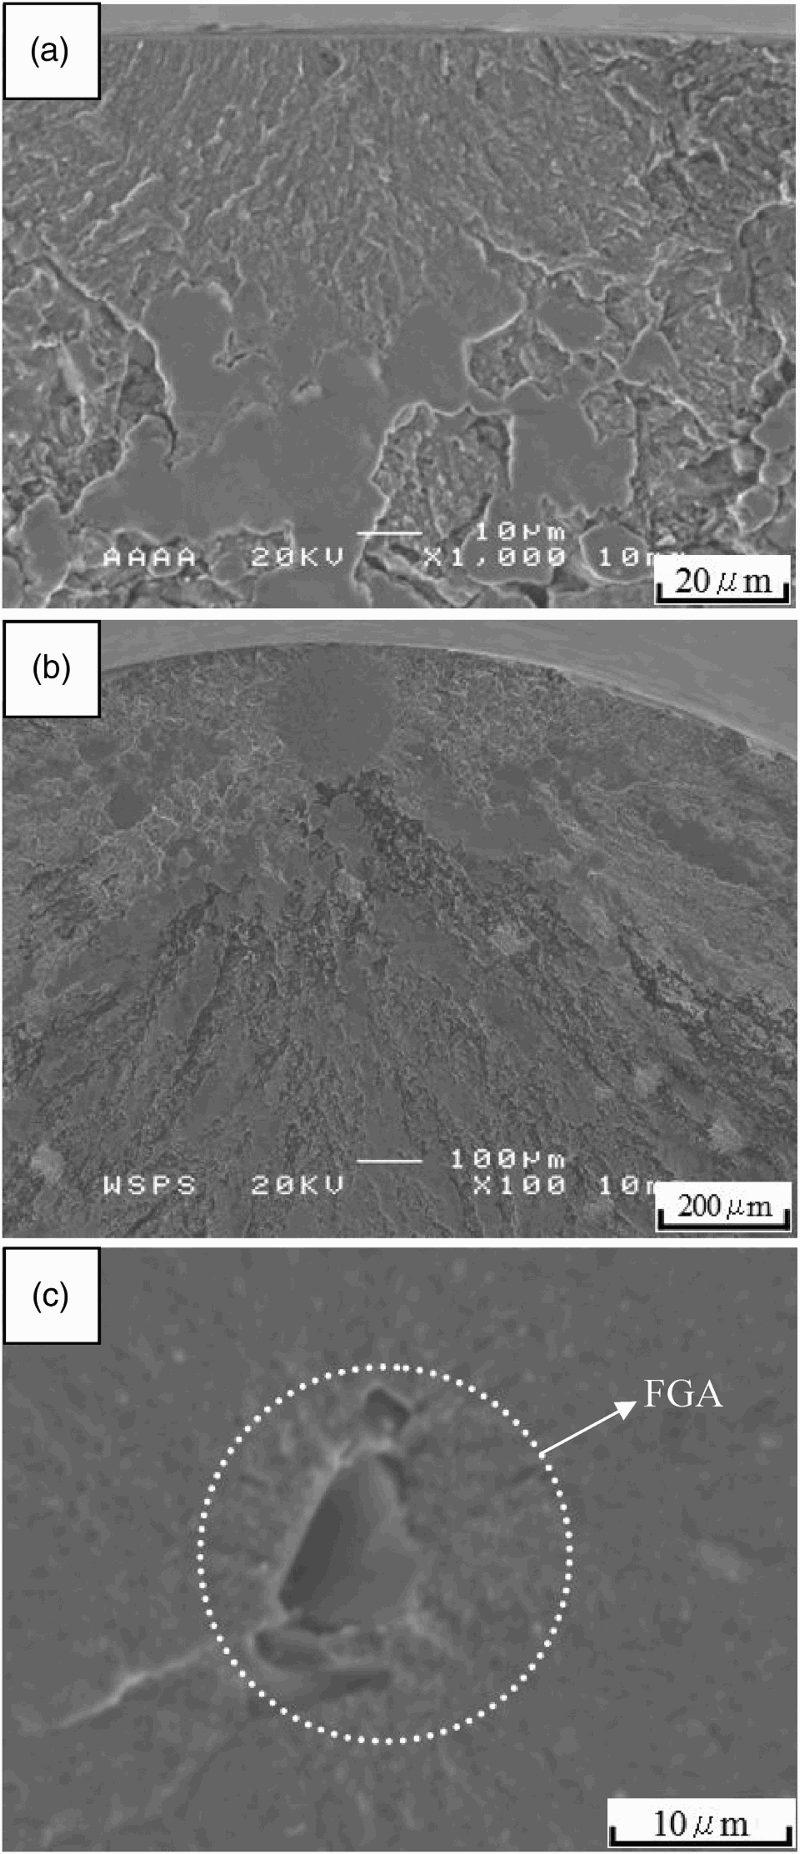
The formation process of FGA proposed by coauthor Sakai can be divided into the following stages
19
: (i) a fine granular layer induced from the intensive polygonisation is gradually formed in the vicinity of the inclusion during the long-term cyclic loading (i.e. formation of fine granular layer), (ii) the number of micro-debondings is gradually increased and some of them would coalesce to one another (i.e. nucleation and coalescence of micro-debonding) and (iii) the micro-debondings are entirely spread over the fine granular layer and a penny shape crack will be finally formed in the vicinity of the inclusion (completed formation of FGA). The relevant schematic diagram is shown in Fig. 6, where the longitudinal sections passing through the inclusion are indicated in the left hand side, while the cross-sections passing through the same inclusion are indicated in the right hand side.
Schematic diagram of FGA formation process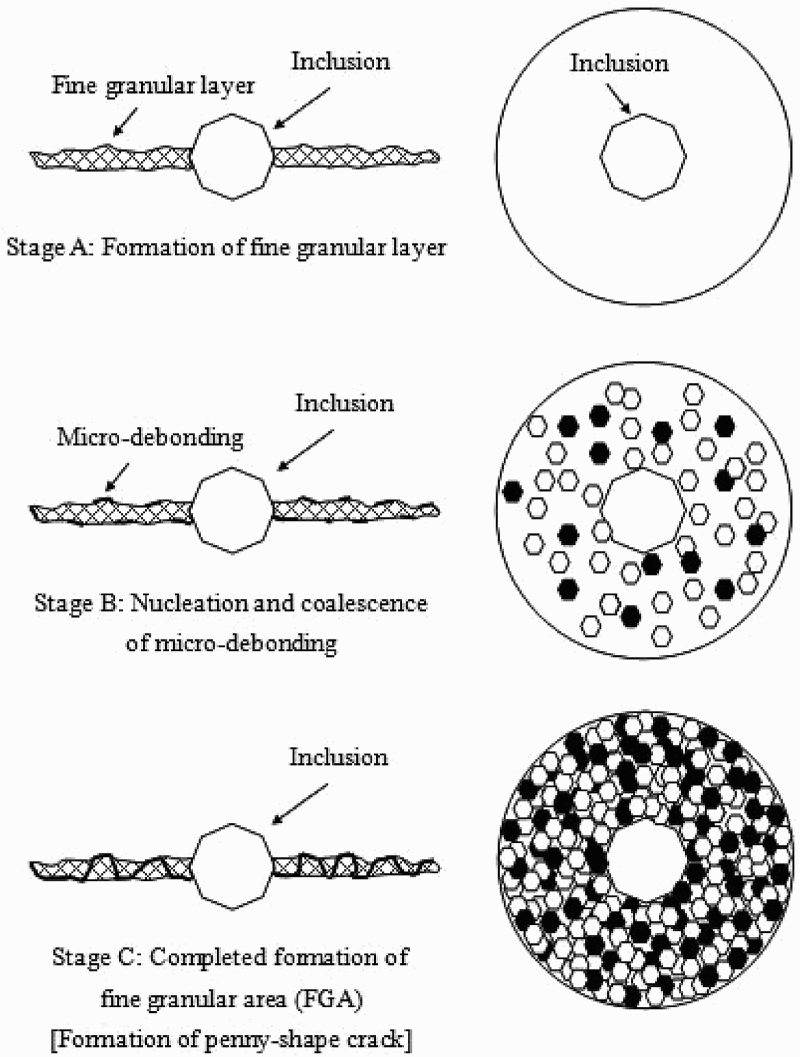
Statistical evaluation of life distribution characteristics
Generally speaking, for the test data with the same failure mode at a given stress amplitude, the corresponding life distribution characteristics can be well described by the common Weibull distribution function. However, when two or multiple failure modes coexist at a certain stress level, the data scatter becomes greater and the common Weibull distribution function is not suitable to characterise the corresponding life distribution. The experimental results of SUJ2 bearing steel are just in accordance with this situation. Under this circumstance, it can be assumed that the probabilities of different failure modes are independent each other, a mixed Weibull distribution function,  , can be proposed to describe the overall life characteristics with multiple failure modes, and given by:
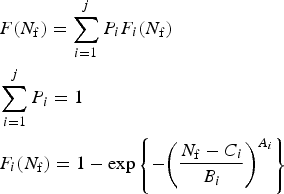
 is the three-parameter Weibull distribution function for one failure mode,
  ,
,  and
and  are the relevant shape, scale and location parameters, respectively. The parameter Pi denotes the occurrence probability for each failure mode, its experimental values can be given by:
 denotes the number of S–N data corresponding to one failure mode and n denotes the total number of S–N data regardless of failure mode.
Based on equations (1) and (2), the statistical distribution curves for the test data at the stress ranges of 1100–1300 MPa are indicated by some solid lines in Fig. 7. It can be seen from the figure that for the test data with the single interior failure mode at stresses of σa
= 1150 and 1100 MPa, they can be well characterised by the common Weibull distribution function. However, for the test data with two failure modes at stresses from σa
= 1200 to 1300 MPa, the relevant statistical results obtained by the mixed Weibull distribution function are not so good. Among them, the distribution curves corresponding to σa
= 1200–1250 MPa even intersect each other.
Plotted Weibull distribution curves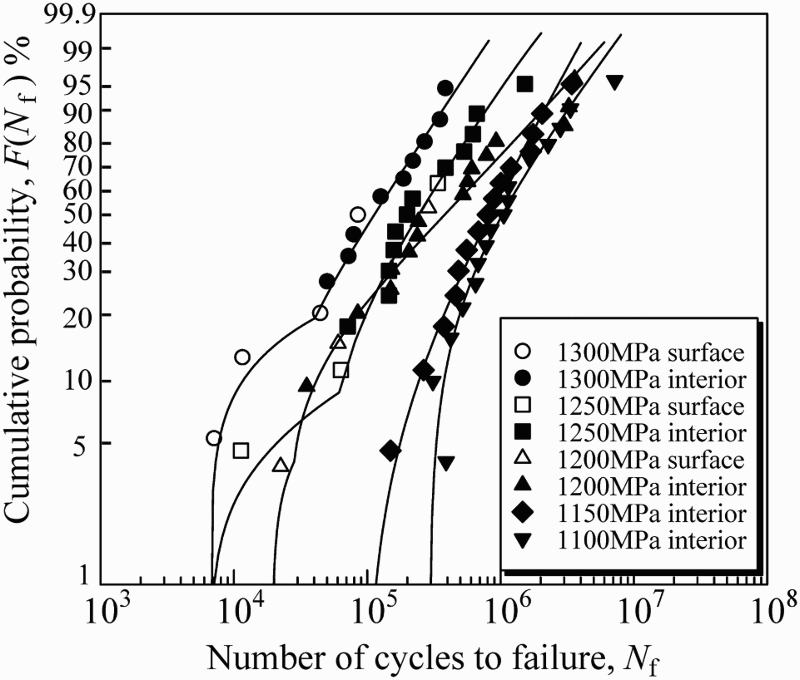
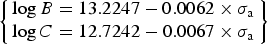
Under this circumstance, a new statistical method based on the parameter optimisation is proposed to evaluate the distribution characteristics of test data of SUJ2 bearing steel with two failure modes. First, the relationship between Ai and σa is analysed and shown in Fig. 8. It can be found that the values of Ai for each failure mode approximately keep a constant regardless of stress amplitude. Corresponding to surface failure and interior failure, the average values of Ai are evaluated to be about 0.9219 and 0.5199, respectively. Then, the relationships between Bi and Ci, and σa are also discussed, as shown in Figs. 9 and 10. It can be found that with the increasing of σa, the values of Bi and Ci all tend to decrease, whether surface failure or interior failure. Based on the least square method, the fitted curve equations for Bi and Ci can be expressed as follows:
Definition of shape parameter A Definition of scale parameter B Definition of location parameter C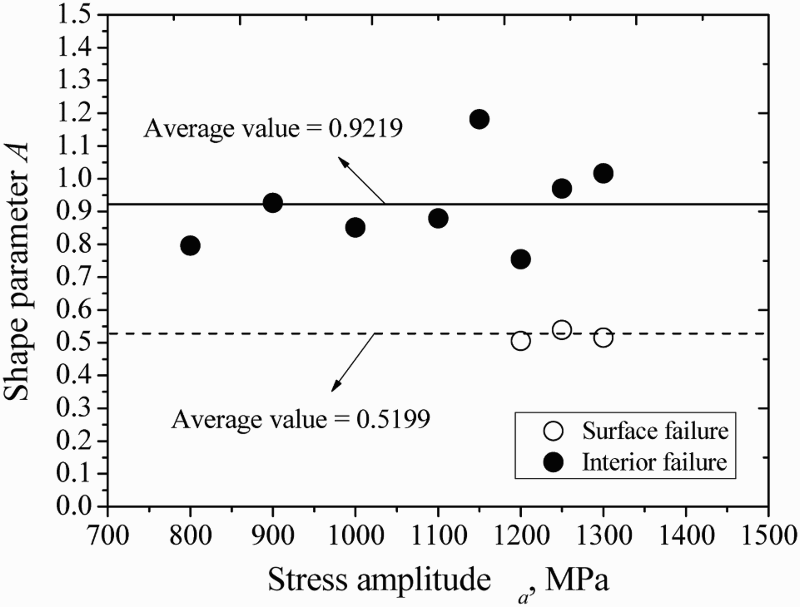
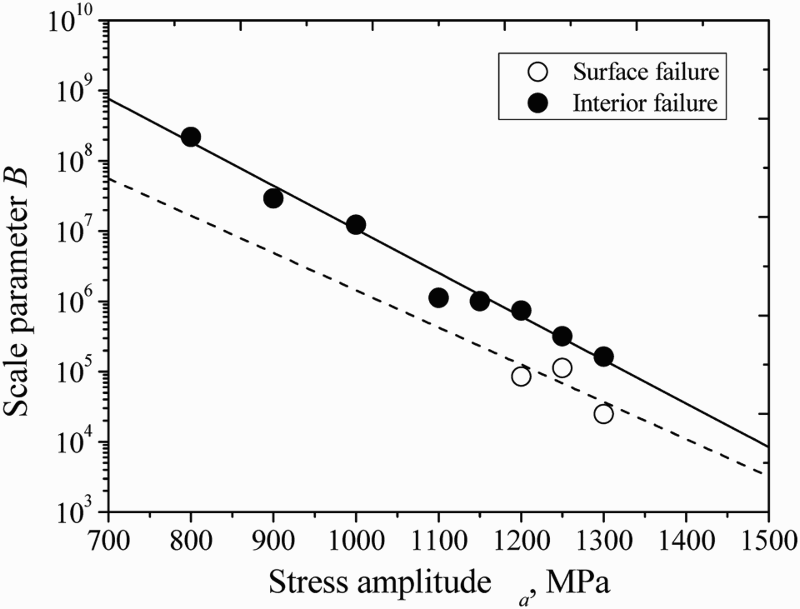
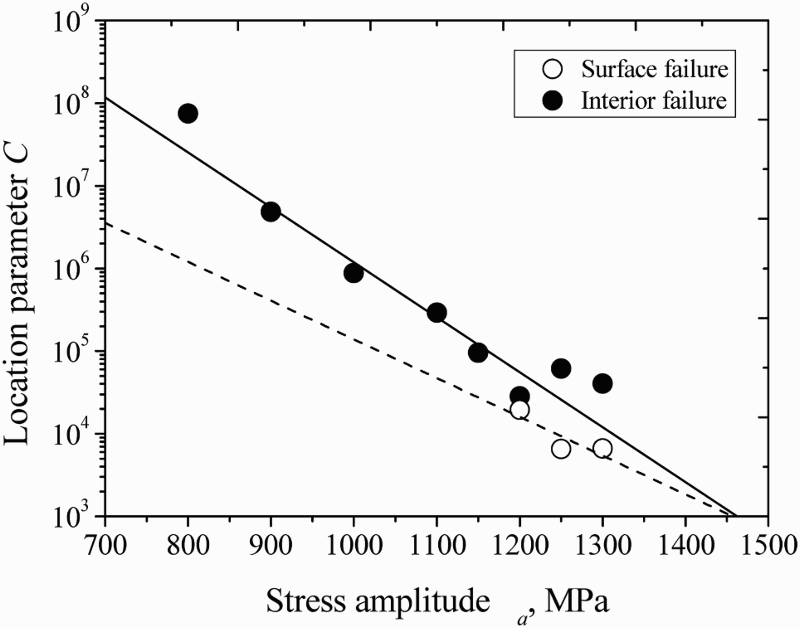
For surface failure:
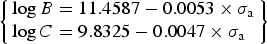
For interior failure:
The any values of Bi and Ci for different failure modes at different stress amplitudes can be conveniently obtained by using equations (3) and (4). Next, by using common Weibull distribution function, the relationship between Pi and σa for each failure mode can be plotted in Fig. 11, and the corresponding curve equations are expressed as follows:
Relationship between probability P and stress amplitude σa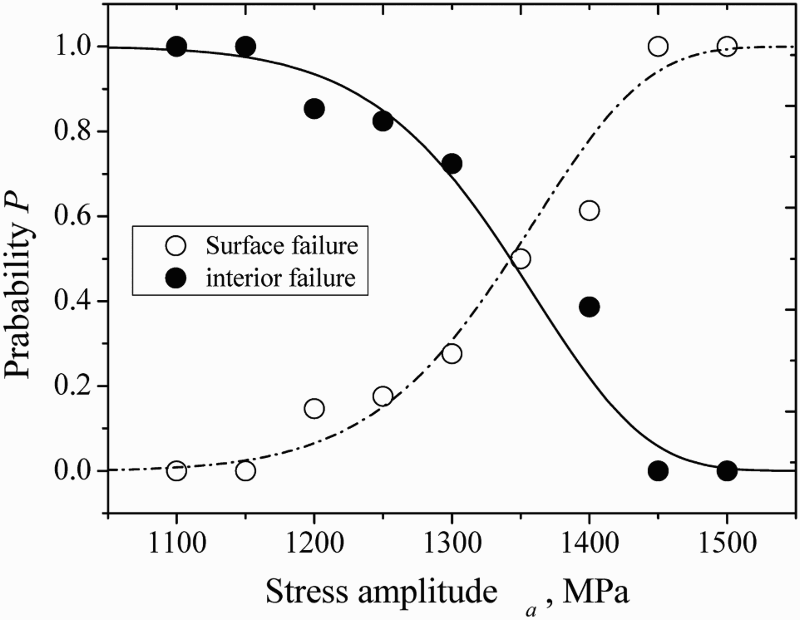
For surface failure:

For interior failure:

Similarly, the any values of Pi for different failure modes at different stress amplitudes can be conveniently obtained by using equations (5) and (6).
Finally, based on the evaluated values of Replotted Weibull distribution curves ,
,  ,
,  and Pi by using new method, the statistical distribution curves for the test data at the stress ranges of 1100–1300 MPa can be replotted by some solid lines in Fig. 12. Obviously, compared with results shown in Fig. 7, herein the evaluated results by using new statistical method are better, especially for the test data with two failure modes. Moreover, for the other stress amplitude, the relevant distribution curves can be established even if there are not fatigue test data at such stress amplitude, as indicated by some dashed lines in Fig. 12.
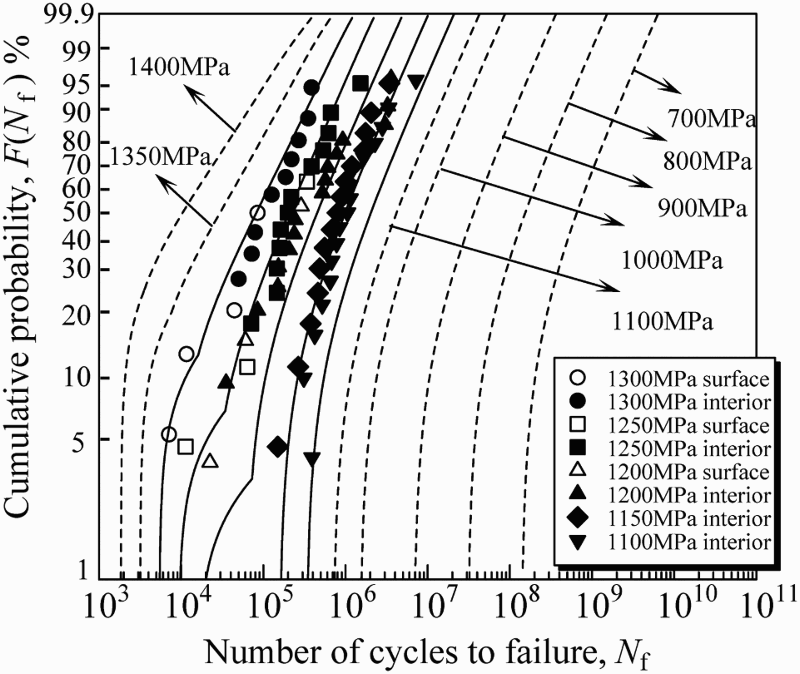
Establishment of P–S–N curves
Based on statistical results in Fig. 12, fatigue lives at any failure probabilities can be easily obtained. Thus, the P–S–N diagram of SUJ2 bearing steel under axial loading are shown in Fig. 13, where S–N curves giving the failure probabilities of F(N) = 1, 10, 50, 90, 99 (%) are plotted as P–S–N curves. Obviously, it can be seen from Fig. 12 that the established P–S–N curves by using the proposed statistical method are in good agreement with the test data, and the validity of the proposed method based on mixed Weibull distribution and parameter optimisation is proved.
P–S–N curves of SUJ2 bearing steel under axial loading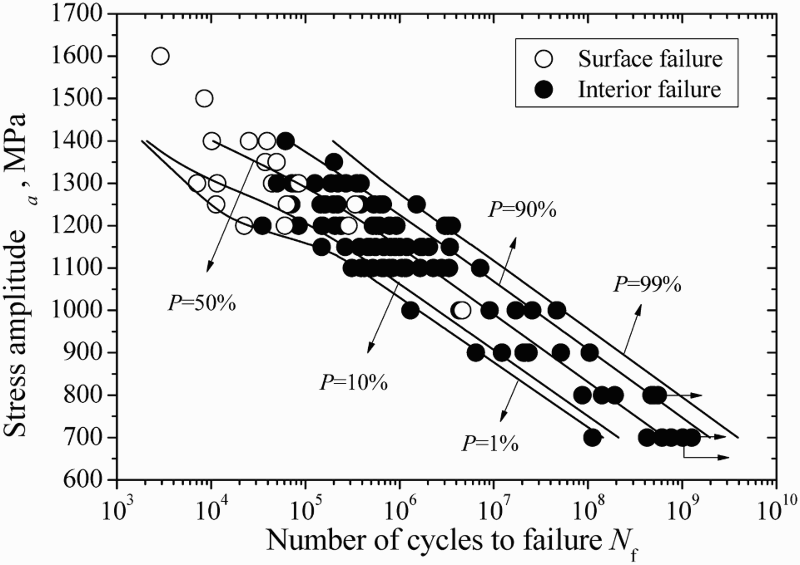
Conclusions
The main conclusions obtained in this study are summarised as follows:
Surface and interior failures for SUJ2 bearing steel under axial loading coexist at the applied stress levels of 1200–1400 MPa, the common Weibull distribution function is not suitable to characterise the corresponding life distribution. The interior inclusion-induced failure with fish-eye is the predominant failure mode in the VHCF regime, and the FGA can be found around the inclusion if the fatigue life is larger than 106 cycles. A statistical method based on mixed Weibull distribution and parameter optimisation was developed to evaluate the fatigue life distribution characteristics with two failure modes. The established P–S–N curves by using the proposed statistical method are in good agreement with the test data, and the validity of method is proved.
Footnotes
Acknowledgement
This research was supported by the National Natural Science Foundation of China (No. 51305027).