
Abstract
The effect of 0.5 wt-% SiC nanoparticle addition on microstructure and brazeability of Al–9Si–20Cu alloys has been investigated. The brazing is performed using the filler at 550°C for 30 min. Microstructural observations reveal the refinement of Si and CuAl2 in Al–9Si–20Cu–0.5SiC composite. The average size of Si particles decreases from ∼9 to ∼4 μm. It has been shown that SiC nanoparticles improve the filler brazeability; the spreading ratio increases up to 88.4% as compared to 76.67% over Al–9Si–20Cu alloy. The tensile strength and ductility of Al–9Si–20Cu–0.5SiC are also enhanced by 47 and 53% respectively. The melting point shows a depression ∼4°C in Al–9Si–20Cu–0.5SiC and thus can be a potential filler candidate for brazing industries.
Introduction
Aluminium alloys are currently the most promising lightweight materials used in the automotive industry to achieve weight reduction for improving fuel efficiency as well as reducing carbon emissions.1,2 Induction melting is a fast and economical process for the manufacturing of cast engineering components. The increasing demands of manufacturing structural components by induction melting process require high strength Al alloys. Induction melting has various advantages such as uniform temperature control, lower melt loss, low energy costs and better working atmosphere. 3 However, the currently available die cast Al alloys are unable to fully satisfy these requirements. Therefore, the development of high strength aluminium alloys made by the induction melting process is significant for manufacturing quality automotive components.
Copper is a common element used in aluminium alloys to improve the mechanical performance. Copper can provide solution and precipitation strengthening in aluminium alloys. Al–Si and Al–Cu based alloys have been extensively used in the industries over years, and Cu has been successfully alloyed to Al–Si to improve the mechanical properties.4–6 Although Cu alloying is effective in providing improvements in Al–Si alloys, there are some drawbacks as well. For example, Cu addition leads to a significant increase in porosity due to the formation of huge CuAl2 intermetallic compounds (IMCs), which results in deterioration of ductility, corrosion and hot tearing resistance, and castability. 7
There have been many efforts to modify the microstructure of Al–Si alloys through adjusting parameters and the addition of alloying elements and/or reinforcements.8–12 Among these strategies, the refinement and modification treatment with the addition of nanoceramic reinforcements have been recently tried because of their various advantages, like uniform microstructure, porosity reduction, light weight, superior strength. These types of reinforced alloys are generally termed as metal matrix nanocomposites. The matrix consists of Al–Si–Cu alloys reinforced with ceramic nanoparticles to strengthen the alloy matrix and to enhance the ductility. 12 It is also noteworthy that the processing techniques also depend on the final microstructure of the product. 13 Thus, the distribution of high energy nanoparticles in the Al matrix is an important factor to achieve the maximum benefit. If the distribution is not uniform, it may result in the formation of clusters of nanoparticles, which ultimately lead to the segregation of nanoparticles and porosity.12,13
There are few reports to assess the brazing ability of the filler metals in detail so far. Wan et al. studied the Al 5A06 filler and Ti–4Al–6V using arc brazing. They found that the spreading ability of the liquid filler was enhanced on the aluminised Ti substrate. 14 Zhang et al. studied the effect of Al on the Zn–Al filler and found an improvement on brazeability up to an optimal concentration of aluminium. 15 In a recent study, Miyazawa et al. performed spreading test of a Ni based filler on stainless steel and found that the presence of Cu and Si has been shown to improve the brazing ability. 16 Nowadays, the use of nanoparticles in metallic matrix is an attractive way to obtain improved properties. It has been also found that the presence of Al2O3 in cast hypereutectic Al–20Si–4.5Cu–Al2O3 nanocomposite improves the microstructural properties up to a greater extent. 12 In another study, it has been reported that Al2O3 nanoparticles dispersed in Al–Si–Mg and Al–Si–Cu alloys refine the primary Al and modify eutectic Si and CuAl2 phases during the solidification process. 17 Therefore, in the present investigation, it is an objective to find out the effect of SiC nanoparticles on the microstructure, brazeability and mechanical properties of the Al–9Si–20Cu alloy. The effect of SiC nanoparticles on the microstructural features, different phases such as Si particles and CuAl2 IMCs, as well as porosities has been examined. The mechanical properties and thermal behaviour of the composite specimens have also been investigated.
Experimental
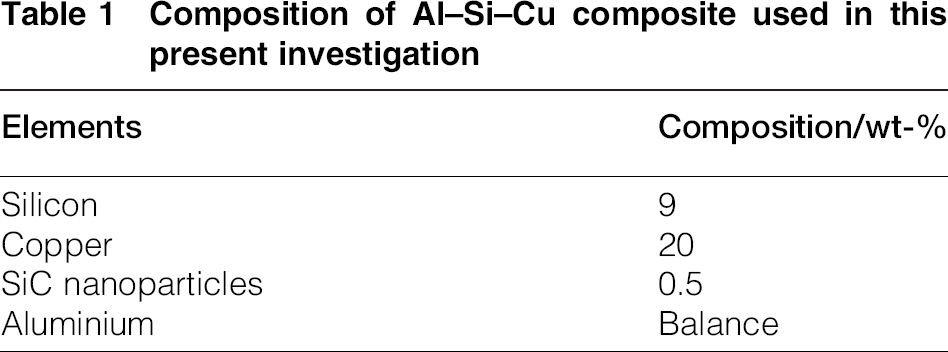
Al–11 wt-%Si (Al 4045) master alloy rods are bought from Dae Yang Special Metals, Seoul, Korea. The hypoeutectic composition Al–9Si–20Cu in wt-% is designed from the master alloys. The composition of the filler metal composite is shown in Table 1.
Composition of Al–Si–Cu composite used in this present investigation
The melting of the alloys and composites is done in two stages. The alloying elements are melted and held at 700°C for 30 min for the first stage melting. In second stage after 30 min, the temperature is raised to 1100°C and then held for 30 min. A complete heating profile adopted for the melting of the alloys is shown in Fig. 1.
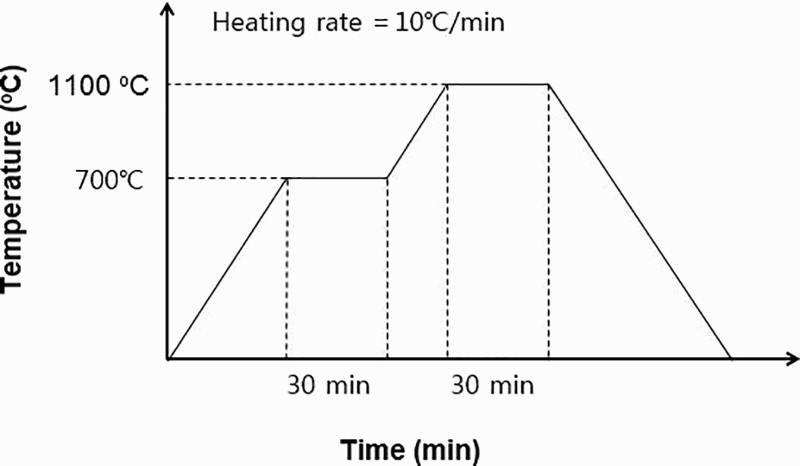
Schematic diagram to illustrate heating profile for induction melting of filler alloys and composite
The induction furnace is used for heating (PSTEK HF-15-TM-CL) with maximum operating power of 15kW at 30–100 kHz frequency. The temperature of the melt is measured by a K type thermocouple attached to the induction furnace. The purpose of the second stage heating is to achieve a homogenous melt. For composite samples, SiC nanoparticles are added in the alloy melt and stirred with a graphite rod stirrer for better dispersion. After that, the furnace is cooled to room temperature, and the samples are casted in a steel mould.
Microstructural characterisation
The structural characterisation is performed using an X-ray diffractometer (Bruker's XRD D8 Advance) operating at 40 mA and 40 kV, with Cu target (wavelength of 0.154 nm). The morphology of the alloys and composites is observed in an analytical scanning electron microscope (SEM) operating at 15 kV. The solidified samples are cut and polished using standard metallographic techniques. To observe the microstructural features, the samples are etched using an etchant made from the combination of 10 vol.-% H3PO4 (ortho-phosphoric acid) and 90% water at 50°C for 60 s. The different IMCs and phases are further identified by energy dispersive spectroscopy (EDS) techniques attached with the SEM machine.
To investigate the microstructural changes after brazing the fillers on Al4047 substrates, the interfacial region is examined. The fillers are bonded to the Al 4047 plates in the lap joint configuration. The schematic sketch of the lap joint is shown in Fig. 2, where the filler material is sandwiched between two Al 4047 plates. The joint is formed by brazing at 550°C for 30 min using the Al–9Si–20Cu and Al–9Si–20Cu–0.5SiC fillers for comparison.
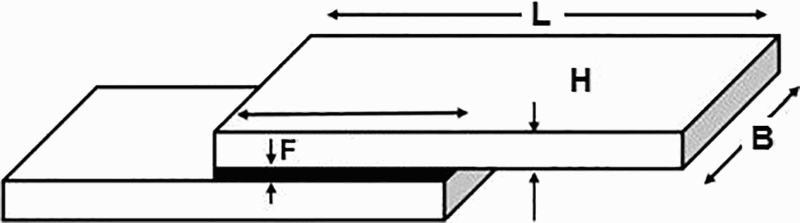
Lap joint geometry used for brazing
The length (L) of the plates is 62 mm, width (B) is 15 mm, and thickness (H) is 10 mm. The thickness of the filler metal after joining is ∼0.25 mm. The overlapped length (sandwiched region in black) of the substrates is ∼6.15 mm.
Differential thermal analysis
The differential thermal analysis is performed for the assessment of the melting behaviour of the developed alloy and composites using a differential thermal analyser. The samples are temperature programmed using Al2O3 pans from 50 to 600°C at a heating rate of 10°C min− 1 under Ar gas.
Brazeability
For brazeability assessment, the measurement of spreading ratios of molten filler alloy and composite is used. Al 4047 plates (30 mm × 30 mm × 0.3 mm) polished with different grades of SiC papers (400–2000#) are selected as substrates for spreading tests. Before spreading measurement, 0.3 g of filler is mixed with 0.03 g of Nocoloc flux. The mixture is placed on Al plate and held over a temperature of ∼580°C. As soon as the filler melts, the time is noted for a duration of 30 s, and the Al 4047 plate is taken out of the temperature bath and cooled to room temperature. The spreading ratio is calculated from the following equation
18
:
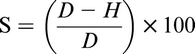
 , where ρ is the density of the filler.
Tensile testing
The tensile testing is performed on cast Al–9Si–20Cu alloy and Al–9Si–20Cu–0.5SiC composite using ASTM E8 M-01 standards. The dimension and the size of samples used are shown in Fig. 3. The slashed cross-section indicates the thickness of the sample. The overall length is 80 mm and grip section width is 20 mm. The length of reduced section is 60 mm and gauge length is 50 mm. The width of the gauge section is 10 mm. The radius of the fillet is 25 mm. The tensile experiment is performed using the parameters such as a crosshead speed of 0.5 mm min− 1 and a strain rate of 0.001 s− 1 with a universal testing machine (UTM MTS 810, USA). Three samples are tested for each monolithic and composite sample. The ultimate tensile strength (UTS) and the percent elongation values are extracted from the stress–strain diagrams of the samples.
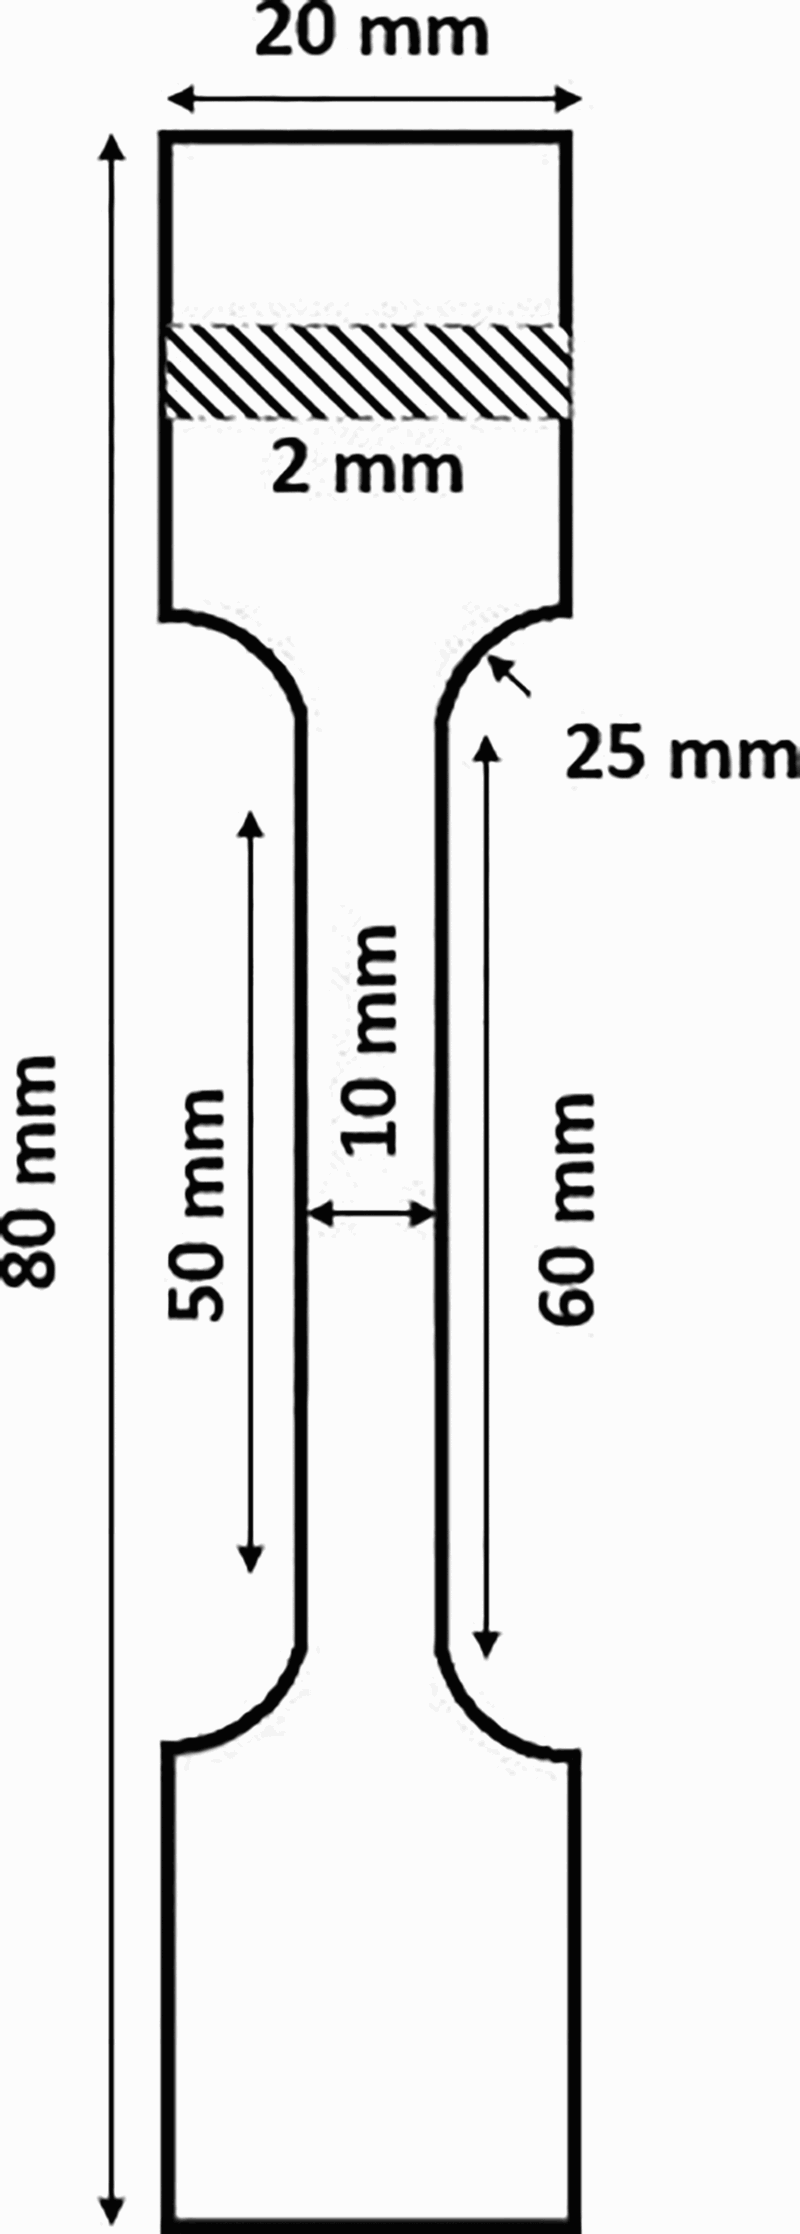
Schematic sketch of prepared tensile samples
Results and discussion
X-ray diffraction
The XRD patterns of the monolithic Al–9Si–20Cu and Al–9Si–20Cu–0.5SiC composite are shown in Fig. 4.
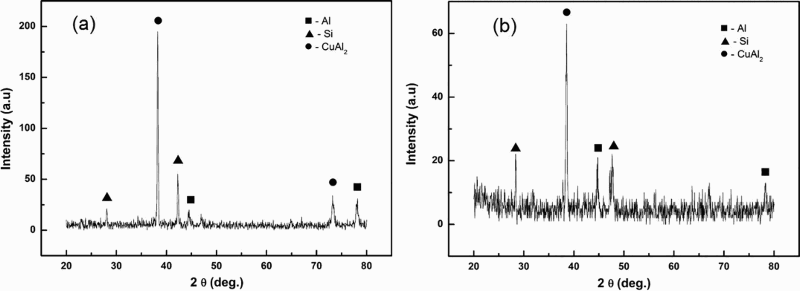
XRD patterns of a monolithic Al–9Si–20Cu alloy and b Al–9Si–20Cu–0.5SiC composite
The diffraction patterns show the presence of the Al, Si and CuAl2 phases in both the monolithic and composite samples. Similar observation is noticed by Chang et al. 19 When compared to the monolithic alloy, the diffraction peaks of CuAl2 IMCs and Si particles are less intense. This may be due to the presence of the high surface energy SiC nanoparticles that modify the interfacial characteristics of the alloy.
Surface morphology
Filler alloy and composite
The scanning electron images of Al–Si–Cu alloy and composites are shown in Fig. 5. Figure 5a shows the large sized Si particles in dark colour, while the shiny regions correspond to the CuAl2 IMCs. As shown in Fig. 5b, numerous pores are observed as shown in encircled regions in case of monolithic Al–9Si–20Cu alloy. The porosity may arise due to the presence of the large CuAl2 IMCs.
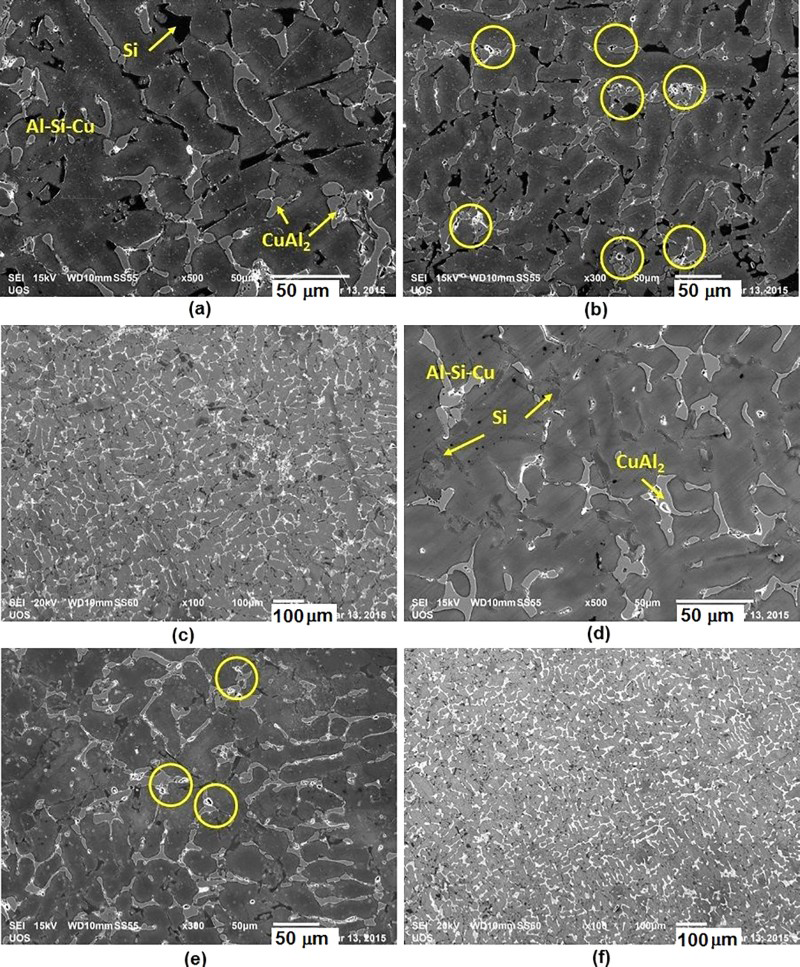
SEM image of a–c monolithic Al–9Si–20Cu and d–f Al–9Si–20Cu–0.5SiC composite
Figure 5c is the low resolution image of Fig. 5a, showing a broad view of Si particles and CuAl2 network in Al–9Si–20Cu alloy. Figure 5d shows the microstructure of Al–9Si–20Cu–0.5SiC composite, where the size of Si particles is found to decrease (compared to Fig. 5a). In the Al–Si–Cu–0.5SiC composite (Fig. 5e), the fraction of porosity is also reduced (indicated by encircled regions) within the matrix. Even at a lower resolution, the Si particles look smaller (Fig. 5c and f). These observations suggest that the composite sample will result in enhanced mechanical properties, due to the lesser pore fraction, and a refined microstructure, where the grain size of α-Al and Si as well as IMC thickness are decreased to a greater extent. Moreover, a reduction in porosity can also be beneficial for the brazing operations where cracks or pores may cause failure of the joint. The porosity calculation is performed by the Archimedes principle using an electronic balance with an accuracy of 0.01 mg. The results are shown in Table 2.
Density and porosity of Al–9Si–20Cu and its composite
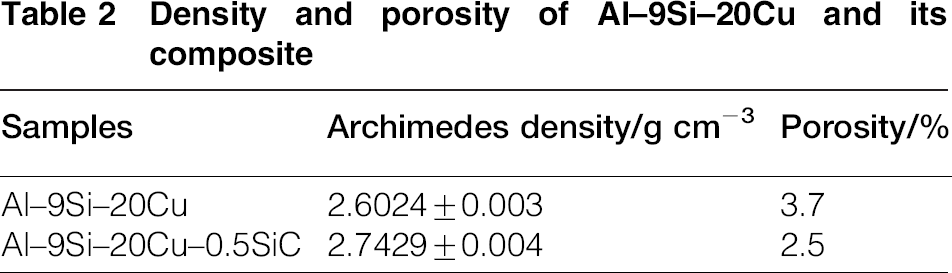
The composite sample Al–9Si–20Cu–0.5SiC shows a reduction of porosity by 32% compared to monolithic Al–9Si–20Cu alloy. This confirms the observation that SiC nanoparticles are beneficial for the suppression of the pore formation inside the aluminium matrix. It is already observed from Fig. 5c and f that the coarse Si particles are reduced in their size and shape significantly. After an addition of 0.5 wt-% SiC nanoparticles in the matrix, most of the Si particles are refined and distributed homogeneously in the matrix. The statistically measured average sizes of Si particles in Al–9Si–20Cu alloy and Al–9Si–20Cu–0.5SiC composite are 9 ± 3 and 4 ± 2 μm respectively. It is well recognised in the literature that the cracks and pores easily initiate at interfaces between the brittle Si particles and Al phase, and then propagate inside the primary Si particles. 12 The refinement of Si particles and the CuAl2 network also decreases in size and is well dispersed throughout the matrix (Fig. 5c and f).
The EDS analyses of the monolithic alloy and composite are shown in Fig. 6. The result of EDS elemental mapping on the Al–9Si–20Cu–0.5SiC composite exhibits the high amounts of Si and C, supporting the presence of the SiC nanoparticles.

a secondary electron image of Al–9Si–20Cu–0.5SiC; b–e EDS mapping of composite alloy showing Al, C, Si, Cu elemental maps; f EDS spectrum of sample in (a)
It has been documented in the past that nucleation of the CuAl2 IMCs occurs on the eutectic Si particles during the final stage of the solidification of Al–Si–Cu alloys. Therefore, the refinement of the CuAl2 network in Al–Si–Cu–0.5SiC composite might be attributed to the obstruction of CuAl2 growth by simultaneous refinement of Si particles.12,17 The EDS results confirm that the dark needle or irregular type structures are Si particles, whereas the shiny structures are CuAl2 IMCs. The modification of the network of brittle CuAl2 and Si particles coupled together suggests an enhancement of nanocomposites in strength and ductility considerably.
Bonding interface
The microstructures of the lap joint interface of the Al–Si–Cu alloy and Al–Si–Cu–0.5SiC after brazing at ∼550°C joined for 30 min are shown in Fig. 7.
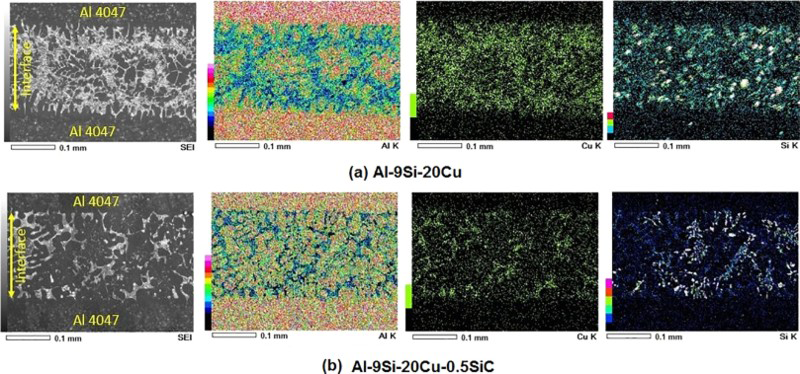
EDS mapping of brazed joint interface of a filler Al–9Si–20Cu and b Al–9Si–20Cu–0.5SiC composite
It is observed from the Fig. 7a and b that the concentration of Cu in Al–9Si–20Cu is higher as compared to Al–9Si–20Cu–0.5SiC. It indicates that a huge formation of CuAl2 in the interface for Al–9Si–20Cu–0.55SiC is reduced. Moreover, the Si particles observed are also finer when 0.5 wt-% SiC is added in the Al–9Si–20Cu alloy. This indicates an improvement in the brazing performance due to the presence of SiC nanoparticles in the Al–9Si–20Cu matrix.
Differential thermal analysis
The thermal analysis curves of the various developed fillers are shown in Fig. 8. The melting temperature of the Al–9Si–20Cu alloy comes out to be ∼541.7°C. It is also observed that an addition of SiC in Al–9Si–20Cu alloy also depresses the liquidus temperature to 536.7°C (a depression of ∼4°C).
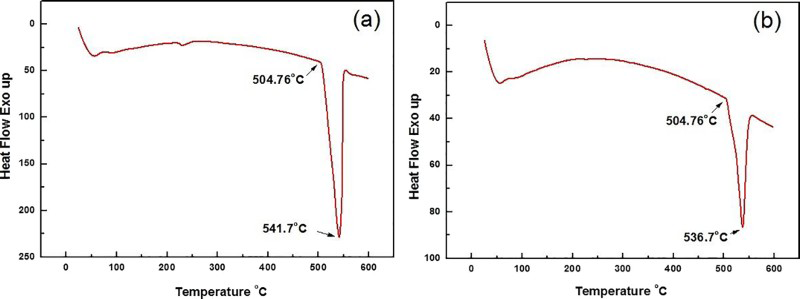
Differential thermal analysis of a filler Al–9Si–20Cu and b Al–9Si–20Cu − 0.5SiC composite
This can be due to the interfacial instabilities brought about by the presence of the high surface energy SiC nanoparticles in the Al–9Si–20Cu alloy system. 20 Moreover, the temperature difference between the solidus ( ≈ 504.76°C) and liquidus temperature is reduced in composite, which is a good sign of improved brazeability of the Al–9Si–20Cu–0.5SiC sample.
Spreading ratio
The spreading ratios are calculated on the Al 4047 substrates as shown in Fig. 9. The spreading ratio of Al–9Si–20Cu comes out to be 76.67%, while the spreading ratio of the composite Al–9Si–20Cu–0.5SiC is ∼88.4%, which implied fine wetting of the composite alloy in the presence of the SiC nanoparticles.
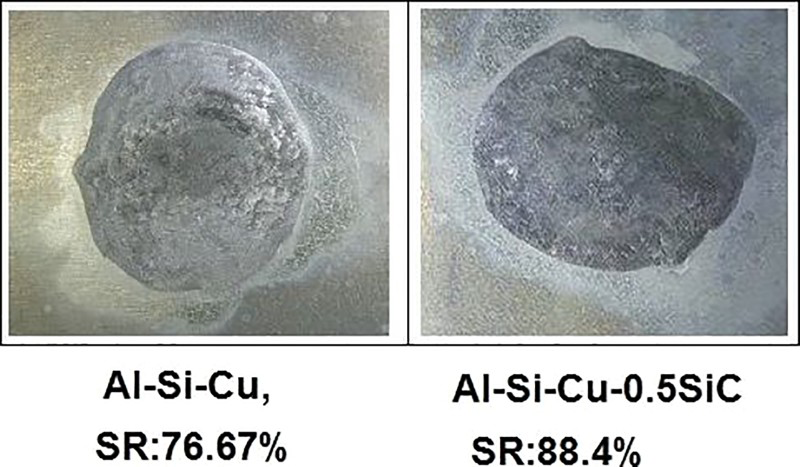
Spreading ratio of Al–Si–Cu and Al–Si–Cu–0.5SiC composite
This confirmed the superior brazeability and fluidity of the alloy in the presence of the SiC nanoparticles in the matrix. An enhancement of the spreading ratios is due to the reduction in the interfacial energy of the filler substrate in the presence of the high energy SiC nanoparticles.
Tensile testing
Figure 10 shows the typical stress–strain curves of the monolithic Al–9Si–20Cu alloy and Al–9Si–20Cu–0.5SiC composite.
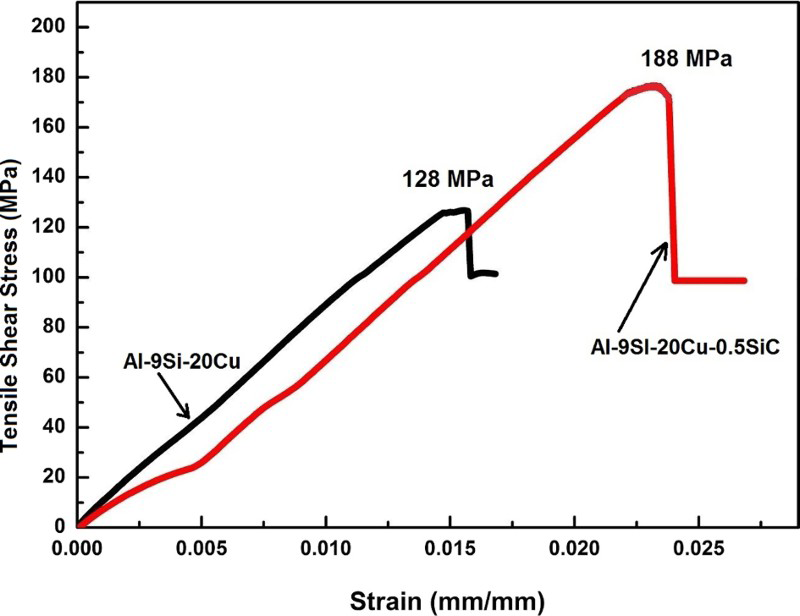
Tensile stress–strain diagram of Al–9Si–20Cu and Al–9Si–20Cu–0.5SiC composite
The average values of the UTS and the elongation percentage obtained are shown in Table 3.
Tensile properties of Al–9Si–20Cu alloy and composite
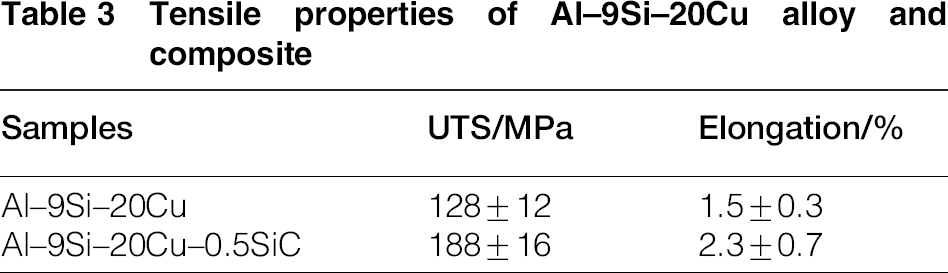
The results show that the UTS and the elongation percentage of the Al–9Si–20Cu alloy increase with the addition of SiC nanoparticles. The UTS and elongation are increased by 47 and 53% respectively compared to the monolithic Al–9Si–20Cu alloy. This implies that SiC nanoparticle is effective for the enhancement of mechanical properties of hypoeutectic Al–9Si–20Cu alloy. An increase in elongation is interesting, since the elongation percentage generally decreases with the addition of reinforcements like micrometre sized particles or fibre in the metal matrix. This can be attributed to the fact that the beneficial effect of SiC nanoparticles on the mechanical properties of Al–9Si–20Cu alloy is related to the refinement of Si particles and the morphology modification of eutectic Si particles as well as network of CuAl2 phases as observed from the SEM. 12
Conclusions
The fabrication of Al–9Si–20Cu and composite reinforced with SiC nanoparticles has been achieved successfully using induction melting. The microstructure of Al–9Si–20Cu alloys consists of the Al–Si–Cu eutectic morphology, Si particles and the CuAl2 phase. The addition of 0.5 wt-% SiC nanoparticles refines the grain size and CuAl2 IMCs. The melting point is also reduced significantly by 4°C with the addition of SiC nanoparticles in the alloy. The spreading ratio increases from 76.67% (for monolithic Al–9Si–20Cu alloy) to 88.4% (for 0.5 wt-% SiC composite). For Al–9Si–20Cu–0.5SiC nanocomposites, the UTS and elongation increased by 47 and 53% respectively.
Footnotes
Acknowledgements
This work was supported by the Energy Efficiency & Resources Core Technology Program of the Korea Institute of Energy Technology Evaluation and Planning (KETEP) granted financial resource from the Ministry of Trade, Industry & Energy, Republic of Korea [grant no. 20142020104380].