
Abstract
Ground silica (d50, 20 μm) was treated as an aqueous suspension of 5·0 wt-% solids by alternating current electrocoagulation (AC/EC) in the direct mode. The initial settling rate increased linearly by 0·054 m h−1 per minute of AC/EC, with the maximum (>7·32 m h−1) occurring at t>120 min of AC/EC. Up to 75 min, floc size controlled the initial settling rate; at longer times, floc morphology took control.
Aluminium released from the electrodes was adsorbed as it entered the pulp, and could be viewed as having been metered in continuously. Aluminium precipitation became prominent after ∼75 min of AC/EC time and was not deleterious to the enhancement of settling behaviour.
Two years after its preparation, electrocoagulated silica was demonstrated to be an effective coagulant for as-received silica and oil sands fluid fine tailings.
Keywords
Notation
Constants
Boltzmann's constant k = 1·381×10−23 J K−1
Feed suspension temperature T = 294·5 K
kT = 4·067×10−21 J
Absolute viscosity of feed water μ = 8·962×10−4 Pa s
Number concentration of silica particles ns = 4·9×1012 particles m−3
Radius of d50 silica particle as = 10 μm = 10−5 m
Shear rate at impeller tip speed of 1·73 m s−1,
 = 900 s−1
Ionic radius of aluminium aAl = 5·3×10−11 m (Orvig, 1993)
Avogadro's number Na = 6·02×1023 ions mol−1
Symbols
diffusion coefficient of aluminium ion, m2 s−1
diffusion coefficient of d50 silica particle, m2 s−1
aluminium ion–silica particle collision frequency, collisions m−3 s−1
silica particle–silica particle collision frequency, collisions m−3 s−1
molar concentration, mol L−1
number concentration of aluminium ions, ions m−3
number concentration of silica particles, particles m−3
liquid state
gaseous state
amorphous state
concentration of total dissolved aluminium
surface atom on silica
surface atom on Al(OH)3(am)
initial temperature
final temperature
Introduction
Background
Few electrocoagulation studies have been performed with alternating current. Fewer still have focussed on treating suspensions having a solids concentration similar to that of thickener feed, as is the case here (i.e. 5·0 wt-%).
In a previous paper (Ifill and Etsell, 2011a), the effect of agitation on the efficacy of alternating current electrocoagulation (AC/EC) was examined. In that paper, AC/EC was applied in the direct mode, but little was discussed about the mode itself. By ‘direct AC/EC’, it is meant that the entire silica suspension is subjected to electrocoagulation. It contrasts with ‘indirect AC/EC’ which involves AC/EC treatment of the feed water into which the as-received silica is then dispersed.
In the paper referenced above, fine silica (d50, 20 μm) was characterised as settling poorly. Its initial settling rate in de-ionised water containing 200 mg L−1 NaCl was 9·6×10−4 m h−1 (i.e. 1·6×10−3 cm min−1). The direct application of AC/EC to a suspension of 5·0 wt-% solids enhanced the initial settling rate by over three orders of magnitude. Test results also indicated a dependence of the initial settling rate upon the electrocoagulation time, a direct consequence of the aluminium dosage and the resulting floc growth. Since, at that time, little had been discussed about the direct mode itself, the current paper is dedicated to examining the nature of direct AC/EC with respect to its influence on the settling behaviour of the silica.
Stages of floc growth
As flocs grow, their solid volume fraction (floc density) decreases (i.e. porosity increases) and they become mechanically weaker. The rate of floc growth increases with the frequency of successful interparticle collisions and, hence, with the collision frequency. On the other hand, slower growth rates produce denser flocs (Gregory, 1993).
Floc growth kinetics is determined by physical and chemical parameters which influence the floc shape, structure, density, strength and size. The physical parameters include pulp density, shear conditions and initial particle size. Among the chemical parameters are the molecular weight and structure of the coagulant or flocculant, the pH of the suspension, and the ionic species present in the dispersion medium (Yukselen and Gregory, 2002; Ayyala et al., 1995).
Initially, the rate of floc growth is rapid, but then decreases as a limiting size is approached. Floc growth has been ascribed to three regions (Ayyala et al., 1995; Wang et al., 2009). In Region 1, primary particles aggregate to form microflocs of up to about 50 μm in size. Microflocs consist of closely packed particles and, therefore, have the highest density (porosity <∼45 vol.-%). In Region 2, growth proceeds by collision between primary particles and microflocs, as well as among microflocs, the latter growth mode being termed ‘multiple level aggregation’. In this growth region, porosity ranges from 45 to 95 vol.-%, with multiple level aggregation being responsible for flocs in the higher end of the porosity range. The range of floc sizes could be wide, from 50 μm to about 500 μm. In Region 3, floc size could exceed 500 μm and the porosity could be >95 vol.-%, depending on the extent of multiple level aggregation (Ayyala et al., 1995). In Region 3 and the latter part of Region 2, rearrangement of microflocs, as well as floc fragmentation and reaggregation, occur (Zbik et al., 2008). The net of these processes determines how the floc morphology is modified with time (Ayyala et al., 1995; Gregory, 1993). It is important to note that flocs can adopt several equilibrium size distributions during reaggregation. It is to be noted, also, that the floc size range attained in each region will vary with the particulate material and with the physical and chemical parameters.
Collision rates
Estimates of the collision rates, under quiescent and shear conditions, between aluminium ions and silica particles, and of interparticle collision rates under shear, are derived in the Appendix.
Simple Brownian motion constitutes baseline conditions against which observations in shear can be compared. The diffusion coefficients for an aluminium ion and a silica d50 particle are calculated to be: DAl, 4·5×10−9 m2 s−1; Ds, 2·4×10−14 m2 s−1. Hence, by virtue of the much larger particle size, Ds is five orders of magnitude smaller than DAl. It is noteworthy that the actual value of DAl would be affected by the presence and concentration of the silica particles, by diffusing aluminium, sodium and chloride ions, by dispersive and electrostatic interactions, and by the oscillating AC electric field. Complex corrections can be made for these influences on DAl (Masliyah, 1994) but, for the present purpose, are not justifiable. As electrocoagulation proceeds, DAl would increase as a result of its direct dependence on temperature and its inverse dependence on the water viscosity. At the feed suspension temperature (21·5°C), the rate at which aluminium ions and silica particles collide is estimated to be 9·4×1019 collisions m−3 s−1.
Under conditions of simple shear, silica particles are estimated to collide with one another at the rate of 2·3×1014 collisions m−3 s−1, while the frequency with which the particles collide with aluminium ions is estimated at 2·0×1020 collisions m−3 s−1. Hence, compared to simple Brownian motion, the ion–particle collision rate was doubled when agitation was applied at the impeller tip speed of 1·73 m s−1.
Electrocoagulation mechanisms
Hydrolytic aluminium complexes are the effective coagulants generated in situ during electrocoagulation. The chemical reactions by which these complexes are produced have been explored previously (Ifill and Etsell, 2011a). Hydroxo- and oxyhydroxoaluminium complexes are adsorbed both specifically and electrostatically onto the silica surface and, through their high charge, are responsible for interparticle bridging.
Experimental
As-received and electrocoagulated silica
The silica was supplied under the trade name ‘Sil-Co-Sil Ground Silica’ by the Ottawa Silica Company of Ottawa, Illinois, U.S.A., and was tested as received. It was characterised by its moisture content, density and particle size distribution. In addition, its zeta potential and natural settling behaviour were determined in deionised water containing 200 mg dm−3 (200 mg L−1) NaCl. The salt was added to increase the specific conductivity for electrocoagulation.
As set out in Standard D 422 (ASTM, 1997), the hydrometer method was used to determine the particle size and floc size distributions of as-received and electrocoagulated silica, respectively. Deionised water was used instead of distilled water. The hydrometer had a cylindrical bulb and was graduated over the specific gravity range of 0·995–1·300.
The natural settling behaviour of as-received silica was established by a settling test at 24°C over 17·2 h in a 1-L graduated cylinder. After AC/EC treatment, 1 L of electrocoagulated slurry was withdrawn under continuous agitation and subjected to a 60-min test at 24°C. Enhancement in settling behaviour was evaluated by comparison of initial settling rates.
The zeta potential of as-received silica was measured in deionised water containing 200 mg L−1 NaCl at pH 8·5 (feed water pH). A Rank Brothers microelectrophoresis unit Mark II was used with a flat electrophoresis cell. At each stationary position, the time taken for each of 10 particles to traverse 100 μm was recorded. The particles were timed successively in opposite directions of travel to minimise electrode polarisation. The ratio of the cell dimensions (l/d) was 9·64, where l represents the internal height of the cell, and d the internal width. For the location of the stationary positions in the cell, the Komagata correction for l/d<20 was invoked, as instructed by Rank Brothers (1986) and as rationalised by Hunter (1981).
Deionised water
Deionised water was prepared from tap water with a Barnstead D8902 cartridge of mixed resin. It was used as wash water and as the dispersion medium for silica.
Temperature and pH were measured with a Cole Parmer Chemcadet Model 5986-60 combination pH/ORP (oxidation–reduction potential) meter. Temperature readings were occasionally checked against those of a mercury-in-glass thermometer. The pH meter was calibrated against standard buffers supplied by Fisher Scientific.
The absolute viscosity of deionised water containing 200 mg L−1 NaCl was measured to facilitate determination of the zeta potential and particle size distribution of as-received silica. The viscosity was measured with a Cannon Fenske routine viscometer, no. 50-M309, as prescribed in Standards D 445 and D 446 (ASTM, 1996).
AC/EC apparatus
The electrodes were 0·7 mm thick rectangular plates measuring 22×20 cm and were fabricated from 6061-T6 aluminium alloy. Electrocoagulation was performed in the 5·7-L Plexiglas cell sketched in Fig. 1. Two spigots (not shown in the diagram), each equipped with a sample cock, were fitted at X and Y to facilitate sampling of the supernatant water and electrocoagulated slurry, respectively. The electrodes were held snugly in 1-mm wide grooves that were cut 0·5 cm apart along the top edge of one end wall of the cell and along a removable Plexiglas bridge placed near the other end wall. The bridge itself was slotted near its ends to ride the side walls of the cell. A Plexiglas comb was placed on the base of the cell in contact with the grooved end wall. The bottom edges of the electrodes fitted snugly into the grooves of the comb to maintain a constant electrolytic area of 299·1 cm2, as well as to prevent contact between electrodes when agitation was applied. An overhead motor powered a Teflon-coated paddle assembly which incorporated an axial-flow impeller, 5 cm in diameter.
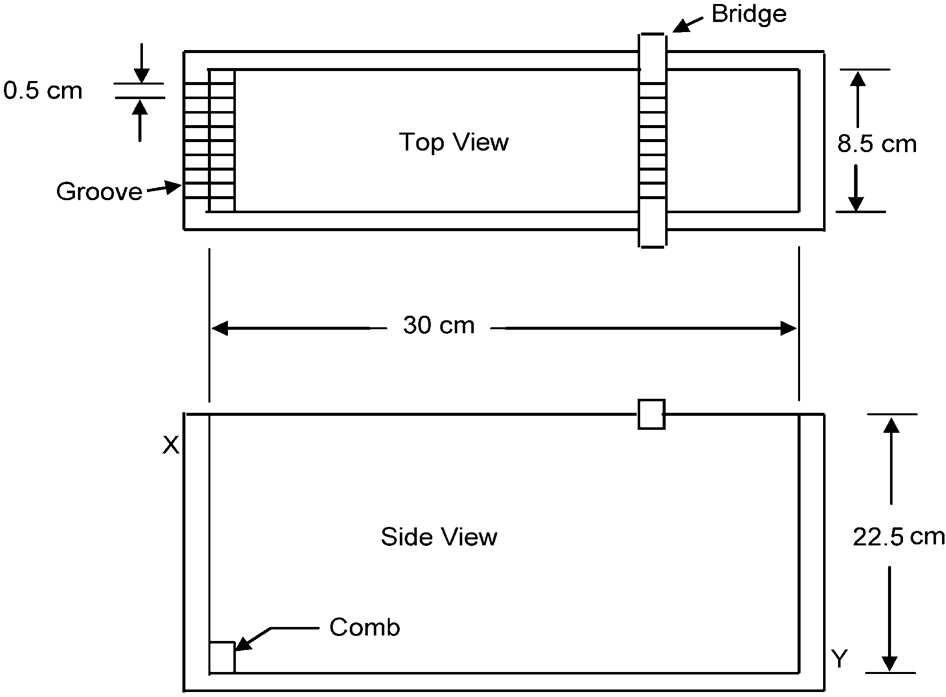
Sketch of electrocoagulation cell
Electrocoagulation methodology
In the preparation of feed water, 800 mg of NaCl was dissolved in 4·0 L of deionised water. The temperature of the resulting solution was adjusted and noted. The electrodes were installed in the electrocoagulation cell and connected to the power supply (Fig. 2). A variable transformer controlled the output voltage and, hence, the current to the cell. The transformer was a Powerstat Model 136B from The Superior Electric Co. of Bristol, Connecticut, USA. A current transformer (not shown) enabled the magnitude of the current to be displayed digitally by a Novatron ammeter. A Novatron voltmeter indicated the AC voltage in digital readout.
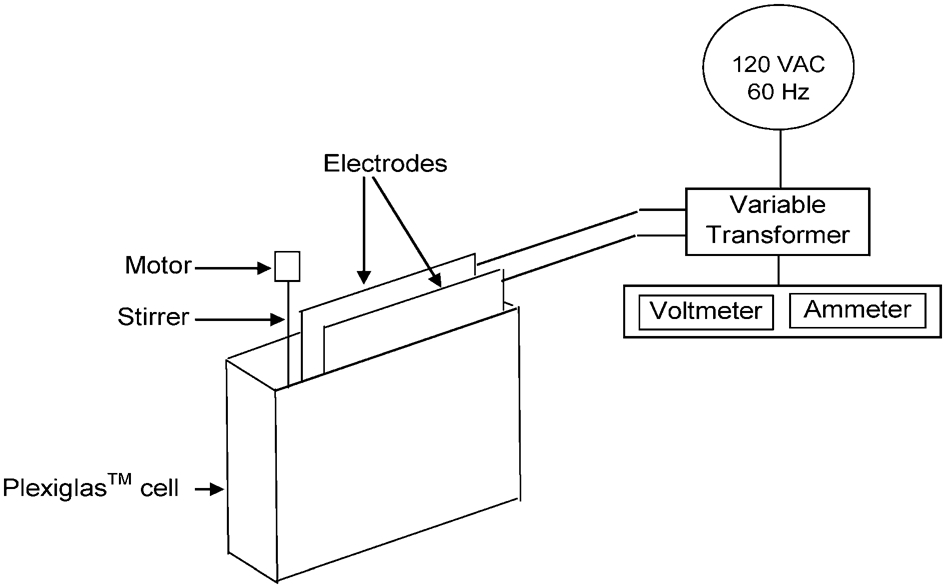
AC/EC circuit
In preparation for electrocoagulation, 210·5 g of as-received silica was dispersed in the 4·0 L of feed water in the cell to a concentration of 5·0 wt-% solids. After the suspension temperature and pH had been recorded, timing and the current flow were started, the current being maintained by continual manual adjustment of the voltage. As electrocoagulation proceeded, the suspension temperature and applied voltage were recorded every minute. The test conditions were: AC/EC mode, direct; AC/EC time, 15–120 min; feed water temperature, 21·1–21·4°C; feed water pH, 8·45–8·50; current density, 70·2 A m−2; AC frequency, 60 Hz; number of electrodes, 2; electrode separation, 3·0 cm; and impeller tip speed, 1·73 m s−1.
At the end of the electrocoagulation time, the current flow was stopped, and the electrodes, bridge and comb were removed. The electrodes were cleaned with fine steel wool, washed with tap water, and rinsed with acetone for quick drying.
[Al T ] determination
In preparation for analysis, one drop of concentrated HCl was added to each feed water and supernatant water sample to prevent aluminium precipitation. The samples were analysed for total aluminium concentration by atomic absorption spectrophotometry on a Perkin Elmer 4000 double beam analyser. The results were compared with those obtained for AC/EC-treated water in the indirect study (Ifill and Etsell, 2011b).
Results and Discussion
Retention time
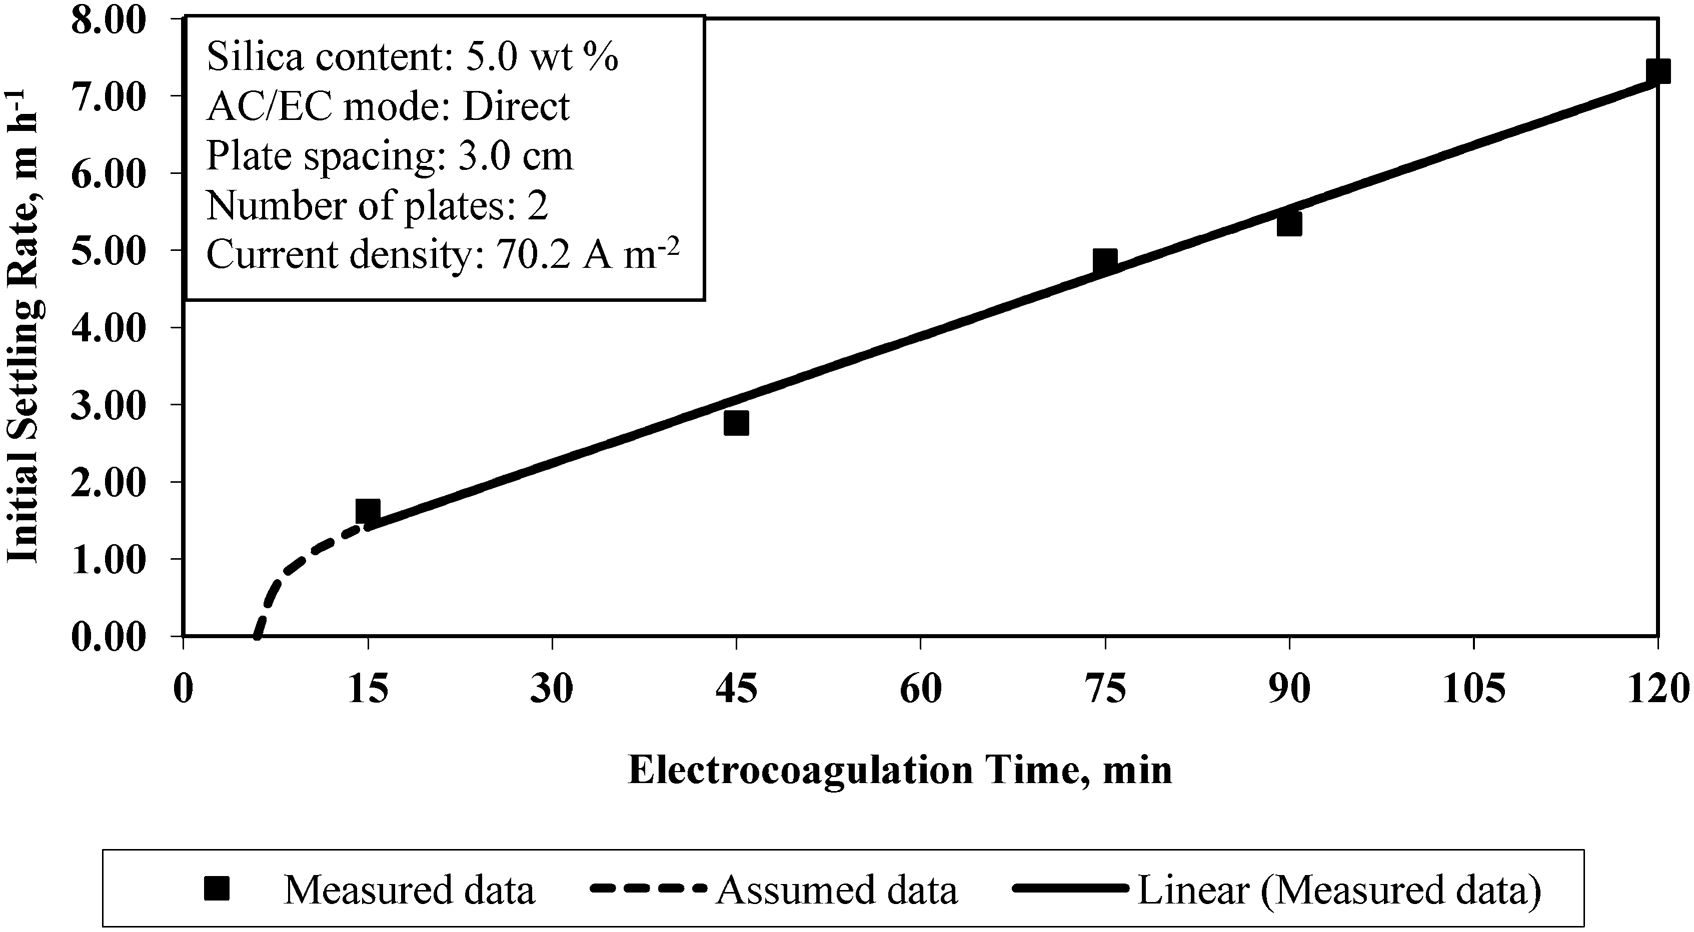
The initial settling rate of the directly electrocoagulated silica increased linearly with electrocoagulation time, as illustrated in Fig. 3. The measured rates increased from 1·62 m h−1 (2·7 cm min−1) after 15 min to 7·32 m h−1 (12·2 cm min−1) after 120 min. Hence, in this time range, the initial settling rate increased by 0·054 m h−1 per minute of AC/EC. The maximum attainable initial settling rate (>7·32 m h−1) would be achieved at t>120 min. The assumed data in Fig. 3 describe the manner in which the settling behaviour is likely to have changed in the initial 15 min. In a test under quiescent conditions, the onset of coagulation was observed after about 8 min of AC/EC (Ifill and Etsell, 2011a). This result indicates an induction period of <8 min, plus allowance for time taken for the sludge line to become defined clearly enough to be observed.
Settling behaviour of electrocoagulated silica
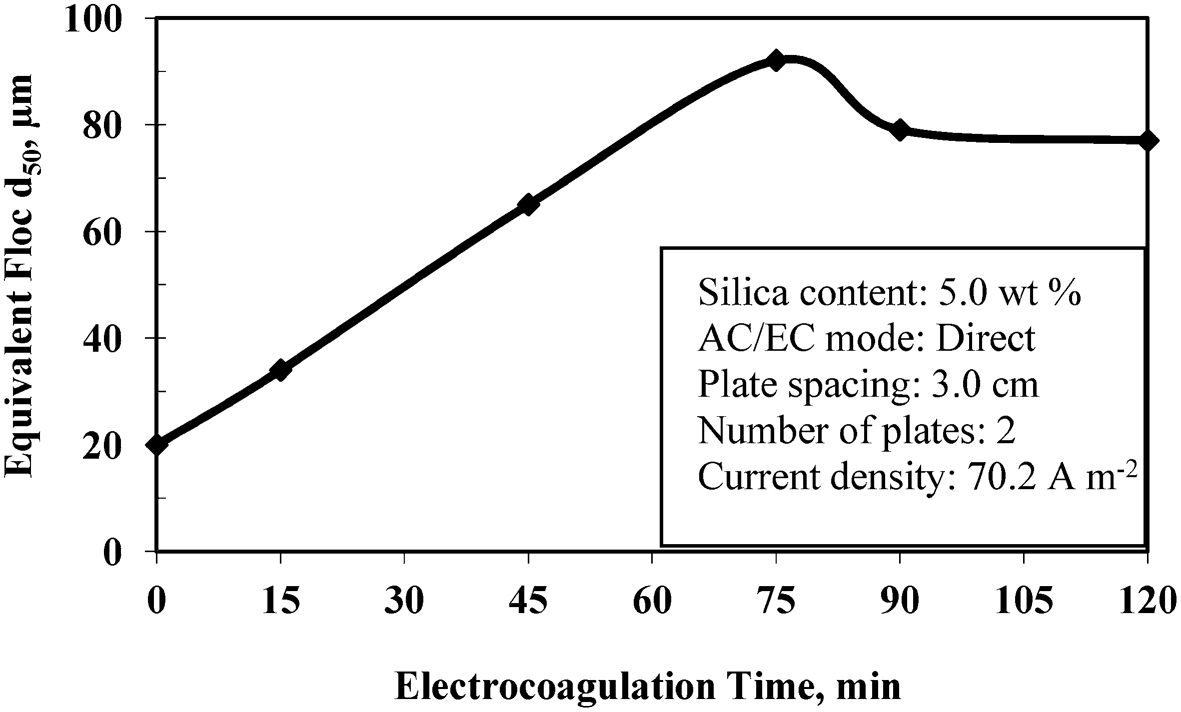
The d50 sizes of electrocoagulated silica are compared with that of as-received silica (t = 0) in Fig. 4. From the as-received d50 of 20 μm, the d50 of the electrocoagulated silica increased linearly to 92 μm (75 min). Then, floc fragmentation occurred such that longer electrocoagulation times produced smaller d50 sizes: 90 min, 79 μm; 120 min, 77 μm. Despite the smaller d50, however, the initial settling rate continued to increase for t>75 min. This apparent contradiction is resolved with the aid of the bulk density and porosity (see calculations in Appendix) of the electrocoagulated sediments reported in Table 1. The sediment properties (e.g. porosity) are considered to provide a measure of the floc properties.
Floc d50 of electrocoagulated silica
Calculated characteristics of electrocoagulated sediments
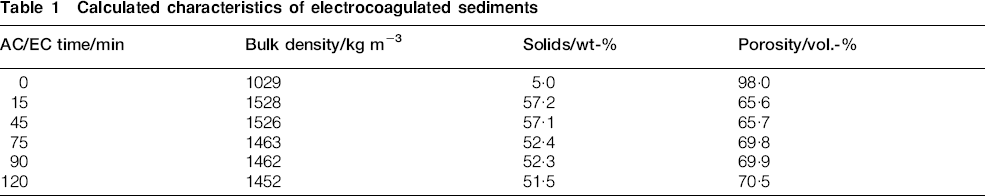
The water content in the feed suspension comprised 98·0 vol.-%. From 15 to 45 min of electrocoagulation, the porosity in the sediment (and, hence, in the flocs) was unchanged at ∼66 vol.-%, while the floc d50 increased from 34 to 65 μm (Fig. 4). Therefore, the flocs appear to have been following a particular growth pattern (e.g. fractal). The sediment porosities may have been too high for microfloc formation from primary silica particles to constitute the predominant growth mode. Rather, the predominant mode appears to have been Region 2 growth between primary particles and microflocs. Electrocoagulation times of 75 and 90 min engendered a somewhat higher porosity of ∼70 vol.-%. In this time domain, therefore, it is inferred that region 2 growth proceeded predominantly by multiple level aggregation. It is evident from Fig. 4 that floc fragmentation occurred when the electrocoagulation time exceeded ∼75 min, the limiting floc size being ∼125 μm. It is clear that, for t≤∼75 min, the initial settling rate was controlled by floc size.
The pulp density of the feed suspension was 1029 kg m−3, from which sediment of bulk density 1528 kg m−3 was produced after 15 min of electrocoagulation (Table 1). The floc density decreased with AC/EC time as the floc size and, hence, the porosity increased – a well known phenomenon (Ayyala et al., 1995; Gregory, 1993; Tambo and Watanabe, 1979). Between 75 and 90 min of AC/EC, the floc fragmentation effected no significant change on porosity or bulk density; yet, at the same time, the initial settling rate increased. Together, these observations suggest that there were reaggregation and rearrangement of floc fragments (Zbik et al., 2008), marking a transition in growth mode from Region 2 to Region 3. Extension of the electrocoagulation time to 120 min caused the porosity to increase to ∼71 vol.-% and the bulk density to decrease to ∼1450 kg m−3. Reaggregation and rearrangement of the floc fragments and microflocs continued in a manner which facilitated the rate of drainage of water from the flocs, enabling further increase of the initial settling rate. Thus, the increased floc porosities for t>75 min resulted, not from floc growth but, rather, from enlarged pores and a thinner framework. This explains why the flocs were mechanically strong only at smaller sizes (see plateau, Fig. 4) and why the bulk density decreased (Table 1). Hence, for electrocoagulation times exceeding 75 min, the initial settling rate was controlled by floc morphology. The limiting floc size after 120 min of AC/EC was about 120 μm, and the solids content in the sediments decreased from 57·2 wt-% (t = 15 min) to 51·5 wt-% (t = 120 min).
Anode passivation has been reported to occur during direct current electrocoagulation (DC/EC) (Mollah et al., 2001). With operating time, the oxide layer becomes thicker, thus increasing the resistivity of the anode and the proportion of the input energy lost, due to passivation. These effects may be minimised or eliminated by reversing the electrode polarity periodically (Donini et al., 1994; Jiang et al., 2002). In AC/EC, by contrast, the polarity reversal (119 times per second) prevented passivation from occurring.
Time-pH profiles
Variations of pH with electrocoagulation time are graphed in Fig. 5 for the feed suspension, electrocoagulated pulp and supernatant. Initially, during feed water preparation under continuous agitation, carbon dioxide was absorbed from the atmosphere, as in reaction (1). Consequently, the pH was observed to fall by 2 to 3 units.


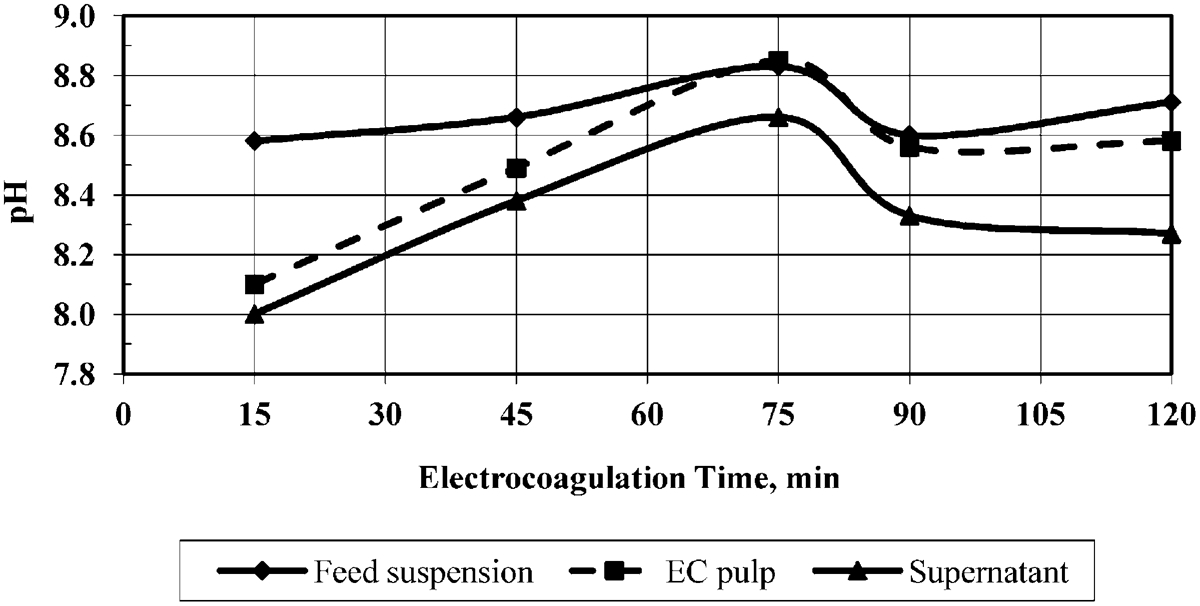
Pulp pH variation with AC/EC time
During the initial 15 min of AC/EC, the pH dropped to 8·1. Hence, processes producing H+ ions and those consuming OH− ions predominated. When the electrocoagulation time exceeded 15 min, the processes consuming H+ and those releasing OH− gained prominence, raising the pulp pH to a maximum of 8·9 at t≈75 min. Thereafter, as a result of aluminium hydroxide precipitation, the pH fell to 8·6 where it remained in steady state.
Between ∼70 and 85 min, no net change in pH resulted; otherwise, the pH of the electrocoagulated pulp was below that of the feed suspension. The pH profile of the electrocoagulated pulp was mimicked by that of the supernatant, the pH of which was always lower.
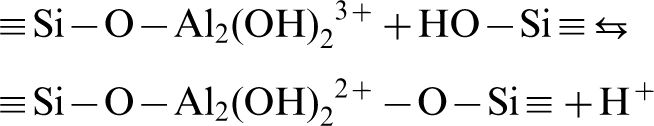
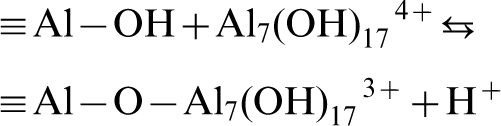
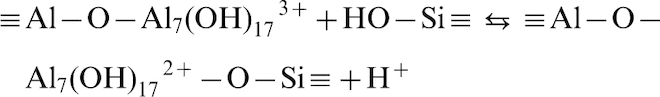
For t≤75 min, reactions contributing to pulp pH changes included: reactions (1)–(3); electrode reactions (e.g. reactions (4) and (5)); Al3+ complexation (e.g. reaction (6)); specific adsorption of aluminium complexes at the silica surface (e.g. reactions (7) and (8)); and interparticle bridging (e.g. reaction (9)). With time, however, the pH lowering reactions declined in dominance in favour of pH raising reactions, causing the pulp pH to reach the value of the feed suspension.


Aluminium deportment
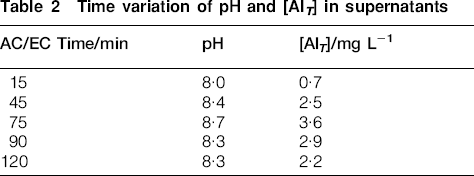
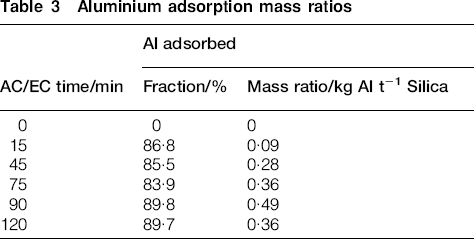
The measured dosages ranged from 0·10 kg Al t−1 silica (15 min) to a maximum of 0·54 kg Al t−1 silica (90 min); i.e. 0·01 to 0·05% of the silica mass. From these dosages, Table 2 shows that [Al T ] increased from 0·7 mg L−1 (15 min) to a maximum of 3·6 mg L−1 (75 min), and declined to 2·2 mg L−1 after 120 min of electrocoagulation. It can reasonably be assumed that the total aluminium released from the electrodes during direct electrocoagulation equals that released to the treated water in the indirect mode in the same time (see Ifill and Etsell, 2011b), facilitating the calculation of Al adsorption mass ratios. Hence, Table 3 shows that 84 to 90% of the total aluminium released from the electrodes was adsorbed by the silica. The adsorption mass ratios ranged from 0·09 to 0·49 kg Al t−1 silica (or 0·01 to 0·05% of the silica mass) during 15 to 90 min of electrocoagulation. For t≤75 min, the rate of increase of the adsorption ratio corresponded to increasing floc size (Fig. 4) and initial settling rate (Fig. 3). From the adsorption mass ratios reported in Table 3, it could be argued that the further increase at 90 min was a consequence of the larger adsorption surface created by floc fragmentation. However, the ratio diminished from 0·49 kg Al t−1 silica at 90 min to 0·36 kg Al t−1 silica at 120 min of electrocoagulation. Meanwhile, the initial settling rate was continuously enhanced.
Time variation of pH and [Al T ] in supernatants
Aluminium adsorption mass ratios
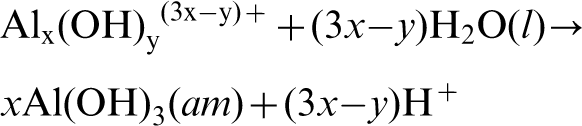
The foregoing argument suggests that the decrease in aluminium concentration in the 90 and 120 min supernatants resulted from precipitation. Table 2 shows that [Al
T
] increased with pH from 15 to 75 min of electrocoagulation. At 90 and 120 min, however, the pH dropped, as did [Al
T
]. This behaviour is characteristic of metal precipitation reactions, as generalised by reaction (10).


Zeta potential
The effect of direct electrocoagulation on the zeta potential of silica is depicted in Fig. 6. At t = 0, the zeta potential was that of as-received silica in deionised water containing 200 mg L−1 NaCl at pH 8·5 (the pH of the feed water). After 15 min of electrocoagulation, the zeta potential had decreased (i.e. had become less negative) from −21·4 mV by only ∼2 mV. Yet, the initial settling rate had increased by over three orders of magnitude, from 9·6×10−4 m h−1 (1·6×10−3 cm min−1) (as received) to 1·62 m h−1 (2·7 cm min−1) (electrocoagulated). These results show that the destabilisation of suspended particles can occur with hardly any measurable decrease of the zeta potential (Ofir et al., 2007), when destabilisation is characterised by specific adsorption (Ifill and Etsell, 2011a). Nevertheless, Fig. 6 shows that the zeta potential ultimately decreased (i.e. became less negative) with electrocoagulation time and, apart from a small reversal of 4 mV between 75 and 90 min, reached −1 mV after 120 min.
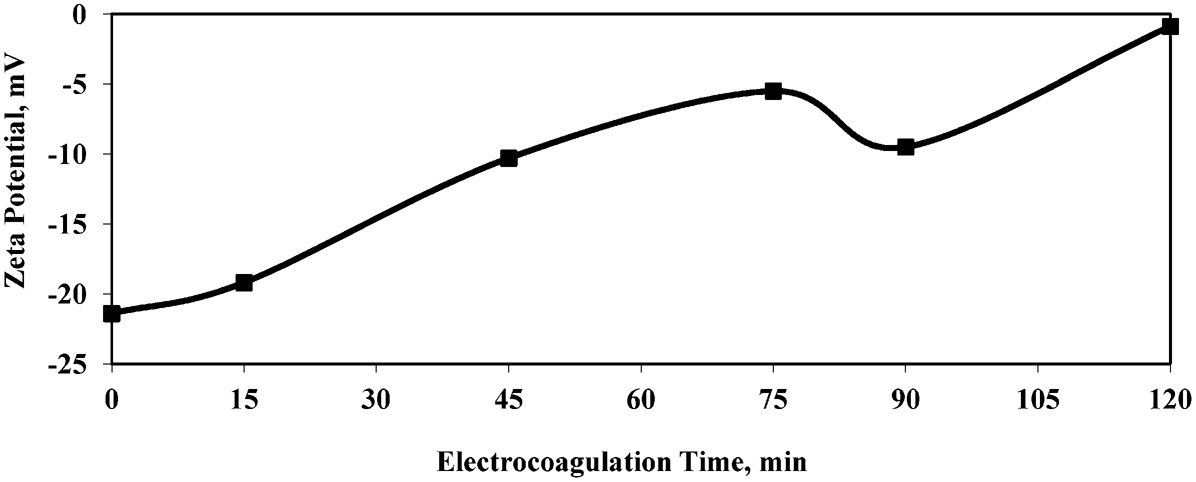
Zeta potentials of electrocoagulated silica
The Al(OH)3(am) precipitate was found to have a zeta potential of +9·3 mV, consistent with reports (Amirtharajah and O'Melia, 1990; Letterman et al., 1982; O'Melia, 1986; Tambo, 1991) that aluminium hydroxide precipitate particles carry a small positive charge in the pH range of this study. Reactions (14) and (15) illustrate the involvement of Al(OH)3(am) in floc formation and growth by interparticle bridging, with Reaction (14) exemplifying the acquisition of a positive charge by Al(OH)3(am) particles.
Energy input
In the electrocoagulation tests, the initial temperature was controlled, but the temperature rise generated by Joule heating was not. Table 4 data, which were not optimised, show temperature increases that ranged from 4·8 to 21·5°C for AC/EC times ranging from 15 to 120 min.
Operating data (not optimised)
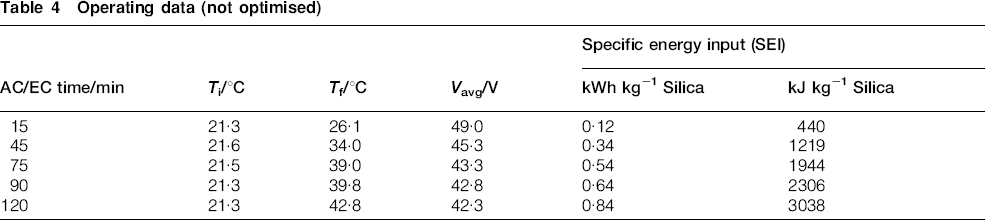
The voltage required to maintain the current decreased with electrocoagulation time as the water warmed up and became more conductive. Time averaged voltages (Vavg) decreased with time from 49 V after 15 min to 42 V after 120 min. From the average voltage, the current and AC/EC time, the energy input was calculated. On the basis of a unit mass of silica, it was termed the ‘specific energy input’ (SEI). As expected, the SEI increased with time, thus: 0·12–0·84 kWh kg−1 (440–3038 kJ kg−1) silica.
‘Shelf life’ of electrocoagulated silica
Silica, that had been directly electrocoagulated for 90 min, was air dried and kept for over a year. After it was repulped with deionised water, it settled quickly, illustrating that the enhanced settling behaviour had remained intact. The initial settling rate was not measured. Filtration of the slurry produced a cake that contained no lumps. When mixed with an equal mass (dry basis) of as-received silica and repulped with water to 5·0 wt-% solids, all of the silica settled. This was, in effect, a special case of indirect electrocoagulation. Hence, recycling a portion of the thickened, electrocoagulated pulp to the feed in an industrial application would reduce the required AC/EC time and energy input, while accelerating floc growth rates.
In another qualitative test silica, that had been electrocoagulated for 90 min and air dried two years previously, was used to successfully coagulate a sample of fluid fine tailings (FFT) from an oil sands plant. MacKinnon (1986) reported the equivalent diameter of silt and clay particles in the FFT (previously known as ‘mature fine tailings’ or MFT) to be <22 μm, with the clay particles being <2·8 μm. Hence, the results of this test highlight the potential usefulness and flexibility of electrocoagulated silica as a coagulant for solids in industrial waste streams. Since silica is an inexpensive solid which does not, per se, introduce any toxic constituents, the electrocoagulated material might be convenient for use as an industrial coagulant. Inherent in the use of electrocoagulated silica (or other solids) is the flexibility it lends to the operator; that is, the option of electrocoagulating a waste stream either directly, or indirectly with AC/EC-treated solids.
It is noteworthy that, in February 2009, the Energy Resources Conservation Board of Alberta, Canada, issued Directive 074 which, among other things, mandated that all mineable oil sands operations reduce their FFT inventories. The notoriously poor settling behaviour of these tailings could be enhanced by AC/EC towards compliance with the directive.
Conclusion
Conclusions derived from the test work are summarised below.
In the range of 15–120 min of direct electrocoagulation, the initial settling rate increased linearly by 0·054 m h−1 per minute of treatment. The maximum attainable initial settling rate exceeds 7·32 m h−1 at t>120 min.
For AC/EC times of t⩽75 min, the initial settling rate was controlled by floc size. At t>75 min, control was exercised by the floc morphology.
Aluminium precipitation became significant shortly after 75 min of AC/EC time had elapsed.
The aluminium dosage was adsorbed as it entered the pulp, and could be considered as having been metered continuously into the pulp.
Aluminium precipitation was not deleterious to the enhancement of the silica settling behaviour.
Aluminium adsorption fractions ranged from 84 to 90% of the dosage, with the maximum adsorption mass ratio being 0·5 kg Al t−1 silica (i.e. 0·05% of the silica mass).
Air dried, electrocoagulated silica retained enhanced settling characteristics two years after treatment, and performed as an effective coagulant of as-received silica and fine oil sands tailings.
Footnotes
Appendix
Acknowledgement
The authors gratefully acknowledge the financial support provided by NSERC and Luscar Sterco for this work.