
Abstract
Leach slurries of alkaline nature often show very low rate of filtration due to high pulp viscosity contributed by dissolved solutes in solution and very fine grained nature of the unleached solids. Maximisation of filtration performance generally needs exhaustive experimentation involving various parameters which influence the solid–liquid separation process. The study reported in this paper pertains to optimisation of parameters in vacuum filtration of uranium bearing alkaline leach slurry generated from a brecciated limestone ore using response surface methodology. The d80 size of solids in the leach slurry is 60 μm and the pH of the pulp is 9·5–10. Initial screening of various commercial flocculants of anionic, cationic and non-ionic nature was carried out using the capillary suction time (CST) as basis. Minimum CST was achieved using a combination of anionic and non-ionic flocculant namely the Indfloc (IF) 477 and Guargum. The dosages of the flocculant combination and the slurry temperature were optimised to achieve maximum rate of filtration with optimal cake moisture under vacuum filtration conditions.
Keywords
Introduction
The renewed interest in nuclear power as an electricity source stems from the worldwide urge to use carbon free energy for power production. 1 The two predominant commercial nuclear power reactor variants in operation worldwide are the pressurised heavy water reactor and the light water reactor (http://www.nei.org/Knowledge-Center/Nuclear-Statistics/World-Statistics/World-Nuclear-Power-Plants-in-Operation). U235 isotope is the chief fissile element in both these reactors, and this isotope occurs in natural uranium, which is a mixture of U238 (99·2739%), U235 (0·7205%) and U234 (0·0056%). Conventional uranium ore deposits form the chief source for natural uranium. 2
Uranium is recovered from different ores by hydrometallurgical processing. 3 The generic flowsheet for uranium ore processing consists of comminution aimed at liberation or release of mineral phases from the host rocks, chemical leaching, separation of uranium laden solution from inert solid gangue, purification and precipitation of dissolved uranium as yellow cake or crude uranium concentrate. 3, 4 The yellow cake is refined further for production of nuclear grade uranium metal or its compounds. Of the various processing steps in the flowsheet for the production of nuclear grade uranium, the stages up to the production of yellow cake are very important for the simple reason that the tenor of the majority of uranium ore deposits the world over is in the range of 0·05 to 0·5% 2 and the milling operations therefore involve handling of huge volumes of ore slurry. Some of the unit operations in the ore processing flowsheet, such as the initial comminution and the solid–liquid separation stages, are very cost intensive. 4 These two operations together consume ∼45% of the post-mining expenditure. Therefore, sustained research towards improving the efficiency of the cost intensive operations is imperative particularly in the current era when uranium metal prices are low due to a variety of reasons. 4–6
Uranium minerals are leached from the ores by either dilute acidic or alkaline leachants. 2, 3 The choice of leachant depends upon the nature of gangue minerals constituting the ore. Adoption of alkaline leaching is practiced if the ore has significant content of acid consuming gangue minerals. Since alkaline leaching of uranium is highly selective, grinding of the ore to very fine size is inevitable to ensure adequate liberation of uranium mineral phases from the host gangue. Thus, the viscous nature of alkaline leach liquors coupled with very fine grind size of solid particles makes the solid–liquid operation an arduous task. Solid–liquid separation of the leach slurry is generally carried out by counter current decantation (CCD) and vacuum filtration (VF). However, the choice among these alternatives depends upon various factors, chiefly the concentration of uranium in the leach liquor and the granulometry of solids. Although the CCD process is a simple operation, it always leads to dilution of the leach liquor at the product discharge end. Thus, the application of CCD on low grade ores or lean grade liquors is not favoured. Vacuum filtration separation of uranium bearing solution from leach slurry is the preferred choice for lean grade leach liquors. Vacuum filtration when carried out in counter current fashion provides additional advantages like faster and efficient washing of the leach residue with minimum fresh water/solution input. 4, 5
The efficiency of the filtration process depends on the ore geology, granulometry, nature of lixiviants used, desired cake moisture and thickness, wash solution composition and vacuum applied during filtration. 5, 7 The problems associated with filtration of slurries with very fine size solids has been addressed by addition of flocculants and dewatering surfactants and even carrying out the filtration at high temperature. 8–10 The first effective flocculants used in uranium milling operations were guargum products, 4 which were later followed using several commercial polyacrylamide, polyethylene oxide flocculants like Separan and Aerofloc. 11–13 Today a number of flocculants are available in commercial market (eg, https://www.cytec.com; http://www.kemira.com) claiming efficiency in ore processing industry including uranium. However, ore specific studies are required as the solution chemistry of leach solution differs from ores of one region to the other.
This paper gives results of application of response surface methodology (RSM) in optimising the flocculant assited VF of fine grained uranium laden leach slurry consisting of predominantly calcite. Response surface methodology and central composite rotatable design (CCRD) of experiments are widely used statistical tools for process optimisation in many fields including mineral processing. 14–16 Since the leach slurry contains very fine size particles along with highly viscous solution phase, the process of attaining industrially acceptable rate of filtration with minimum cake moisture is a challenge, and it is inevitable to use flocculants and/or surfactants. The studies reported here present interesting results obtained using flocculant blends instead of single flocculant to enhance the filtration performance. The benefit of synergism of flocculant blends for solid–liquid separation has been reported alumina, iron ores and kaolin minerals earlier, 17–20 but similar studies on uranium bearing slurry systems are being reported here for the first time.
Response surface methodology
Response surface methodology is a collection of statistical and mathematical methods that are useful for modelling and analysing engineering problems. In this technique, the main objective is to optimise the response surface that is influenced by various process parameters. Response surface methodology also quantifies the relationship between the controllable input parameters and the obtained response surfaces. The design procedure for RSM consists of the following steps: 14–16 (i) performing a series of experiments for adequate and reliable measurement of the response of interest, (ii) developing a mathematical model of the second order response surface with the best fit, (iii) determining the optimal set of experimental parameters that produce a maximum or minimum value of response and (iv) representing the direct and interactive effects of process parameters through two and three-dimensional (3D) plots.
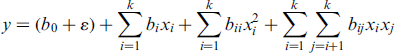
If all variables are assumed to be measurable, the mathematical representation of the response surface can be expressed as follows


Central composite rotatable design
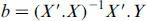
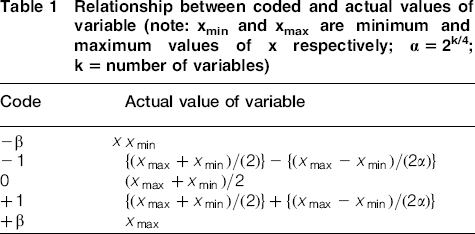
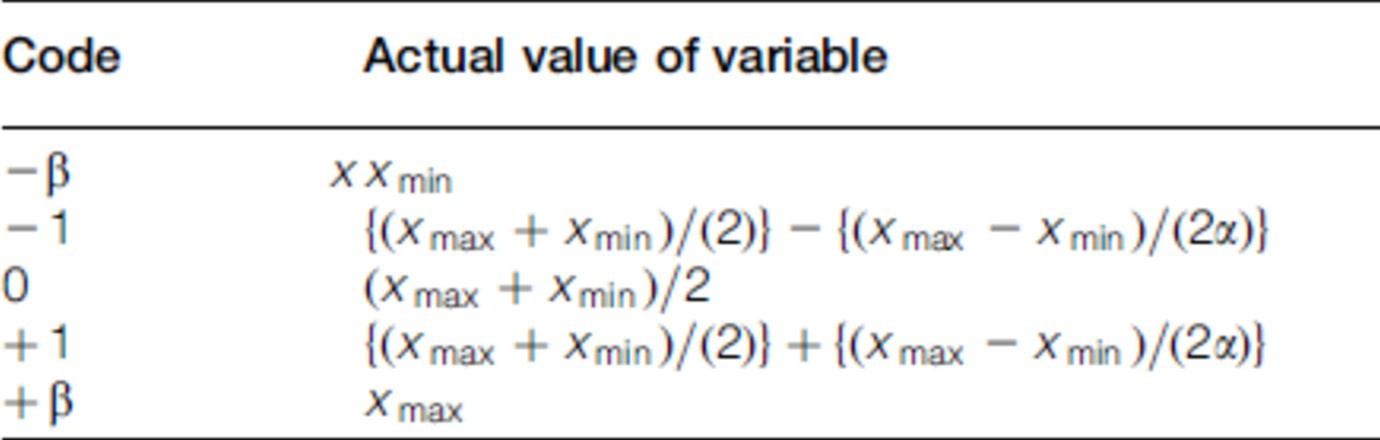
The first requirement for RSM involves the design of experiments to achieve adequate and reliable measurement of the response of interest. To meet this requirement, an appropriate experimental design technique has to be employed. The experimental design techniques commonly used for process analysis and modelling are the full factorial, partial factorial and CCRDs. A full factorial design requires at least three levels per variable to estimate the coefficients of the quadratic terms in the response model. A partial factorial design requires fewer experiments than the full factorial design. However, the former is particularly useful if certain variables are already known to show no interaction. An effective alternative to factorial design is CCRD, originally developed by Box et al. 21 and improved upon by Box et al. 22 The CCRD gives almost as much information as a three-level factorial, requires many fewer tests than the full factorial design and has been shown to be sufficient to describe the majority of steady state process responses. The number of tests required for CCRD includes the standard 2k factorial with its origin at the centre, 2k points fixed axially at a distance, say β, from the centre to generate the quadratic terms and replicate tests at the centre, where k is the number of variables. The axial points are chosen such that they allow rotatability, which ensures that the variance of the model prediction is constant at all points equidistant from the design centre. Replicates of the test at the centre are very important as they provide an independent estimate of the experimental error. Thus, for the k variable system, the recommended number of tests at the centre is 2k, and the total number of experiments required is 2k+(2 × k)+2k. In CCRD, the experimental design is based on coded variables because it enables the investigation of variables with different orders of magnitude. Once the desired ranges of values of the variables are defined, they are coded at ± 1 for the factorial points, 0 for the centre points and ± β for the axial points. The codes are calculated as functions of the maximum and minimum of range of a given variable as shown in Table 1.
Relationship between coded and actual values of variable (note: xmin and xmax are minimum and maximum values of x respectively; α = 2k/4; k = number of variables)
Materials and Methods
Leach slurry
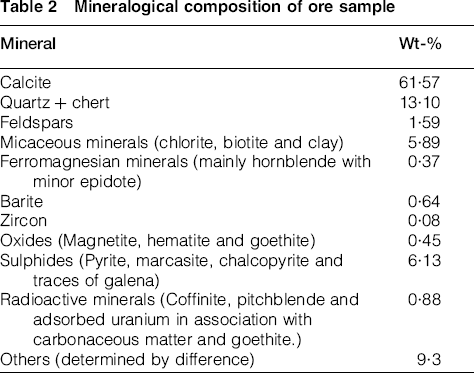
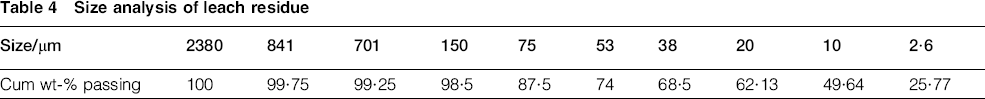
The leach slurry used for the test work is generated by processing a medium grade uranium ore of brecciated limestone type from southern part of India. The complete mineralogical composition is given in Table 2 and the partial chemical analysis of the ore in Table 3. The ore analysed 0·23% U3O8. About 60% by weight of the gangue is calcite, which is followed by quartz, being 10%. The ground ore was subjected to oxidative alkaline leaching using Na2CO3 as leachant and industrial oxygen as oxidant. The grind size of the ore and the dosages of the leachants were based on liberation of the mineral values and on parametric variation studies conducted to achieve maximum dissolution of uranium values. Table 4 gives the particle size analysis of the leach residue indicating presence of ∼68% by weight in sizes finer than 38 μm. The important solutes in the leach liquor (chemical) are: U3O8 1 g L− 1, Na2CO3 38·7 g L− 1, NaHCO3 15·3 g L− 1, Na2SO4 4·7 g L− 1 and total dissolved solutes 52·0 g L− 1.
Mineralogical composition of ore sample
Partial chemical analysis of ore sample

Size analysis of leach residue
Flocculants
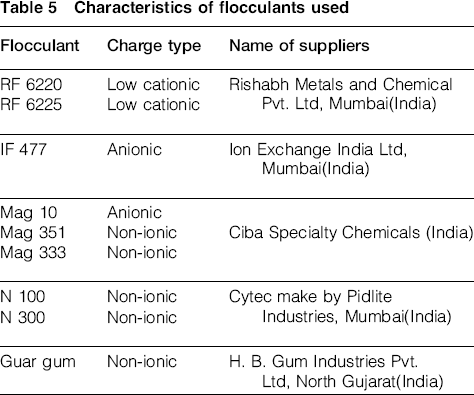
A number of commercially available polyacrylamide based industrial flocculants of anionic, cationic and non-ionic types were tested for their flocculation and filtration capabilities along with a natural nonionic flocculant, namely guargum. Characteristics of different flocculants investigated in the study are given in Table 5.
Characteristics of flocculants used
Measurement of capillary suction time
The filterability of the leach slurry with each of the commercial flocculant was accessed separately by measuring the capillary suction time (CST) 23, 24 on a standard CST apparatus (Type 304M Laboratory CST), supplied by Triton Electronics Ltd, UK, using 1·8 cm diameter reservoir. The CST filter paper, which was supplied by the equipment manufacturer, was used in all the CST measurements.
The CST apparatus (Fig. 1) consists of two transparent Perspex discs. The lower disc is recessed to a certain depth so that the filter paper slides into it completely. The upper disc is recessed at both longitudinal ends, which rests on the elevated arm of the lower disc in such a way so that the weight of the upper disc is taken only by the elevated arm of the lower disc and not by the filter paper. The force generated by capillary suction is much greater than the hydrostatic head within the funnel, so the test is relatively independent of the amount of slurry in the reservoir, as long as there is a sufficient amount to generate a CST measurement. The 18 mm steel reservoir slides into the central hole in the upper disc. At the underside of the upper disc two concentric circular marks are provided with probes to detect the radial movement of the wet and dry interfaces on the filter paper. Both flocculants solution were added dropwise into the slurry, which was stirred thoroughly for 2 min to ensure the proper distribution of the flocculant. The slurry is then poured into the central reservoir. The suction pressure of the filter paper then drains out the filtrate from the suspension. The apparatus automatically records the time (in seconds) taken by the interface between the wet and dry portions of the filter paper exposed to the column of the suspension, to travel between two concentric circles. The recorded time denotes the interval in the movement of the liquid front from the inner circular mark to the outer circular mark. The lower the value of CST the better is the filterability of the slurry. The values reported in this work are the averages of five measurements. The reproducibility of the readings was within ± 5%.
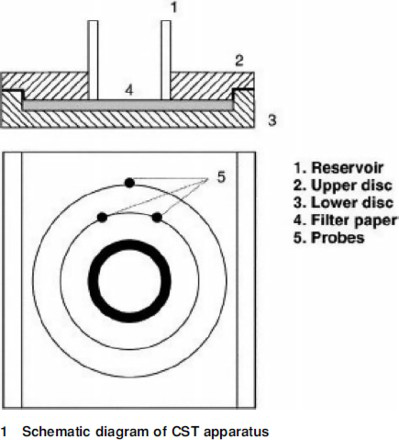
Schematic diagram of CST apparatus
Filtration
The flocculant or the combination of flocculants which gave the lowest CST was selected for use in VF of the leach slurry. The filtration studies were carried out using the standard top feeding procedure with a Buchner funnel in a laboratory VF set-up, using Whatman 41 filter paper. The set-up consisted of a 12 cm diameter Buchner funnel and a graduated measuring receiver to collect the filtrate. The measurement of vacuum applied was noted from the vacuum gauge attached to vacuum pump. A known quantity of leach slurry was taken in a 500 mL beaker, and flocculants were added drop wise under slow agitation of the slurry to form flocs, then entire material from beaker was transferred to the filtration unit. The volume of filtrate collected was recorded at regular time intervals. A drying time of 1 min, after the cake formation time, was maintained for all the tests. The cake moisture was measured in all the experiments by taking the difference in weights of wet and dry cake.
Design of experiments
Since the solution chemistry of the leach slurry, particularly the pH, cannot be altered as it disturbs the other downstream processes, the modelling and optimisation of solid–liquid separation or filtration process were confined to the two critical parameters, namely the dosages of the screened-in flocculants and the temperature of slurry during filtration. The performance observed with a given combination of experimental condition and parameter during filtration was evaluated on the basis of rate of filtration and the moisture content in the filter cake. The RSM was implemented using the commercial mathematical software DOE++ (Reliasoft).
Results and Discussion
Capillary suction time studies
Capillary suction time is an important diagnostic tool for measuring the dewatering characteristics of slurries. 23, 24 The CST test involves measuring the time to move a volume of filtrate over a specified distance as a result of the capillary suction pressure of dry filter paper. The CST test provides information regarding the ease of separating the water/solution portion from the solids portion of sludge. The CST is typically defined in units of time (seconds).
The results of the CST experiments carried out with various flocculants at a fixed dosage of 160 g ton− 1 of dry solids are given in Fig. 2a. The CST value of the leach slurry without (in situ) the addition of flocculant was 177·0 s. Although the addition of PAM based flocculants and Guargum led to a lowering of CST values of the leach slurry in comparison to the in situ slurry, the cationic type PAM flocculants gave relatively higher CST values than the anionic or non-ionic type PAM reagents investigated. The best performance among the various flocculants tested was with the flocculant IF 477 (anionic), followed by Guargum. IF 477 gave a CST of 60 s, while the corresponding value for Guargum was 88 s.
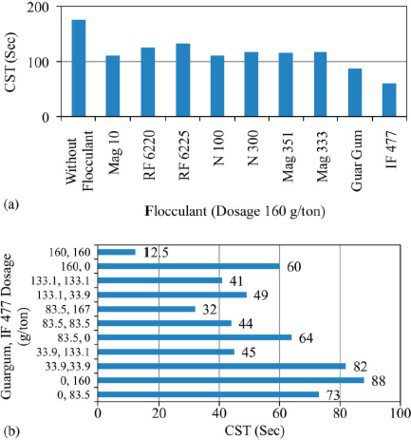
a capillary suction time observed with various flocculants on alkaline leach slurry; b CST observed with IF 477 and Guargum flocculants combination
Natural ores or leach residues are a heterogeneous mixture of minerals. The process of flocculation of mineral particles proceeds by two general mechanisms called charge patching and bridging. 8, 9, 25 The former materialises when the surface charge on the mineral is opposite to that of the charge of the flocculant. Bridging phenomenon in flocculation occurs upon adsorption of the segments of flocculant polymers onto the surfaces of more than one mineral particle resulting in formation of flocs. In the case of the leach slurry under investigation, the surface charge on major gangue minerals, calcite and quartz, in the pH range of 9–10, determines the nature of adsorption of the flocculants leading to floc formation followed by accelerated settling. Ofori et al. 26 and Somasundaran et al. 27 point out that the isoelectric point of calcite ranges from 8·2 to 11·3 depending on the partial pressure of carbon dioxide in equilibrium with the system. Similarly, the surface of quartz is highly negatively charged in the alkaline pH range as the isoelectric point is ∼pH2·0. 28 Interestingly, the lower CST values observed with non-ionic and anionic flocculants in the present studies can be explained on the basis of adsorption of dissolved metal ions, originating from the ore, on the surface of various minerals constituting the leach residue. The leach slurry has both the cationic and anionic species in the aqueous environment surrounding the mineral particles. The electrostatic adsorption of surface active cationic species like Na+ and Ca(OH)+ on the negatively charged surface of minerals like calcite and silica leads to charge reversal or even lowered negative charge. Such a phenomenon has been reported in many mineral systems/ores. 9, 25–27 The adsorption of anionic flocculants on positively charged mineral surfaces is attributed to the electrostatic interaction between the negatively charged COO( of PAM molecule and the counter charge present on mineral particles. 9 In the case of non-ionic polymers, the driving force for adsorption is hydrogen bonding between the positive sites of mineral surface and the primary amide and carbonyl groups of PAM flocculant. 9, 26, 27 The use of non-ionic PAMs as flocculating agents has the additional advantage of the absence of strong intra- or intermolecular electrostatic repulsion, which is a common phenomenon with anionic flocculants.
The results of the studies carried out to understand the synergistic effect of adding IF 477 and Guargum together at different dosages are given in Fig. 2b. It is observed that combination of flocculants provides a much lower CST than when added singly. The lowest CST of 12·5 s was achieved when 160 g ton− 1 each IF 477 and Guargum were added. The results for synthetic mineral mixtures reported by Marcin et al., 17 Ahro et al., 18 Fan et al. 19 2002 and Besra et al. 20 show that the beneficial impact of polymer blends in flocculation is due to two principle mechanisms: (i) adsorption of the first polymer leads to the modification in the characteristics of mineral surface sites resulting in the provision of selective adsorption sites for the second polymer; and (ii) side blocking action consisting of blocking of surface sites of a given mineral by first polymer paving way for the second polymer to adsorb on other minerals. However, the situation in real systems like the present case is more complicated, and more detailed studies are essential to understand the mechanism involved.
Filtration studies
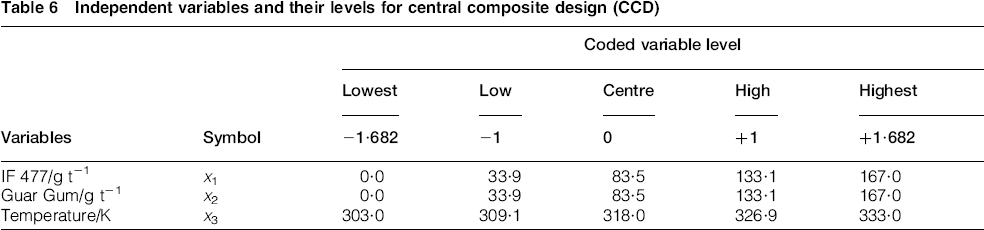
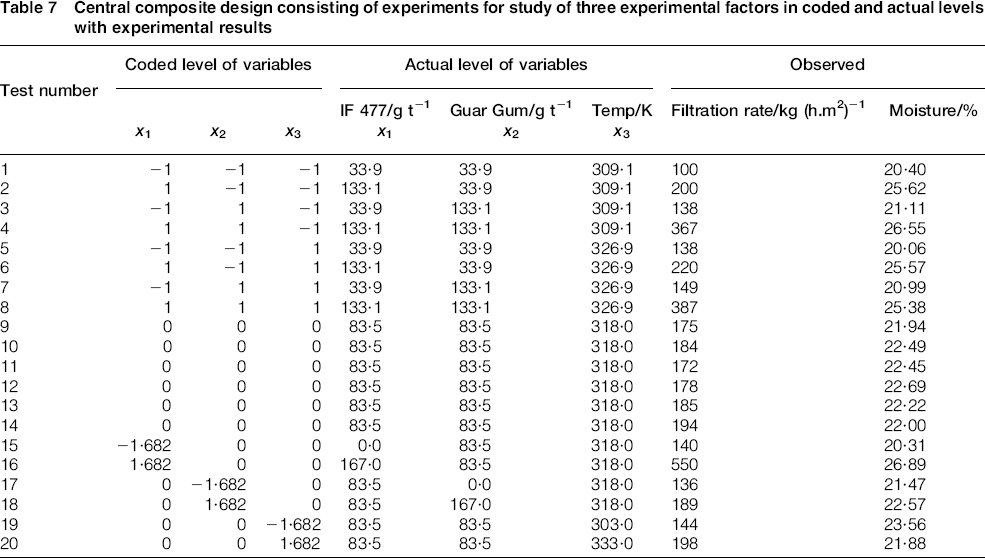
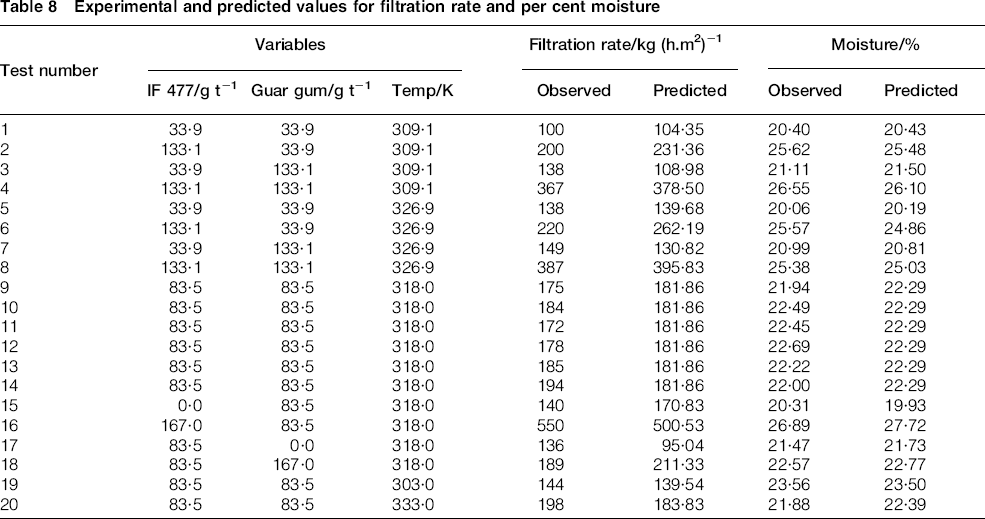
The filtration of alkaline leach slurry was carried out using the two flocculants that gave the lowest CST values, namely IF 477 and Guargum, at varying pulp temperatures. The dosages of the two flocculants were varied in the range of 0–167 g ton− 1 and temperature of the pulp between 303 and 333 K. The total number of experiments necessary for studying the three parametric variations works out to be 20[2k+(2 × k)+2k = 20, for k = 3]. Applying the relationships in Table 1, the values of the codes of the three variables were calculated as shown in Table 6. The coded values were used to determine the actual levels of the variables for each of the 20 experiments as shown in Table 7. Each run was performed in duplicate and the values of filtration rate and cake moisture given in Table 8 are the average of two sets of experiments. The experimental values of the response functions were fitted to a full quadratic second order equation by applying multiple regression analysis using the DOE++ optimisation software and the predicted values generated. Validation of the models was finally investigated by performing two replicated tests.
Independent variables and their levels for central composite design (CCD)
Central composite design consisting of experiments for study of three experimental factors in coded and actual levels with experimental results
Experimental and predicted values for filtration rate and per cent moisture
Construction of model equations
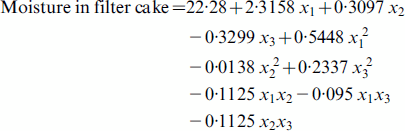
The model equations representing the rate of filtration and cake moisture is expressed as functions of IF 477 dosage (x1), Guar gum dosage (x2) and filtration temperature (x3) for coded units as below
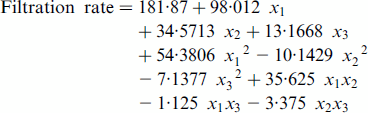
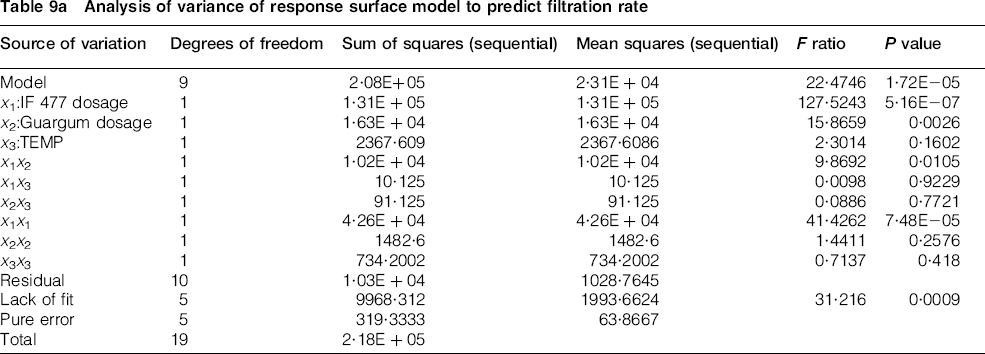
Analysis of variance of response surface model to predict filtration rate
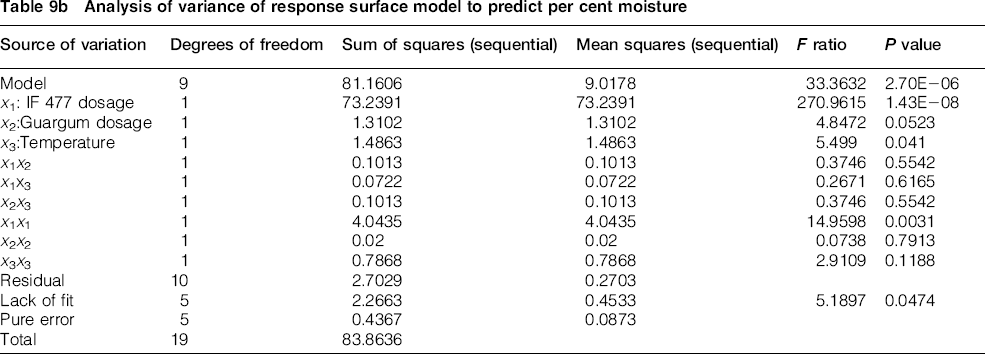
Analysis of variance of response surface model to predict per cent moisture
Three-dimensional response surface plots
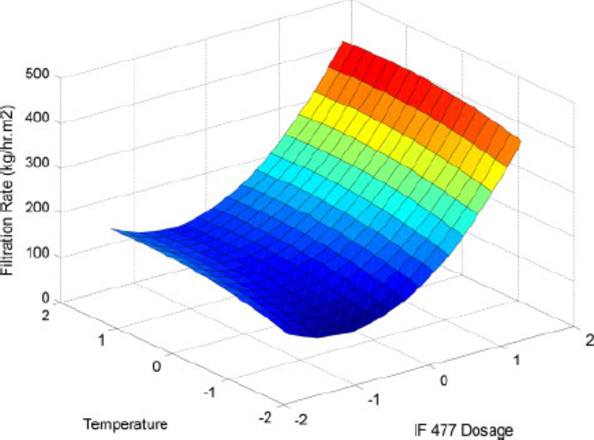
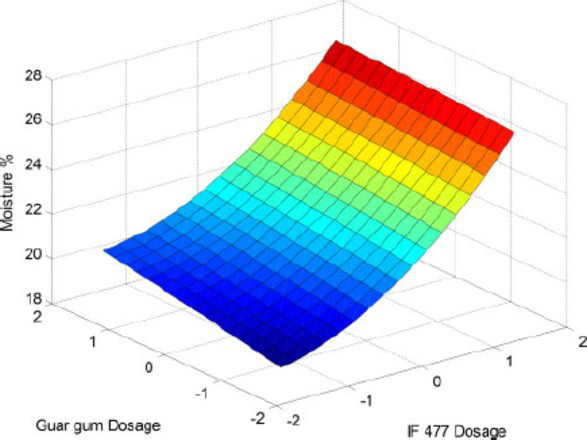
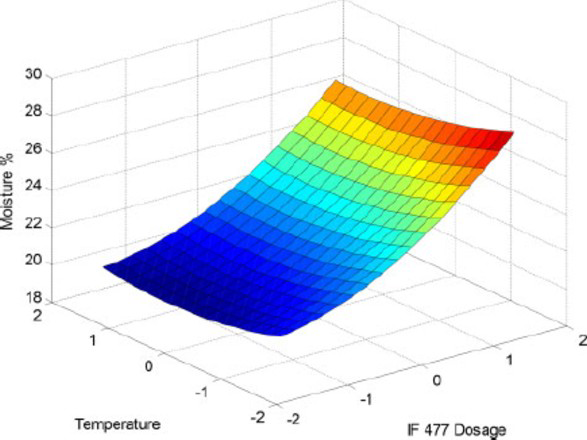
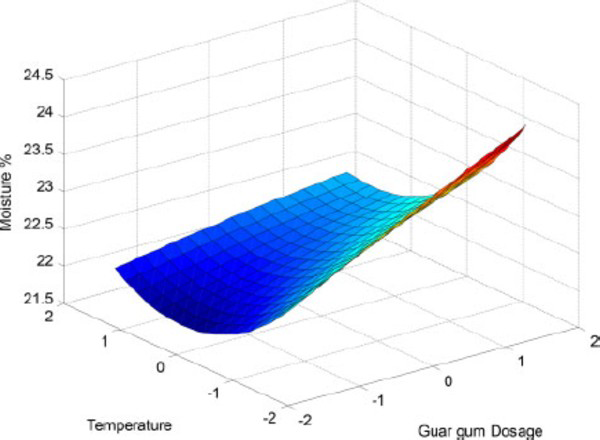
In order to gain a better understanding of the results, the predicted models are presented as the three-dimensional response surface plots in Figs. 3 to 8. The plots illustrate changes in the values of response functions when two of the three variables were varied keeping the third variable at the central level of the range. Figures 3 to 5 give information on variation in rate of filtration, while Figs. 6 to 8 give the profile of moisture content in the filter cake. These illustrations indicate that the rate of filtration is a maximum at the highest dosage level of IF 477 and Guargum and central level of temperature. However, the rate of filtration was observed to be different with the two flocculants. For instance, the rate of increase in filtration was faster with IF 477 with change in dosage in comparison to Guargum (Fig. 3). Similarly, the dosage of IF 477 was more significant in influencing the rate of filtration than the temperature of the pulp (Fig. 4). In the case of Guargum, the increase in rate of filtration with temperature was effective only up to the central or medium level of the code (0) and the trend became invariant at levels higher than medium level (Fig. 5).
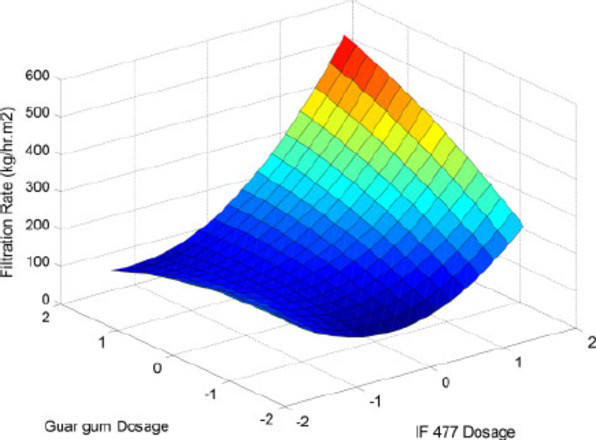
Response surface plot showing effect of IF 477 dosage (
Response surface plot showing effect of IF 477 dosage (

Response surface plot showing effect of Guar gum dosage (
Response surface plot showing effect of IF 477 dosage (
Response surface plot showing effect of IF 477 dosage (
Response surface plot showing effect of Guargum dosage (
As regards the moisture content in the filter cake, it was observed that increasing the dosage of IF 477 has more pronounced effect than varying the same with Guargum (Fig. 6). Variation of IF 477 dosage from the lowest to the maximum (code value -1.682 to 1.682) level increased the moisture content from 19% by weight to ∼26%. Figures 7 and 8 show that increasing the temperature of the pulp does not help much to reduce the moisture content in comparison to addition of the flocculants.
Optimisation and model validation
Equation (5) was optimised using quadratic programming of the mathematical software DOE++ to maximise the rate of filtration within the experimental range studied. The maximum rate of filtration was observed to be 631·83 kg h− 1 m− 2 with cake moisture of 27·65% under the following operating conditions: IF 477 dosage +1·682 (167 g t− 1), Guargum dosage +1·682 (167 g t− 1) and temperature of +0·392 (321·5 K). Equation (6) was also optimised to minimise the cake moisture content. Lowest moisture content of 19·05% was obtained when filtration was carried out at a temperature of 318 K (level − 0·0408) and no flocculant addition was made. However, the corresponding filtration rate was only 184·80 kg h− 1 m− 2. As the objective of the study was to obtain a good rate of filtration with optimal moisture content, the settings at IF 477 dosage +1·682 (167 g t− 1), Guargum dosage +1·682 (167 g t− 1) and temperature of +0·392 (321·5 K) deduced from optimisation process were found to be ideal as these gave a filtration rate of 631·83 kg h− 1 m− 2 with a corresponding cake moisture content of 27·65%. The parameters obtained from the modelling studies were validated experimentally by conducting additional filtration tests at the above said optimised conditions. The results indicated the scope of obtaining filtration rate of 628·5 kg h− 1 m− 2 and the moisture content in the filter cake was 27·0%. These values are in a good agreement with the predicted data.
Conclusion
Investigations were carried out to maximise the rate of filtration of fine grained (d80 size 60 μm) uranium leach slurry of alkaline nature with minimum moisture content using commercially available flocculants. The investigations were carried out by screening several polyacrylamide based flocculants of anionic, cationic and nonionic nature along with Guragum using CST parameter. Detailed optimisation studies for filtration behaviour were subsequently carried out on the combination of two best flocculants by adopting CCRD of experimentation and RSM. The combination of Indfloc 477 and Guar gum gave the optimum filtration rate of ∼630 kg h− 1 m− 2 at a cake moisture level of ∼27·5%, which was validated experimentally also.
Acknowledgements
The authors express sincere thanks to Dr J. K. Chakravartty, Director, Materials Group, BARC, Mumbai, for the continued encouragement and keen interest during these investigations. They also thank various flocculants manufacturers for generous supply of flocculants sample for the test work.