
Abstract
The reduction of yttrium fluoride (YF3) by calcium in a molybdenum crucible was investigated. A visual observation technique was used to monitor the reduction process. It was observed that the reaction initiated immediately after the melting of calcium. Based on the results, a two-step reduction sequence was attempted. First, the charge was heated to 950°C to minimise the calcium loss by vaporisation and to ensure completion of reaction. The products were then fast heated to 1600°C for slag/metal separation. Molybdenum content of yttrium was found to be in a range of 3.5–4.75 wt-%, which is much lower than the equilibrium content predicted by Mo–Y phase diagram. The yttrium/molybdenum interface was studied using an electron probe microanalyser, which confirmed that the overall equilibrium was not reached, indicating the possibility of lowering the molybdenum contamination further by process optimisation.
Introduction
Metallic yttrium has many uses. Yttrium addition brings superior oxidation resistance to V–4Cr–4Ti alloys (a proposed structural material for advanced nuclear reactors) at 600 and 700°C by preventing surface V2O5 formation (Chan et al., 2010a; Fujiwara et al., 2002). It is also used as an effective deoxidiser for vanadium and other non-ferrous metals, owing to its high affinity for oxygen (Nishimura et al., 2002). Small quantities of yttrium are added to reduce the grain size in chromium, molybdenum, zirconium and titanium, and to increase the strength of aluminium and magnesium alloys (Lide, 2005). Studies on the extraction to pure yttrium from its oxide/fluoride/chloride using different techniques are well documented (Gupta and Krishnamurthy, 2004). The calcium reduction of yttrium fluoride (Spedding and Daane, 1961), described as the Ames process, yields yttrium ingot and considered a suitable commercial process. The process involves mixing YF3 and 10% excess calcium in a tantalum crucible in an argon environment and heating the charge to beyond the melting point (MP) of yttrium (1522°C). It was reported by the original inventors of the process (Spedding and Daane, 1961), on the basis of rise in temperature of the charge that the reduction started between 800 and 1000°C. Similar observation on reaction start temperature for fluoride reduction of other rare earths was reported by Brashear and Zevenbergen (1999).
The heat of reaction during calcium reduction of yttrium fluoride is not sufficient to increase the temperature of the reacted mass to above the MPs of the products (Spedding and Daane, 1961). This is unlike the common metallothermic reduction process, namely, thermit process, in which both the products, the metal and the slag, melt due to the intense heat of the reaction and separate from each other due to density difference. The slag–metal separation in Ames process has to be ensured by heating the charge to above the MP of the higher melting substance; otherwise, a mixture of CaF2 and rare earth metal (yttrium in the present case) would result. Besides, liquid yttrium being very reactive, a proper choice of crucible material becomes important (Spedding and Daane, 1961). The refractory metals tungsten and tantalum as crucible materials are workable for handling liquid rare earth metals (Gschneidner and Beaudry, 1991). Dennison et al. (1966a, 1966b) reported the tantalum contamination to a tune of 0.5 wt-% in final yttrium. To overcome the crucible contamination issues, an intermediate alloy process was also attempted. A yttrium–24 wt-% magnesium alloy was prepared by reducing yttrium fluoride with calcium in the presence of magnesium and calcium chloride at 950°C in a titanium or zirconium crucible and, thereafter, demagging magnesium at 1250°C under vacuum to form yttrium sponge (Gupta and Krishnamurthy, 2004). However, the contamination problem still persisted (Carlson et al., 1956).
Calcium has a high vapour pressure. Its boiling point (1484°C) is just above the MP of CaF2 (1417°C) (Binnewies and Milke, 2002) and only slightly below the MP of yttrium (1522°C) (Kottcamp, 1992). This results in substantial evaporation of calcium before it could react with the fluoride. On the other hand, slower kinetics of the reaction at lower temperatures may demand as high a temperature as possible for reasonable speed of the process. The temperature at which the process should be carried out therefore needs to be optimised. A calciothermic process cannot be properly optimised using conventional methods like the differential thermal analysis technique, as the calcium metal is available in the form of granules, and not as powder. The two reactants, therefore, cannot be intimately mixed for preparing a sample for proper differential thermal analysis.
In this paper, the reaction sequence of the Ames process is studied by visual observation based on the ‘spot technique’ (Garg and Ackermann, 1977, 1979; Garg et al., 1985; Garg, 1980), which is a standard method for determining solid–liquid transition temperatures in a metallic charge. From the process sequence (i.e. melting of the reactants or the products, beginning or conclusion of the reaction) observed, the steps for carrying out the process efficiently can be worked out. The process may be carried out in a manner so as to achieve a good slag/metal separation and to ensure a minimum duration of contact of the container with liquid yttrium. Molybdenum was selected as the container material over tantalum or tungsten because of its significantly lower cost. In this paper, some interesting results on the interaction of liquid yttrium with molybdenum are presented.
The spot technique was developed for experimental determination of the liquidus, eutectic and MPs of metallic system (Garg and Ackermann, 1977, 1979; Garg et al., 1985; Garg, 1980). In the original technique, the sample is heated inside a closed container that has an orifice at its lid. As the temperature is raised, the orifice is continuously visually observed through the pyrometer used for temperature measurement. In comparison to solids and non-metallic liquids, the liquid metals have highly shining and reflecting surfaces. The image of the orifice (‘spot’) is therefore seen through the pyrometer once the liquid forms in the sample. A broken and rapidly moving spot appears in the two-phase region between the solidus and the liquidus.
Experimental
Materials
Yttrium fluoride (99% pure) (amount, 50 g) used in the present study was of Indian Rare Earths Ltd make. Calcium metal clinkers (97% pure and of ∼2 mm size) stored under inert gas cover were used for the reduction. Twenty per cent excess calcium over the stoichiometric requirement was added. Molybdenum crucibles (40 mm diameter and 65 mm height) were sourced from local vendors. The mixing of the reactants was performed under argon atmosphere to prevent the oxidation of calcium. The crucible containing the charge was also loaded inside the furnace under argon cover. High pure argon (99.995%) was used in the present work.
Reduction furnace
A custom made induction furnace of 15 kW was used for the reduction. The schematic of the set-up is shown in Fig. 1. The furnace comprised of a leak tight silica chamber of ∼360 mm length with graphite susceptor of 100 mm diameter placed inside. The graphite susceptor had a lid with a hole at the centre. The reaction was carried out in a molybdenum crucible, which was kept inside the susceptor and thus was indirectly heated. Temperature was measured using a two-colour pyrometer, which was focused on to the hole on the graphite susceptor lid. No black body correction was applied, but the ratio of the distance between the susceptor lid and the charge surface to the diameter of the hole was about 4–5. Although this arrangement does not form a perfect black body, the read temperatures should not be too much off from the actual temperature to be of significance in actual practice. The furnace had ap roportionalintegral-derivative (PID) control mechanism, to which the temperature data from the pyrometer was provided. This arrangement ensured that slow and controlled heating within ± 2°C accuracy was possible even in an induction furnace. The pyrometer also served as the tool for observing the changes in the charge, despite being processed in a leak tight system, during the course of the process.
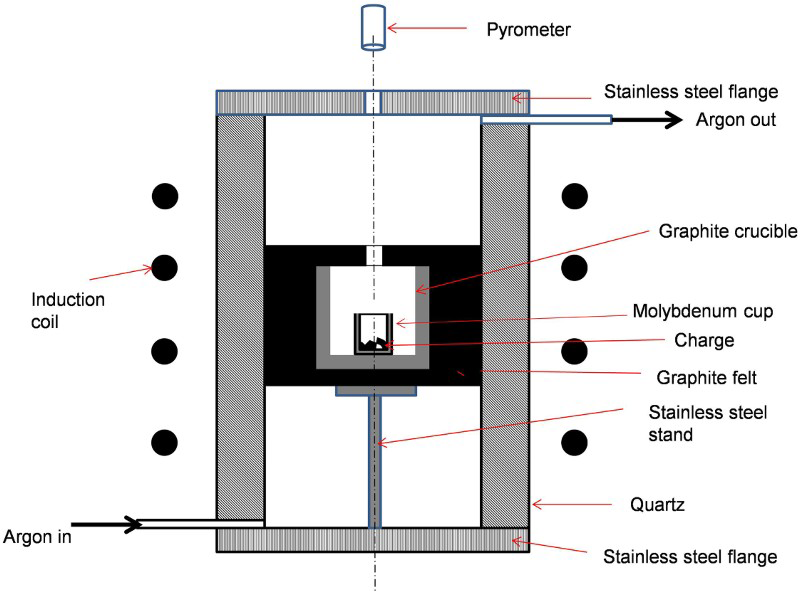
Schematic of set-up used for yttrium preparation
The furnace chamber was purged with argon of flowrate ∼2 L min− 1 for sufficient time before heating. The slight flow of argon as ensured through a bubbler was continued during the overall reduction process.
Characterisation
Inel make powder X-ray diffractometer (model MPD) with Cu Kα radiation was used for phase identification. Oxygen/nitrogen analyses for yttrium were carried out in a simultaneous oxygen nitrogen determinator (LECO-make, model EH300). Inductively coupled plasma atomic emission spectroscopy (ICP-AES) (Perkin Elmer) was used for determining the molybdenum content in yttrium matrix. The solution for the ICP-AES analysis was made by dissolving yttrium in 2%HNO3. The sample for metallographic examination was prepared using the standard procedure. However, no water was used during the preparation of the sample to prevent oxidation of the metal. The as polished microstructure was seen through a Leica make optical microscope at × 20 and × 50 magnifications. The interdiffusion and compositional analysis was carried out using a scanning electron microscope (SEM) (Hitachi S3400N) with accelerating voltage of 15 kV fitted with an energy dispersive spectrometer (EDS). The optical samples were further subjected to composition analysis in a Cameca SX-100 electron probe microanalyser (EPMA).
Results and Discussion
Observation of reaction
The temperature of the furnace was slowly raised by increasing the induction power. The hole on the susceptor lid became clearly visible as a faint red circle through the pyrometer above ∼700°C. As the temperature increased further, black spots began to appear in the red circle. These coalesced with time, and their fluid nature was apparent from their movement. This was indicative of a solid–liquid metal transition occurring in the charge and corresponded well with the MP of calcium (842°C).
Vigorous churning was observed through the pyrometer almost immediately after the melting of calcium. The churning event, however, stabilised quickly in about 2–3 min, and the black spots also disappeared almost simultaneously alluding to the consumption of the liquid metal, i.e. calcium. If reduction reaction (1) is considered at temperatures slightly above the MP of calcium

The charge now contained an intimate mixture of yttrium and CaF2 solids. As it was heated further, moving black spots could be seen again beyond ∼1490°C. Although calcium fluoride melts at 1417°C, being a non-metal, it would not have a highly reflecting surface for the black spots to appear. The occurrence of the moving spot could be attributed to the melting of yttrium, which melts at 1522°C. The spots could be seen moving, as liquid yttrium and liquid CaF2 were intermixed initially. The reaction was fast, and the spot disappeared within 5 min. This observation is consistent with slag–metal separation, during which the slag and the metal coalesce and separate due to density difference. The spots disappear when non-reflecting CaF2 liquid rises to the top of liquid yttrium pool.
Based on the above observation, instead of the continuous heating practiced in the Ames process, a two-step heating method was devised and successfully followed in a later experiment. The charge was first quickly heated to ∼950°C and held at this temperature for 30 min to ensure completion of reaction (1). The XRD patterns of the products of reaction (1) are shown in Fig. 2. This step made use of the faster kinetics of the reaction occurring after the melting of calcium, and, at the same time, the temperature was kept low enough to prevent significant evaporation of calcium. In the next step, the temperature was then quickly raised to 1600°C and maintained for 1 h to allow for slag–metal separation to complete. Loss of yttrium in the slag was minimal in the two-step process, and the overall duration was shorter. It should thus be possible to carry out the process in two further convenient variations: in a set-up having facility for only visual observation (the availability of a pyrometer will not matter much) or in systems without the viewing port but having an arrangement to measure the temperature approximately.
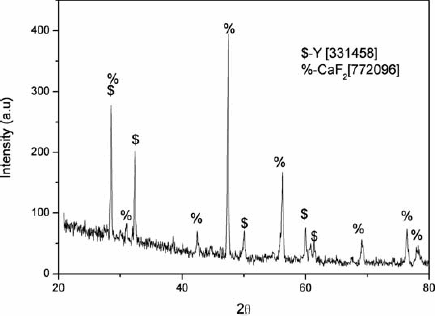
X-ray diffraction pattern of powdered product taken out at 950°C
Products of reduction reaction
Molybdenum crucible was taken out from the furnace after overnight cooling. The slag layer of CaF2 had solidified on top of the metal. The slag was separated out mechanically. However, the yttrium metal was found sticking to the molybdenum crucible, which indicated a possible solubility of molybdenum and yttrium. Molybdenum had to be chiselled out to take out the yttrium metal. The oxygen and nitrogen contents of metal were determined to be 0.8 and 0.04 wt-% respectively.
Metallographic studies: Optical and SEM
A small portion containing both yttrium and molybdenum was cut from the crucible bottom with yttrium stuck to it to study the possible solubility of molybdenum into yttrium. The piece was first hot mounted, and optical micrographs of the sample were taken. The image of the polished unetched piece (yttrium side) is shown in Fig. 3, which shows some black faceted non-metallic inclusions (as will be discussed later) and small white stringers, sometimes elongated, scattered in the body of the metal. Large black cavities could also be seen.
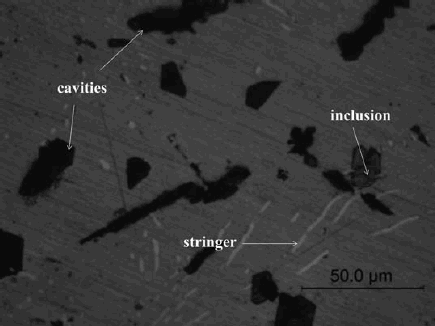
Optical micrograph of yttrium metal
The same piece was further observed in an SEM, and the features were analysed by EDS (Fig. 4). Non-metallic inclusion was found to be CaF2 (EDS of point 1). The EDS of point 6 showed a clear presence of molybdenum in yttrium matrix. The other points (2, 3 and 5) and the area map 4 of the microstructure show the presence of only yttrium. Besides the non-metallic inclusions, few black cavities (indicated in Fig. 3 and in point 2 in Fig. 4) were apparently created by the removal of CaF2 slag inclusions during polishing of the samples. This observation indicates that, to prevent the occurrence of slag inclusions in the metal, a longer time would be necessary for better slag–metal separation. However, this would also mean a longer contact time with the crucible material and, consequently, more contamination from molybdenum.
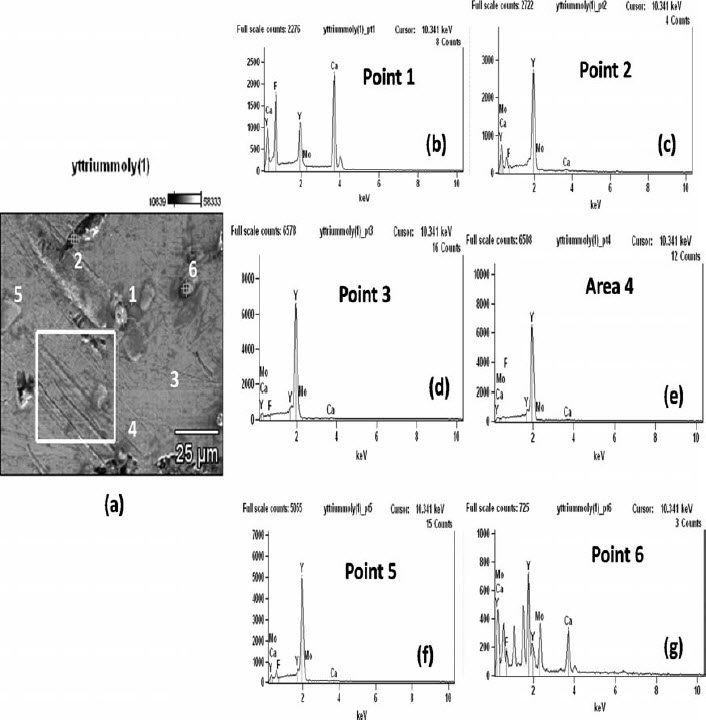
Image (SEM) of yttrium produced and EDS spectra at various points
Yttrium/molybdenum interaction
The yttrium–molybdenum piece was further studied in an EPMA. Figure 5 shows the backscattered electron image of molybdenum/yttrium interface and the adjacent area. The molybdenum surface at the interface does not have sharp and blunt gaps; instead, it has circular and curved features indicating that it has undergone some kind of dissolution. This is similar to the observation by Taylor et al. (1965). Similar to the stringers observed in Fig. 3, Fig. 5 also shows the distribution of white stringers in the yttrium matrix. However, it is clear from Fig. 5 that such stringers occur more near the interface. Line scans of yttrium and molybdenum contents taken across the molybdenum/yttrium interface (marked as A in Fig. 5) and a white stringer (marked as B in Fig. 5) are shown in Fig. 6a and b respectively.
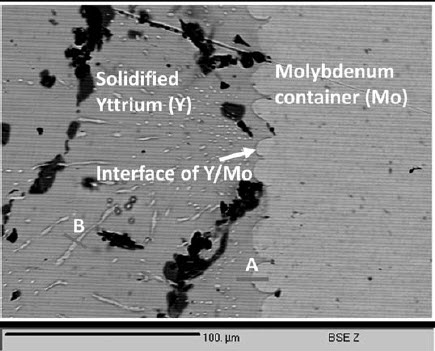
Backscattered electron image of solidified yttrium/molybdenum container interface in EPMA
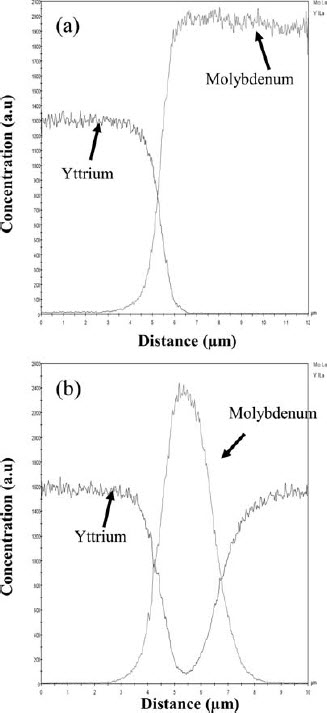
The concentration profile across the interface (Fig. 6a) does not indicate the presence of an interdiffusion layer. Figure 6b indicates that the small white stringers distributed in the yttrium matrix are pure molybdenum. The molybdenum concentration in yttrium was determined by ICP-AES in a couple of samples and was found to be in the range of 3.5–4.75 wt-%. This matches reasonably well with the metallographic assessment. The wide range of the ICP-AES result indicated that the distribution of molybdenum in yttrium was not uniform.
Attainment of equilibrium in systems involving liquids is usually fast. Subsequent to slag–metal separation carried out ∼1600°C, ∼18 wt-% molybdenum should have dissolved in liquid yttrium according to the phase diagram of Mo–Y (Chan et al., 2010b). This would have precipitated as pure molybdenum stringers once the liquid yttrium solidified, as the solubility of molybdenum in solid yttrium is negligible (Chan et al., 2010b). However, substantially lower concentration of molybdenum and its wide range as observed by ICP-AES indicates that the overall equilibrium was not reached during the present studies. It is clearly seen from Fig. 5 that the stringers are concentrated near the molybdenum/yttrium interface. This might allude that equilibrium in the liquid state was reached at the most at and near the interface, and the diffusion of molybdenum in liquid yttrium was reasonably slow during the present experimental conditions. As the piece was taken from the bottom of the molybdenum container, appearance of many stringers perpendicular to the Mo/Y interface (i.e. lying freely vertical in liquid) cannot be due to drowning of the solidified molybdenum crystals. The stringers clearly appear to be the dendrites originating from the wall of the crucible. Such a growth, in which fresh nucleation is not required, is thermodynamically much more feasible as compared to the growth occurring subsequent to the heterogeneous nucleation at slag, etc. The latter would result in more uniform distribution of molybdenum across the solidified melt. Irrespective of whether the equilibrium was reached near the interface or not, the higher concentration of molybdenum there subsequent to the solidification is unambiguous.
The present observations also indicate that the contamination from molybdenum in the final product could further be decreased by optimising the holding time for the slag–metal separation, the cooling time for the separated yttrium to solidify and the contact area of the crucible for a given amount of the charge. It may also be possible to obtain purer yttrium by machining off the contaminated portion occurring beside the interface as is carried out in the case of rare earth metals prepared in tantalum/tungsten crucible (Dennison et al., 1966b). Removal of CaF2 inclusions is not a problem as liquid yttrium and liquid CaF2 are insoluble in each other and could be easily separated by remelting in a water cooled copper hearth.
Conclusion
It was visually observed that the reduction of YF3 by calcium occurs only after the melting of calcium. A two-step process of reduction of YF3 by calcium, first holding the charge just above the melting temperature of calcium for reaction to complete followed by heating to a higher temperature to achieve slag–metal separation is a feasible alternative. The dissolution of molybdenum from the crucible into the yttrium product was substantially lower than the equilibrium value. Hence, it should be possible to obtain a purer product by optimising the process parameters.