
Abstract
The need to identify oversized fragments in underground mining operations is discussed. The relationship between relative permittivity and bulk density is examined using established mixture models. A method of measuring the relative permittivity of ore in an industrial context is presented using a two channel Ground Penetrating Radar system in a trans-illumination arrangement. This method also provides a solution to the problem of time zero drift which affects spatially and/or temporally separated antennas. Results of experiments using sifted samples of fragmented ore show there is a relationship between bulk density and relative permittivity for fragmented ore.
Introduction
In a typical hard rock, underground mining scenario, the Load Haul Dump (LHD) vehicle collects ore fragments from the drawpoint (Fig. 1). One of the problems encountered is the occurrence of oversized fragments at the drawpoint. The drawpoint may be inspected by the driver of the LHD vehicle or, increasingly, observed in an above ground tele-operation room via video streaming for the control of semi-autonomous vehicles.
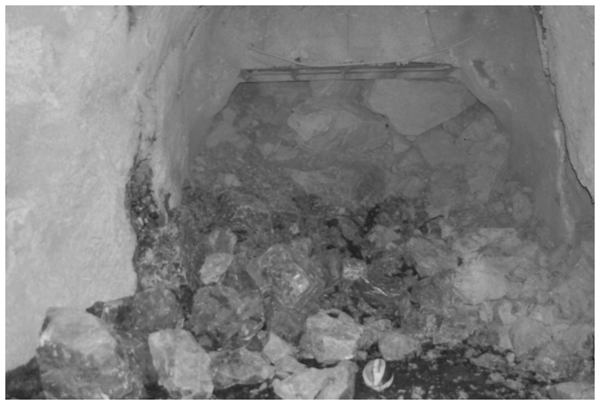
A typical drawpoint at an underground mine: large fragments may be hidden beneath surface
Techniques to identify oversized fragments have relied upon the fragments being visible at the surface of the rock pile. However, this is not always the case. Large fragments partially or totally obscured beneath the surface, and which remain undetected, present a potential blockage to the crusher unit, preventing subsequent loads from being processed. The return cycle for an LHD operator to take a load to the crusher and return to the drawpoint is a minimum of 30 s. A suitable detection system must be capable of determining the presence of a large fragment within this minimum time constraint.
Optical imaging systems have been used for fragment size detection (Cabello et al., 2000; Maerz and Palangio, 2004), however this method is non-penetrative, and suffers from many extrinsic problems (dust, poor lighting, and vibration) in imaging the surface of the rock pile (Maerz and Zhou, 2000). Alternative methods such as Ground Penetrating Radar (GPR) are of interest as a possible solution to these problems.
GPR has been used for imaging features beneath the surface of the earth for archaeology (Booth et al., 2010), mapping underground voids (Chen and Chow, 2007) and non-destructive testing and monitoring of concrete infrastructures including dams, bridges and roads [see Daniels (2004) for a survey of GPR uses]. In most cases, the GPR system used is a bi-static arrangement of transmit and receive antennas recording signals reflected from changes in the electrical characteristics of the medium under investigation. The Authors have previously used this arrangement to determine bulk density using frequency downshift (Benter et al., 2011).
One problem with this arrangement is that the two-way travel of the signal increases signal attenuation, particularly of higher frequencies, limiting the resolution of the resultant image. To overcome this problem, a trans-illumination configuration is proposed.
This paper investigates a trans-illumination arrangement of a two-channel GPR system to determine the bulk density of fractured ore samples from an operational mine in central New South Wales, Australia. The relationship between bulk density and real permittivity are examined using established mixture models. The characteristics of the rock material from the mine are described. With a known distance separating the antennas, the velocity of the signal is determined from the time of arrival of the signal through the ore, allowing an estimation of the real permittivity. Results of the experiments and how this technique may be applied to the underground mining scenario are presented.
Bulk density and relative permittivity
The authors wish to determine the bulk density of a mixture given the relative permittivity and bulk density of the solid material. GPR has been used to measure the bulk density of road pavements (Mardeni, 2010).
The velocity of propagation (ν) of the radar signal through material is influenced by both the permittivity and dielectric losses caused by conductivity (Reppert et al., 2000). A geophysical study of the ore zone by Close (2000) found that the apparent resistivity of the ore zone was greater than 30 Ω m−1. At high frequencies, or low conductivity, we can assume dielectric losses to be small, and the velocity equation can be simplified to (Topp et al., 2000)

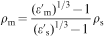
Through a simple rearrangement, the propagation velocity can be used to estimate the relative permittivity of the material

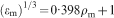
Nelson (2004) has shown the relationship between bulk density and the cube root of the relative permittivity of pulverised materials is linear, and that this relationship allows extrapolation to the solid material. By measuring the velocity of propagation through the material the relative permittivity can be determined using equation (2) and, using equation (3), the bulk density of the material under test can be estimated
As there are only two components in the mixture (air and rock), the quantity of rock in the sample can be determined from the bulk density and volume of the sample. As the bulk density approaches that of the solid rock, we can then infer the presence of a large fragment in the current sample.
Experimental methods
The ore supplied from the mine included many contaminants including small pieces of concrete, steel and reinforcing fibres. The material was manually sifted to remove contaminants. The rock samples were placed in plastic crates and were categorised as low density, medium density or high density samples, as described below.
Ore characteristics
The relative permittivity of the solid rock was computed using equation (2) from velocity measurements through a large, solid fragment of approximate dimensions 600×600×300 mm and found to be ∼9·7. The bulk density of the solid rock was determined from measurements on a number of smaller samples, and confirmed with previous studies on the geological materials at the site (Close, 2000). The solid rock has a very irregular surface making antenna coupling difficult.
The relative permittivity was confirmed using reflection coefficients of sifted material (0–5 mm in Table 1) using (Giannopoulos and Diamanti, 2004)

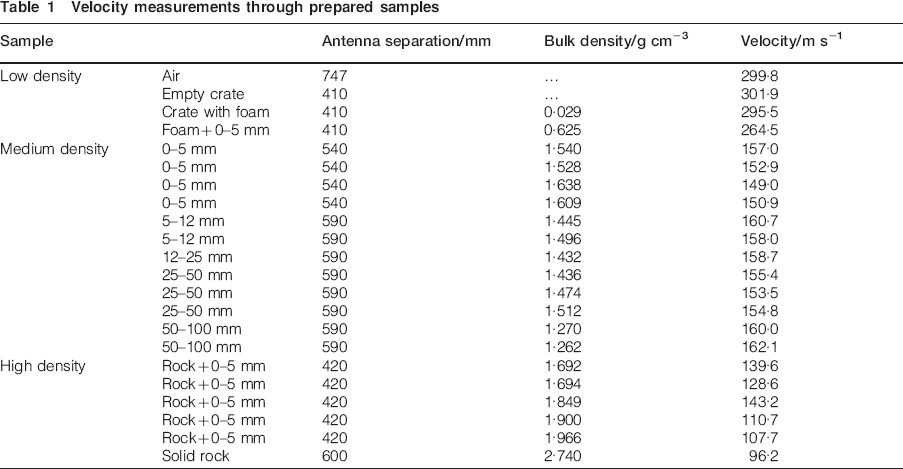
Velocity measurements through prepared samples
The amplitude of radar reflections from an aluminium sheet and 0–5 mm sifted fines was taken at the same height. The fine samples provided a smooth interface for recording the reflection coefficients. The relative permittivity of the fine material measured using equation (4) was 5·44, giving a solid equivalent relative permittivity of 8·9 using equation (3), closely matching the velocity measurement of 9·7.
Rock samples were crated using plastic crates to ease handling. Each crate was filled with dry material stored in the laboratory. Each sample tested was broadly categorised as either low density, medium density or high density.
Low density samples are those with a bulk density of generally less than 1·0. These samples included the benchmark experiment of recording the signal through air. Additional low density samples were created by using foam packaging noodles as a filler together with fine rock particles (see Fig. 2). As shown in Table 1, the foam packaging noodles exhibit a similar radar velocity response as air. The packaging noodles were included in some samples of fines to simulate air pockets within the fine ore, thus lowering the overall bulk density of those samples.

Low density rock samples: left crate contains foam packing noodles; right crate is mixture of foam packing noodles and ore fines (0–5 mm)
The samples in the medium density category were created using uniform fragment sizes. The fragments were sifted to sizes of 0–5, 5–12, 12–25, 25–50 and 50–100 mm. The bulk density of these samples ranged from 1·262 to 1·638. Figure 3 shows two examples of this material.
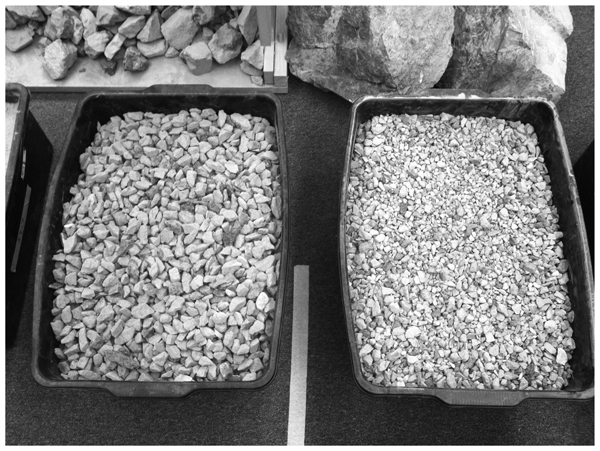
Medium density samples included sifted material with grain sizes of 12–25 mm (left crate) and 5–12 mm (right crate)
The height of the samples in the crates was kept as near to the top of the crates as possible. However the coarser rock samples presented a more variable surface than the smaller fragment samples. The boxes were, at times, stacked for storage, which caused some compaction of the material. This compaction resulted in a number of samples having similar fragment sizes with different bulk densities.
A number of high density samples were constructed using smaller rock fragments (∼250 mm diameter) and pulverised material. These rock fragments were placed in the same plastic crates as the low and medium density samples, and surrounded by 0–5 mm fines to create similar signal path and coupling as the other crated samples. Figure 4 shows one of the high density samples, the rock fragment being highlighted by yellow paint. This provided some high density samples approaching the bulk density of the solid rock fragment, with a smooth surface for optimal antenna coupling.
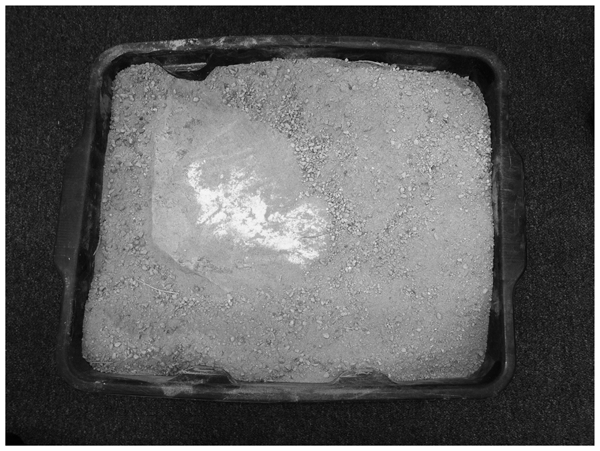
High density rock samples contained single, large fragment embedded in fines (0–5 mm): large rock in photo was exposed for picture
GPR system
The GPR system was a SiroPulseII system developed by CSIRO (Australia) (2011). The antennas used in the research presented here were shielded, two channel, 1·4 GHz antennas, allowing two separate receive antennas and one transmit antenna. The antennas were arranged as shown in Fig. 5. The antennas were coupled to the crate containing the ore sample. The length of the crate, and hence the distance between the antennas, is listed in Table 1. The acquired scan was then processed by obtaining the average trace and removing DC. The velocity of the signal was calculated by manually determining the time zero point and the arrival point for the received signal.
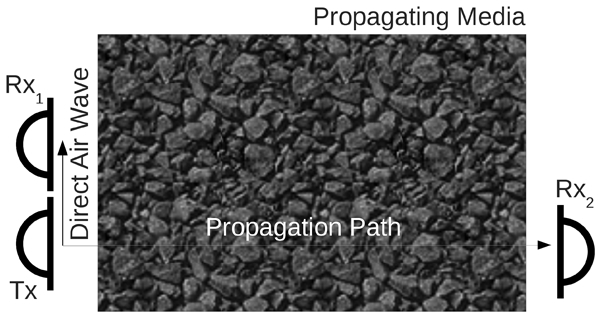
Schematic of dual channel antenna arrangement eliminating need for calibration of zero time caused by drift
Time zero calculation
The dominant source of systematic errors in GPR data collection is time zero drift. In a typical bi-static antenna configuration, the receive antenna is located close to the transmit antenna, permitting the recording of the direct air wave in the signal. Given the proximity of the receive antenna to the transmit antenna, this gives a simple method of determining time zero in the receive signal. Manufacturers recommend a typical ‘warm-up’ period of ∼10 min to allow the electronics to stabilise, reducing the effect of the drift in time zero.
To determine the extent of drift in time zero for the antenna system used in this research, the transmit remote receive antenna was separated by an air gap of 1000 mm, and a reading was taken every 5 min for 2 h. Each scan recorded 512 samples over an 8 ns time window. Over the recording period, the arrival peak drifted from sample 265 to sample 235, representing a drift of nearly 0·5 ns which corresponds to ∼150 mm in air (see Fig. 6). As described above, the GPR system is a dual channel system. The origin of the drift is unknown, but is assumed to be common to both receive antennas.
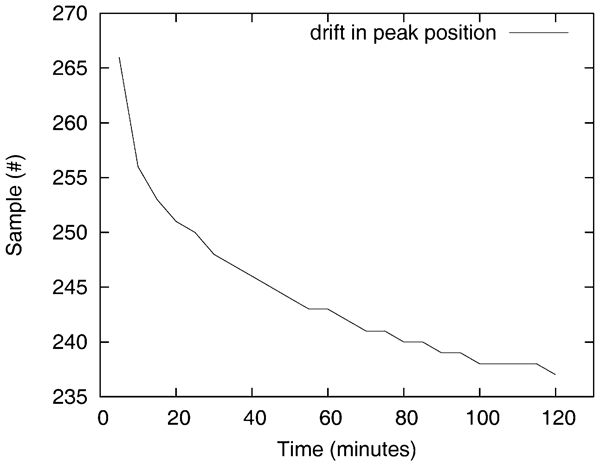
Sample number of first peak for signal at single receive antenna: over time the position drifts, requiring re-calibration of time zero point
Time zero drift can be compensated for by applying a time factor to the traces (Jacob and Hermance, 2005). Using a time factor allows data to be repositioned in time, enabling absolute positioning of the signal characteristic to determine range. While this method may correct errors in a single data collection following calibration, it does not permit the comparison of data from different collections without the additional recording of accurate time periods for all measurements across data sets. Furthermore, with multiple antenna pairs in simultaneous operation, calibration across pairs would be complicated. An improvement in the method of ranging is to transform the absolute measurement of the arrival peak into a relative measurement, thereby removing the need for accurate time keeping and recalibration of the drift compensation.
Arranging the antennas such that there is a receive antenna Rx1 adjacent to the transmit antenna Tx, as well as an opposite receive antenna Rx2, as shown in Fig. 5, allows the time zero point to be determined from Rx1, and the offset applied to Rx2. The travel time to Rx1 is negligibly small, and assumed to be zero. In this way Rx2 remains in sync with Tx, and an accurate time/distance can be measured between the two antennas. This arrangement was tested. The measured range to Rx2 was found to be repeatable when measured relative to Rx1.
There are a number of candidate positions for time zero in the received signal. Yelf (2004) determined that while a commonly accepted position for time zero was the first positive peak of the direct wave, the use of a calibrated position in advance of the first positive peak provided consistent results.
Experiments to identify the best candidate position for time zero indicate the zero crossing before the first peak of the direct wave to be the most accurate. Figure 7 shows the direct wave as received by Rx1 (dashed line, ‘Transmit Signal’), and the received signal at Rx2 (dotted line, ‘Receive Signal’). The relative difference is measured as the time between the early arrival on the direct wave and the later arrival of the signal on Rx2. Over a hand measured test distance of 747 mm, the relative time of signal arrival at both receive antennas consistently indicated a calculated separation of 746 mm between the transmit and remote receive antennas.
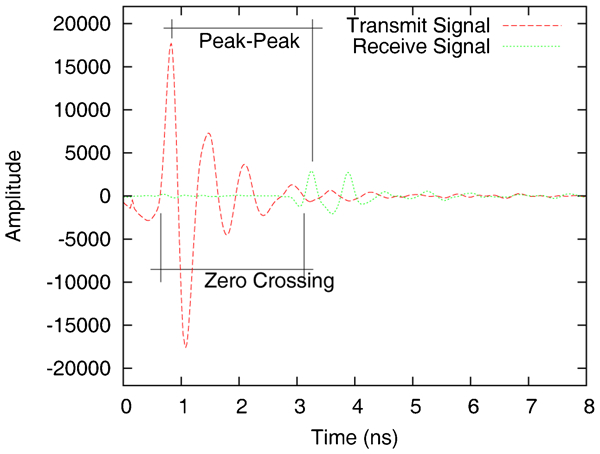
Candidate points to determine time zero for relative measurement of signal velocity
Results
The signal propagation time through sample media was observed and calculated as the relative time between the zero time for the two receive antennas. Each measurement recorded a minimum of 500 scans through the sample which were then averaged to a single scan. All measurements were repeatable and showed no change over the course of the experiments.
Two calibration points are the samples through air and solid rock. These points effectively establish the lower and upper boundaries respectively. The velocity of the signal in air matched that of the speed of light at approximately 299·8 mm ns−1.
Sifted rock samples were exclusively in the ‘Medium Density’ class. In order to provide samples closer to the air and solid rock boundaries, samples were created using a mixture of materials. Samples with a ‘Low density’ were created with foam packing noodles as previously described. Signal velocities recorded through the foam noodles only within the crate showed there was no discernible effect from the foam noodles on signal velocity (see Table 1).
The low density ore sample exhibited a higher signal velocity than the medium density ore samples, which in turn exhibited higher velocities than the high density samples. The results, plotted in Fig. 8, show that the relationship between the calculated cube root of the relative permittivity and the bulk density of the sample is approximately linear. As sample bulk density increases towards that of solid ore the relative permittivity also increases, causing the signal velocity to decrease.
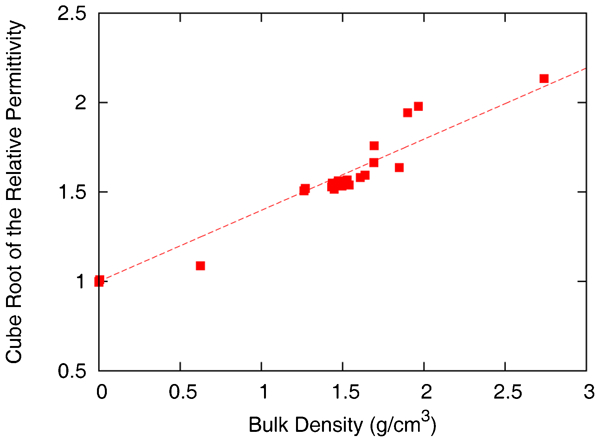
Graph of experimental results showing relationship between cube root of relative permittivity and bulk density of ore
The linear regression through the data (R2 = 0·981)
By recording the time the signal takes to propagate over the distance between the antennas, we can determine the signal velocity, and thus, infer the bulk density according to equation (5). As the inferred bulk density ρm approaches that of solid rock ρs the ratio of rock to air in the signal path increases. If the ratio of rock to air in the signal path were to exceed a threshold value, this would correspond to the presence of oversized fragments.
Discussion
The configuration for measuring rock bulk density at the drawpoint presented in this paper for requires the placement of the GPR antennas in opposing positions such that the signal path is through the ore. An obvious placement is on the concrete support structures around the drawpoint allowing the distance between the antennas to be fixed.
By measuring the velocity of the signal through the volume of ore, the relative permittivity of the material can be estimated, allowing the bulk density of the ore under illumination to be calculated through an inversion of equation (5)

The bulk density of the sample under illumination compared to the bulk density of solid rock allows a ratio of rock to air to be calculated for the sample. In the results presented in this paper from laboratory experiments the rock material is uniform in size, having been sifted to remove contaminants. This paper demonstrates the relationship between bulk density and the cube root of the permittivity, and suggests this relationship is not dependent on particle size. Results to be presented in a future paper using randomly distributed rock fragments of particles up to 100 mm in size suggest particle size has no discernible impact on the method of measuring bulk density. Construction of a full scale test system is currently being planned which will permit the study of larger rock samples, rock flows and enable determination of the threshold values indicating the presence of a large rock in the drawpoint.
The relationship between bulk density and relative permittivity could thus provide a method of determining the presence of large fragments at the drawpoint. The current antennas operate at 1·4 GHz and the results obtained have demonstrated this frequency is effective over the experimental sample distances. Over the full width of the drawpoint however, a lower frequency will be necessary. The full scale system being constructed will also allow investigation of suitable operating frequencies and antenna placement.
The ore extracted from the drawpoint is a constant flow of material from the ore body through the drawpoint. At no time is there expected to be a clear drawpoint enabling calibration of the signal start time between opposing transmit and receive antennas. A method of calibrating the start time by using a multichannel system with adjacent Tx−Rxn antennas has been demonstrated and shown to provide a solution to the problem of drift over time.
The mine currently uses a significant amount of water, as can be observed in Fig. 1, for dust suppression for driver's health and safety and also to maintain visibility. The mine operator has, to date, been unable to quantify the amount of water, if any, that will be present following implementation of this system. This system may enable a future autonomous system to operate in a mine without the need for water as a dust suppressor, saving the mining industry considerable water resources. The experiments described in this paper have been performed with dry materials until the mine operator is able to provide advice on water usage.
Conclusions
This paper uses standard GPR antennas to enable determination of the bulk density of rock samples using the velocity of the electromagnetic waves. Linear regression equations relating bulk density and relative permittivity were developed from experimental data. From the bulk density estimation we can infer the amount of rock material in the sample and provide an indication of the likelihood of large rocks being present in the sample.
One of the problems identified with GPR data acquisition is the drift in time zero over time. A simple solution to this problem was presented: positioning one of the receive antennas at a position such that the time zero of the transmit antenna can be determined from the direct air wave, thus eliminating the problem of drift over time.
Footnotes
Acknowledgements
This research is being conducted as part of a research program funded by Newcrest Mining Ltd.