
Abstract
This paper presents the results of controlled blasting experiments and blast modelling carried out to understand and quantify the effect of blasting on the creation of fractures inside fragments referred to as conditioning. Fragment conditioning is studied through the use of indirect and direct measurement techniques on samples collected from different zones around an explosive charge. Modelling is used to map different levels of conditioning throughout the blasted samples and explore the impact of boundary conditions on the spatial distribution of conditioning levels. Combined statistical analysis of repeatable tests showed that the measured impact breakage ranking parameter (A*b) increased by 20 and 33% within the low and intermediate conditioning zones respectively. This translates into a statistically significant strength reduction of the material. These results in conjunction with other documented experience suggest that blast-induced conditioning can have a positive impact on comminution performance and thus energy consumption. Results from this work provide the basis for a methodology to better define post-blast breakage strength inputs into comminution performance models; as well as a preliminary approach to scale up the extent and degree of conditioning by blasting. Further work is required to evaluate the ability to control the degree of conditioning through the application of improvements in designs and novel blasting technology
Introduction
In the early days of mineral extraction, comminution and mineral concentration processes were seen as unitary activities and were generally optimised in isolation. Nowadays, the approach of continuous improvement has changed, with every process becoming an integral part of the overall recovery effort. Integrated strategies such as ‘mine to mill’ have helped to define the value chain in mineral extraction and have showed the improvements that can be achieved by the proper interaction between different operations (MacKenzie, 1967; McKee et al., 1995; LeJuge and Cox, 1995; Moody et al., 1996).
From an energy perspective, several investigators have established that blasting is the most cost effective stage in the rock comminution process (Fuerstenau et al., 1995; Eloranta, 1995).
Blasting is considered to be the most important stage of the comminution process because of its impact on overall mining and processing costs. Kanchibotla et al. (1998) showed that in an open pit gold mine, a powder factor increase from 0·58 to 0·66 kg m−3 caused a 12% drop in Semi-Autogenous Grinding (SAG) milling energy consumption. Kojovic et al. (1995) recorded net savings of $0·65/t for an increase in powder factor from 0·52 to 0·61 kg m−3. Loading and handling savings of $0·40/t and crushing savings of $0·30/t were reported for an increase in blasting cost of $0·05/t. Fuerstenau et al. (1995) carried out field scale blasting and laboratory comminution tests (crushing and grinding), documenting a 10% reduction in the overall cost because of an 25% increase in explosive length and a 7% overall saving due to a burden and spacing reduction of 56%.
Blasting can also have a direct impact on crushing and grinding performance because of the degradation in rock mechanical properties (Nielsen and Kristiansen, 1996; Michaux and Djordjevic, 2005). Michaux and Djordjevic (2005) stated that up to a 20% increase throughput can be achieved by fragment strength reductions. Authors such as Schonert (1979) and Ozkahraman (2010) stated that the number of natural and induced fractures inside the fragments (fragment conditioning) is one of the key parameters controlling the breakage process during comminution. As might be expected, the number of factures decreases with size of the particles and thus the relative strength of the material is meant to increase along with the energy requirements. McKenzie and Adamson (2010) have suggested that microfractures generated in early stages of comminution (e.g. blasting and crushing) can have a positive impact on grinding operations as a result of a proven reduction in material resistance and work index. Furthermore, Nielsen and Kristiansen (1996) and Workman and Eloranta (2003) have reported that powder factor increases can cause a decay in the rock material work index. This implies that powder factor or blast intensity can be related to a reduction in the strength of fragments and thus potential reductions in energy consumption.
Despite several studies associated with indirectly measuring the impact of fragment conditioning on subsequent process improvements, there is a lack of understanding of the main factors that contribute to different levels of conditioning from blast-induced stresses. There is also a need to develop the tools to evaluate the influence of conditioning at production scales. From a mining and mineral processing perspective, the effect of level of fragment conditioning on breakage strength and subsequent comminution performance has not been thoroughly studied and three important aspects need to be addressed. First, the need to isolate the already known influence of fragment size distribution and solely focus on the impact of fragment conditioning; second, how to quantify and potentially scale up the degree of fragment conditioning to production environments; and finally, the need to better understand the relationship between different degrees of conditioning and final fragments properties that can influence comminution performance.
Fragment conditioning by blasting
Fragment conditioning by blasting can be defined as the alteration of the physical properties of the rock after blasting due to the extent of pre-existent cracks and the creation of new fractures. This phenomenon can be associated with two processes that take place at two different scales: macrofracturing and microfracturing. The former is generated at a scale of centimetres or greater whereas the latter is produced at scales of micrometres and millimetres. This categorisation is far from being absolute as it depends on the size of the grains into the matrix and the scale of the phenomenon of interest. Theoretically, fragment conditioning is expected to be present at all stages of mineral processing, providing a reduction in energy consumption during breakage as well as a potential increase in the liberation of minerals. With regard to the classification of fractures in rock, three types have been identified in the literature, they include intergranular, transgranular and intragranular (Åkesson et al., 2004; Muñoz et al., 2007). Intergranular corresponds to fractures formed along grain boundaries; transgranular fractures can cross multiple mineral grains; and intragranular fractures are generated inside the grains.
Currently, microscopy and X-ray tomography are the only techniques that provide a direct measurement of fracturing. Nonetheless, the volume of data possible to analyse is limited. Other techniques have been developed and applied to indirectly measure fracturing; these are based on measuring relative changes in mechanical and/or elastic properties of samples and may also be limited in terms of sampling volumes.
In blasting, the main fragment conditioning mechanisms are complex due to the effect of boundary conditions and stress loading rates imparted into the rock mass. Although, there are various studies that have been focused on defining the mechanisms involved in the generation of microfractures by blasting, it is not yet possible to either quantify it directly or identify all of the factors involved in this process. Most tests and studies conducted in this area have been implemented in small scales, blasting one or two holes within cubes or cylinders of synthetic materials such as concrete or plexiglass and competent rock samples such as granite and granodiorite (Kawakami et al., 1990; Katsabanis et al., 2003; Fribla, 2004; Katsabanis et al., 2006; Cho et al., 2006).
As a way of simulating blasting loadings, Kawakami et al. (1990) tested spherical granite samples, impacting them by projectiles at velocities ranging from 2·3 to 3·6 km s−1. They recorded microscopic fractures along the cleavage planes of biotite. Furthermore, microfractures were observed inside quartz grains. In general, the main factors which impact on the formation of fractures and hence conditioning included: induced stress, mineralogical structure, texture, rock elastic and mechanical properties and natural porosity or pre-existing cracking (Jern, 2002).
Many studies have established that there is a direct relationship between induced stress by blasting and the microfracturing level generated inside the fragments. The stress intensity and direction are not the only aspects that affect fragment conditioning; loading rate has also been shown to play an important role, particularly on the length of fractures (Chertkov, 1987; Liu et al., 2006). Katsabanis et al. (2003) argued that P and S waves produce a transient deformation which results in the opening and extension of microcracks. In addition, Nielsen and Lownds (1997) suggested that fragment conditioning is generated by two mechanisms. One is the tensile stress caused by the longitudinal wave and the other is the tangential stress produced by the radial compression around the charge. Olsson et al. (2002) also noted that the shock wave is responsible for microfracturing. In addition, their research emphasises that gas loading had no significant influence on the generation of microfractures.
Although much has been learned from this experimental work, there has been no link with advanced modelling techniques to enable analysis at production blasting scales. To date, there has been no evaluation of the potential effect of blast-induced stresses on the degree of conditioning, nor the relation of the latter with changes in fragments’ impact strength.
Research methodology
Previous research has identified trends mainly driven by fragmentation improvements but has failed to answer the following questions:
What role does the intensity, interaction and attenuation of stresses play on the final extent and degree of conditioning?
From the perspective of comminution performance, how does the impact breakage strength of the material vary for different levels of conditioning?
This section describes the research approach an experimental protocol used to isolate and quantify blast-induced conditioning. Modelling is used to evaluate the effect of boundary conditions on subsequent conditioning levels and provides a means to quantify its extent. Statistical analysis from several tests is conducted to establish preliminary relations between conditioning and impact breakage strength.
At the early stages of this research it was difficult to obtain natural rock samples that would have homogenous and isotropic mechanical properties and it could be shaped to suit the constrained requirements of controlled blasting experiments. For this reason, it was decided to embark in the development of a synthetic rock like material, which has been common practice in the study of blast damage and fragmentation (Reichholf, 2003; Iverson et al., 2010; Sellers et al., 2010). Costs, logistics and operational factors, such as procedure and time of preparation, also had to be considered in the development of this material. The work discussed corresponds to the joint effort of research conducted in collaboration with the CSIRO Parker Centre. This was part of the AMIRA Project ‘Geometallurical mapping and mine modelling’ of which the authors were principal participants (AMIRA, 2013). Details of the synthetic material development and selection criteria are given in Parra (2013). The final synthetic material selected in the experimental work was based on a Conbextra cement grout (distributed by Parchem, Sydney, Australia). The preparation of each batch consisted of 20 kg of Conbextra GP, 400 g of copper powder (size <63 μm) distributed by Merck (Darmstadt, Germany) and 3 L of water.
The research approach involved two stages of experimental, modelling and statistical analysis:
Stage 1 comprised one controlled test (e.g. P0) using a PETN charge that was designed as an exploratory experiment. This test also allowed the definition of operational and logistic matters associated with the casting and blasting of the samples such as curing time, mixer operation, fragment confinement and sampling. This stage also helped verify the synthetic material suitability, stress intensity of the small charge and effect of boundary conditions. Preliminary modelling is also conducted in this stage and a methodology to define conditioning zones is introduced.
Stage 2 comprised two controlled repeatable tests with emulsion charges (E1 and E2). This stage was used to validate the experimental procedures and study the potential links between fragment conditioning and impact breakage strength. In all these analyses, numerical modelling is used to define conditioning zones and support the grouping of samples for subsequent statistical analysis.
During stages 1 and 2, impact breaking tests to determine the A*b ranking parameter were conducted pre and post-blast. The rotary breakage test (RBT) described by Shi et al. (2009) was used for this purpose. The test operates by throwing a set of individual fragments at a known velocity against the walls of a cylindrical device. The size distribution resulting of all fragments is analysed to calculate an average value of A*b. The A and b parameters in conjunction with specific comminution energy are used in AG/SAG mill modelling. These two parameters are highly correlated with the drop weight strength index (Morrell, 2004). This indirect method analyses conditioning under the premise that the greater the number of fractures inside the fragments, the lower the impact breakage properties of the material. In this case, the higher the (A*b) value, the weaker the material. The advantages of the RBT test developed by the JKMRC and commercialised by JKTECH Pty Ltd is that smaller samples can be used to derive rock impact breakage strength. This particular test has been validated by Dr Simon Michaux, one of the authors of this paper.
In this case, samples consisted of 10 fragments which weigh at least 50 g in total. Each of the fragments that conforms a given sample is collected from zones that are expected to be affected by different degrees of damage (conditioning). This is due to the combined influence of stress intensity and boundary conditions. In laboratory scale blasting, distance from the charge will not be necessarily correlated to degree of conditioning. Boundary conditions play a major role (i.e. tensile reflections). In this case, both physical observations as well as output from the hybrid stress blasting model (HSBM) were used to obtain an educated estimate of the expected conditioning zones. The HSBM code has been validated with respect to damage/conditioning predictions (see Onederra et al., 2013).
In general, the HSBM code models the blasting process from explosive detonation through to rock breakage and fragmentation. This code has the ability to combine the effect of stress and the gas flow into the calculations, which are the two mechanisms syndicated as crucial in fracture generation and propagation processes. As described by Furtney et al. (2011) the code uses a combination of continuum numerical technique and discrete element modelling (DEM) to model explosive rock interaction. The near-borehole area is represented using FLAC while DEM is used to represent the rock mass. The DEM representation uses a lattice-scheme where the rock matrix is created as a collection of randomly distributed points connected by springs. The theoretical distance between different springs depends on the resolution used for modelling. The key inputs of the model are: detonation parameters (i.e. explosive density, velocity of detonation, decoupling, etc), material properties (i.e. density, unconfined compressive strength (UCS), tensile strength, Young's modulus, etc) and stress/strength attenuation.
Stage 1 – exploratory experiment
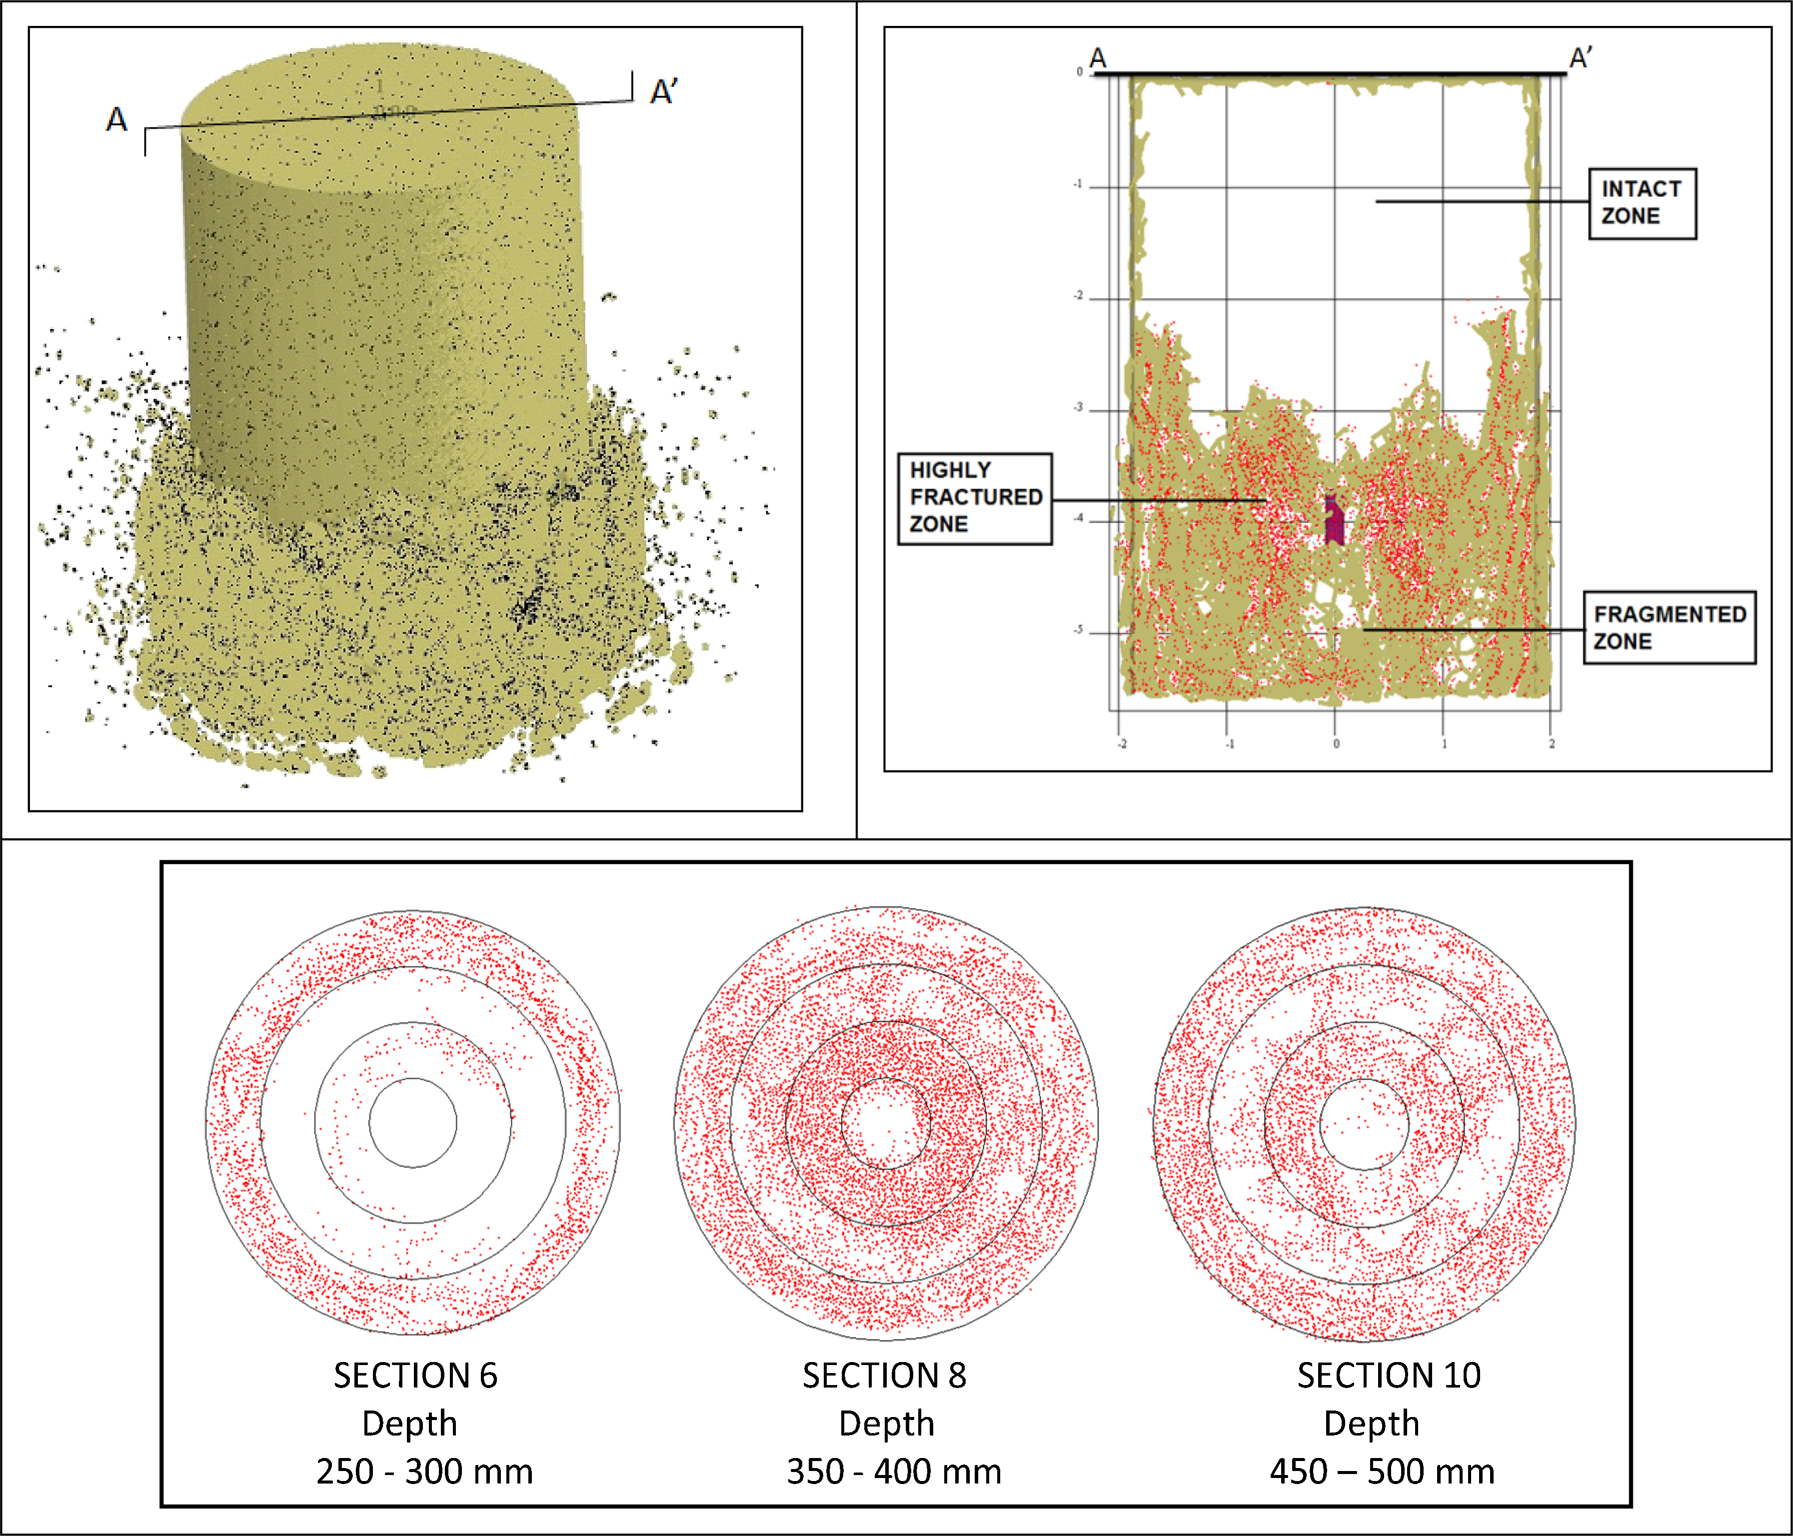
Several batches were prepared in series and poured layer by layer into a 0·4×0·55 m drum within a short window of time. This was to avoid the hardening of the grout during the process; and potentially reducing heterogeneity during mixing. Finally, a 28 mm diameter bar was placed in the centre of the drum with the objective of creating a borehole. The sample was left to cure for 10 days before blasting to ensure it reached its peak strength. Density, UCS and P-wave velocity measurements were performed on eight core samples from the casting process. The average density, UCS and P-wave velocity of this test was 2·1 g cc−1, 61·7 MPa and 3418 m s−1 respectively. After the peak strength was reached, the sample was taken to the University of Queensland Experimental Mine where it was placed inside a 44 gallon drum, filled with rubber. The main objective was to contain the material in place after blasting. The final configuration of this particular test is depicted in Fig. 1.
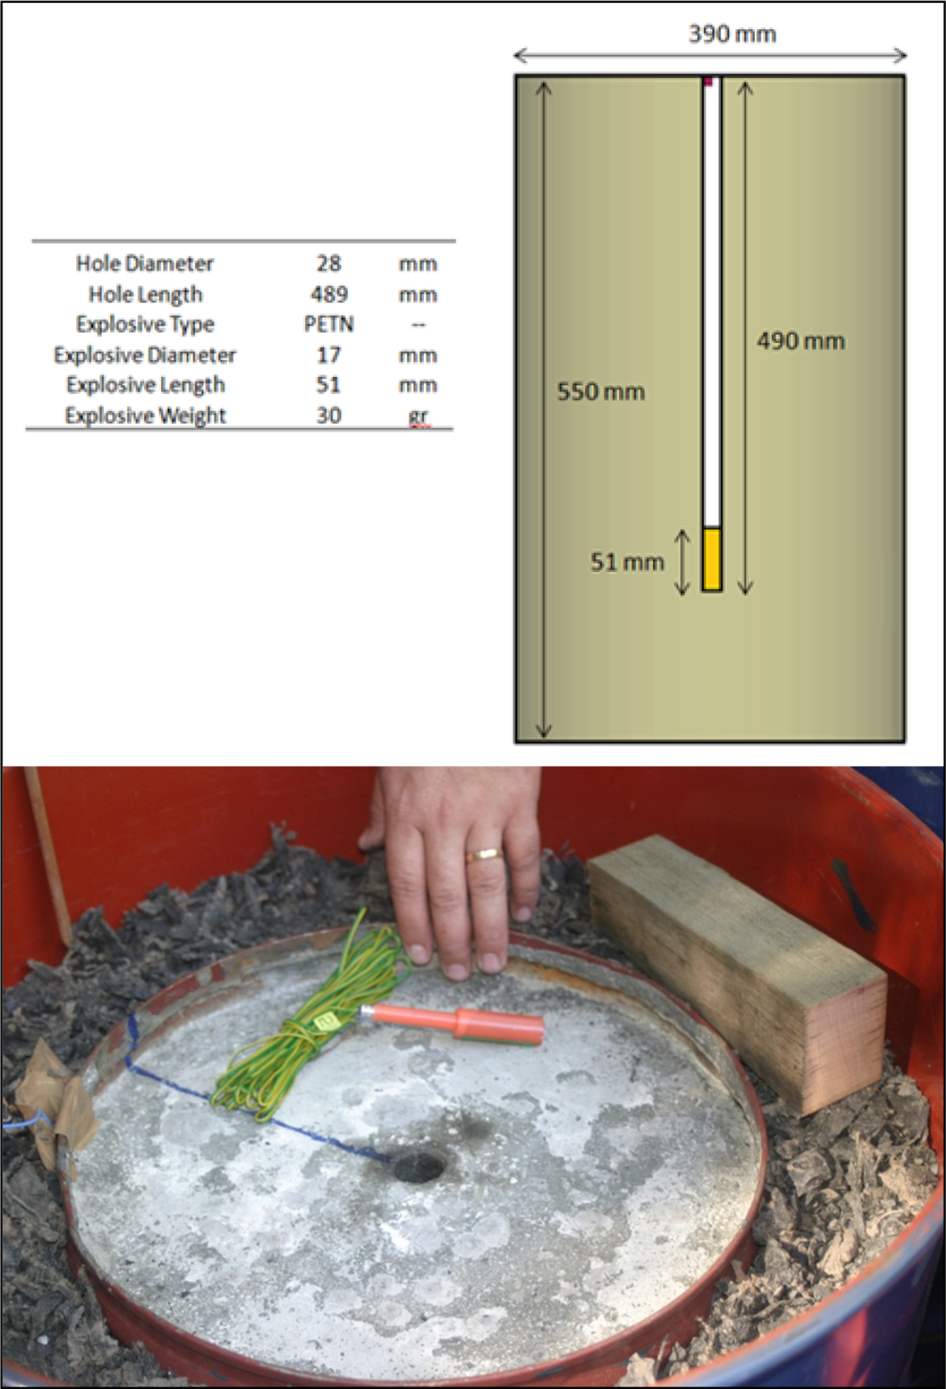
Experimental set up of exploratory experiment (P0)
After blasting, the sample was transported to a covered area where it was removed from the 44 gallon drum. The cylindrical sample was prepared for sampling by cutting and peeling off the metal container. Finally, slices were marked every 50 mm from top down and every 45° around the borehole in order to perform the sampling process in a systematic way.
As shown in Fig. 2, the top of the sample remained in one piece after blasting and not much fracturing was observed. In contrast, intense fracturing and a relatively well-fragmented zone were found at the bottom of the drum, just below the explosive charge. As shown in Fig. 3, over the zone below 200 mm depth, six main radial fractures and a number of secondary fractures were observed. It was also observed that the majority of the fine material generated in the top section of the sample came from the boundaries of the sample and along main fractures (see Fig. 4). This is consistent with previous work and also from observations from large scale blasting where surface boundary conditions play a key role in fracturing.
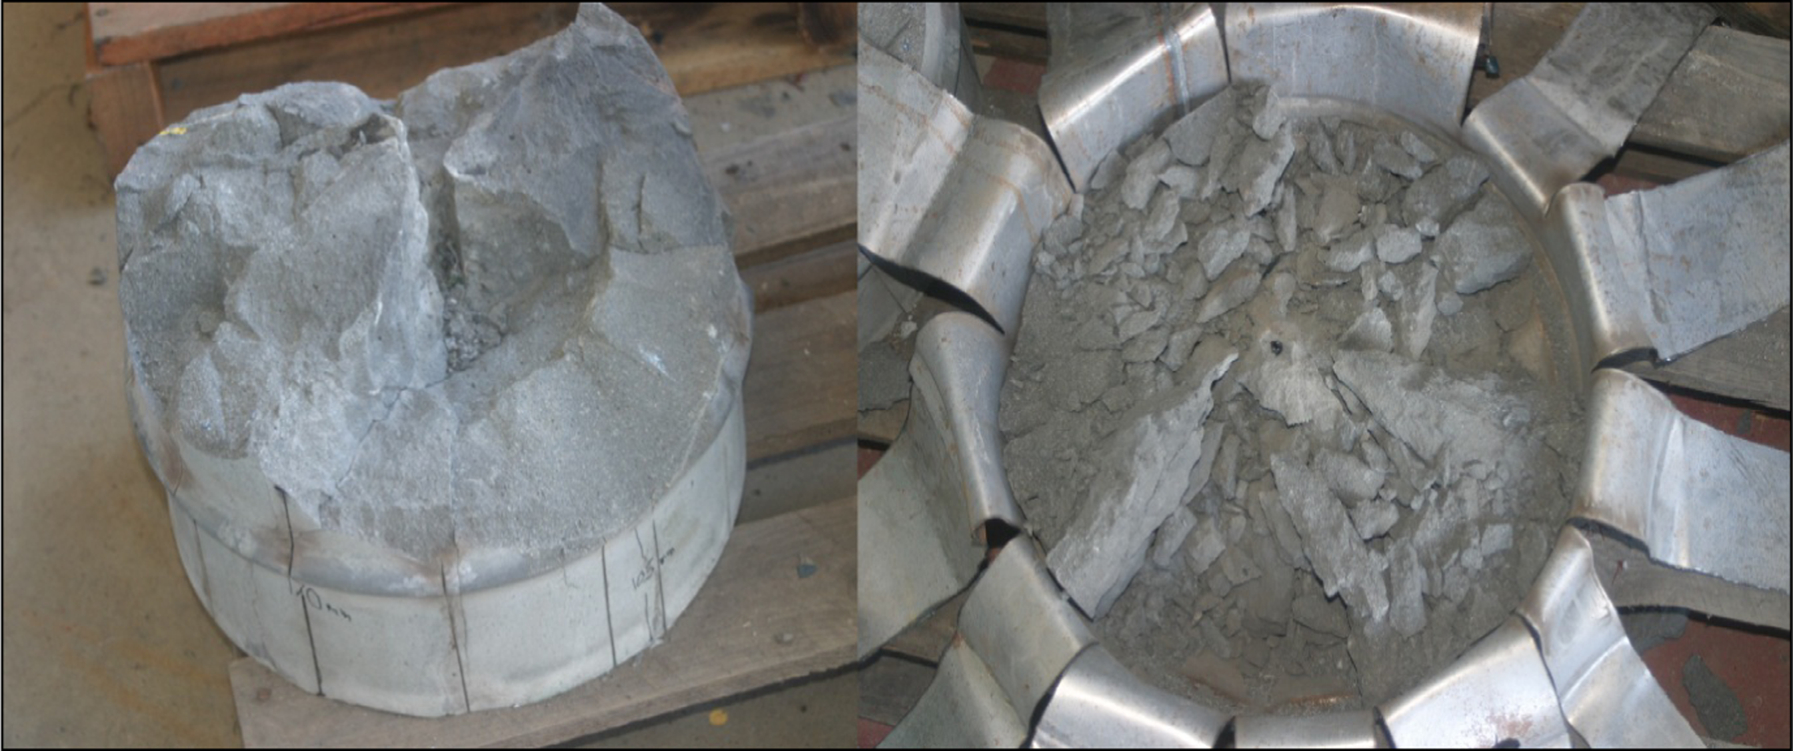
Sample's top flipped (left); fragmented zone below explosive charge (right)
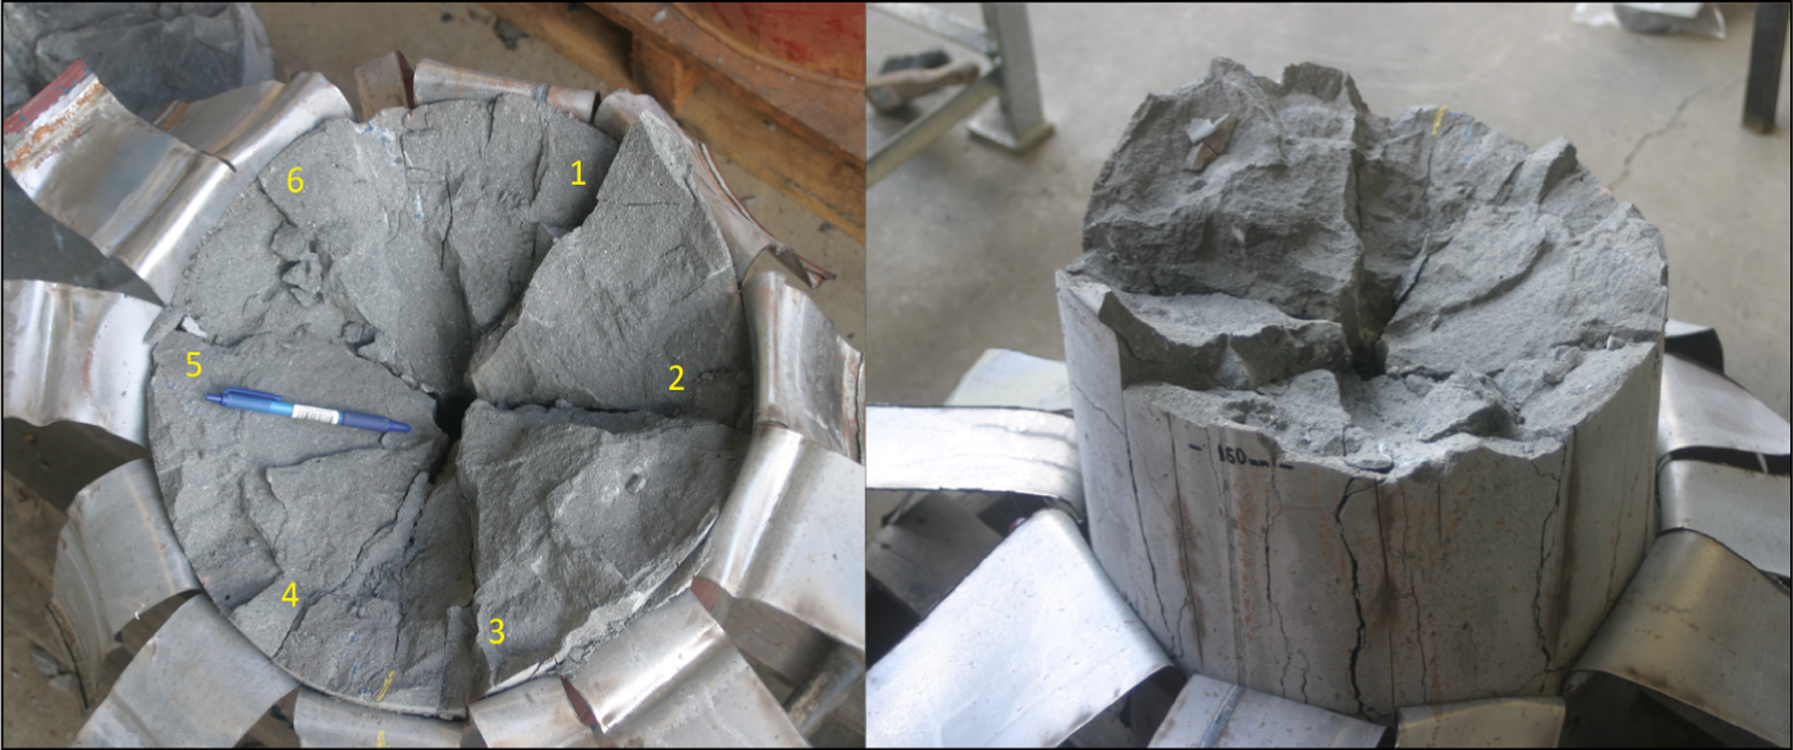
Radial fractures at 235 mm depth (left); overall fracturing (right)
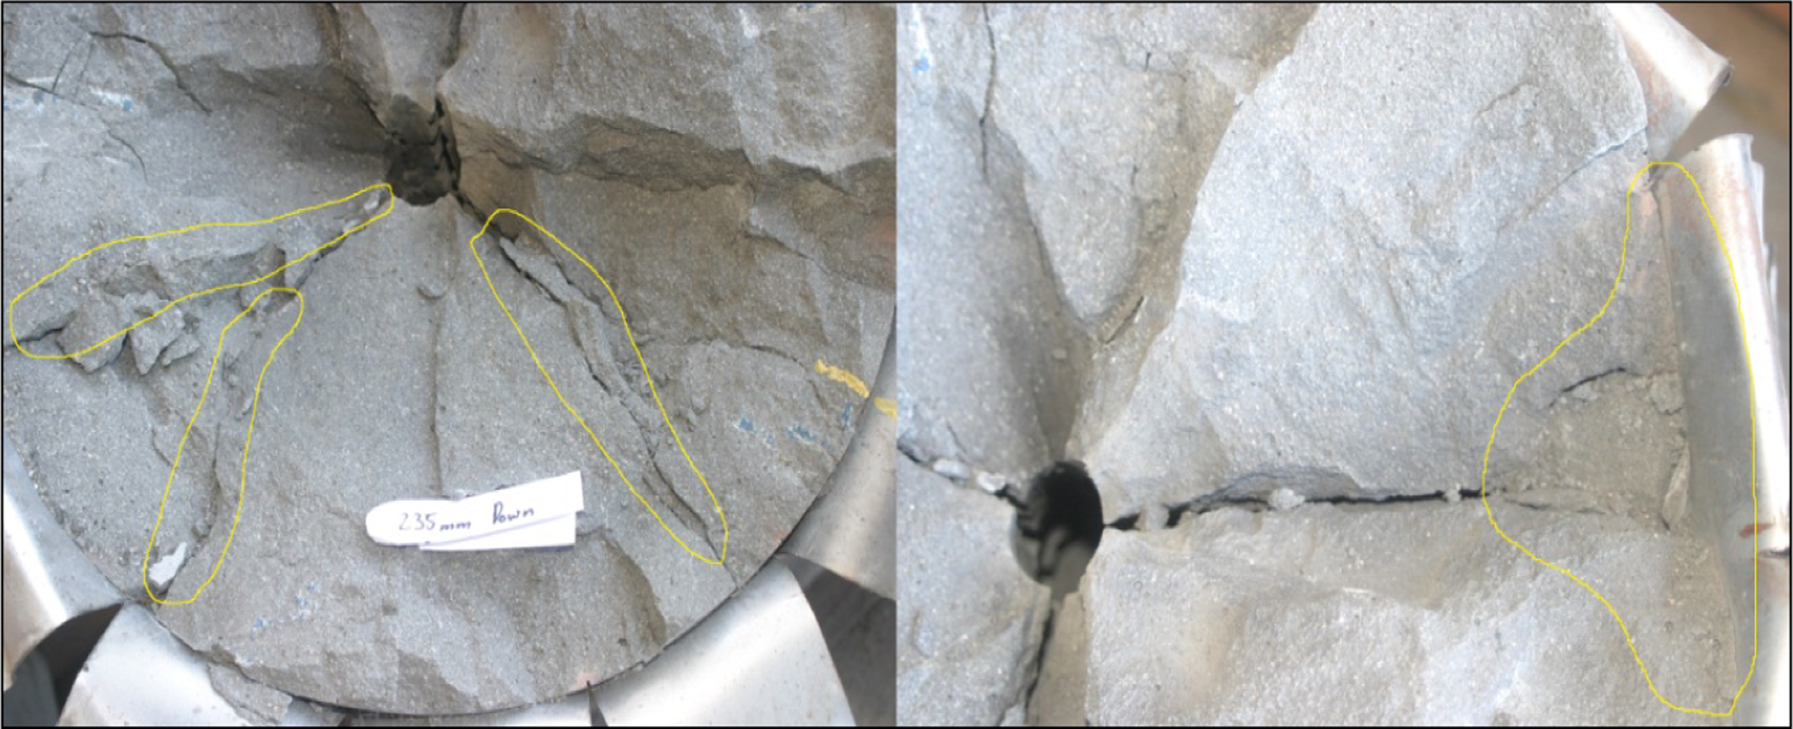
Fines along main fractures (left); fines created from the limits (right)
Four samples comprising 10 fragments were collected from different zones around the explosive charge. These were expected to be affected by different degrees of damage (conditioning) given by the combined influence of intensity and boundary conditions. Preliminary impact breakage tests were conducted in order to indirectly evaluate differences in breakage strength when compared to unblasted material.
During this preliminary experiment, four fresh (unblasted) samples consisting of 10 fragments each were also collected from a control sample to provide a reference point for comparative analysis. These samples were cut with a high precision diamond saw to match the size fraction of the blasted fragments which were also cut with the same piece of equipment.
In addition, two samples, designated as A and B, were used to measure the initial condition of the material directly using X-ray tomography. Another two samples designated as u1 and u2 were used to measure the initial condition indirectly through RBT tests. Each sample consisted of fragments within a narrow size fraction, the size of the samples ranged from 13·2 to 19 mm with a minimum total weight of 50 g. It is important to note that the number of samples tested during this stage was limited by the costs and time required by the X-ray tomographic scanning, process and analysis of data.
Analysis of conditioning from stage 1
In small scale blasting, fragment conditioning is not necessarily correlated with distance from the explosive charge, as the breakage and damage process can be complex. Boundary conditions have a strong influence on the stress field generated, particularly in terms of the expected intensity of stress wave reflections. During the analysis of direct measurements, some characteristic trends were identified. For instance, the majority of the microfractures generated in the fragments corresponded to transgranular (i.e. 62%) and intergranular (i.e. 35%) fractures. Intragranular fractures were not common (i.e. 3%) in this synthetic material.
Preliminary observations indicated that when the degree of conditioning is high, which may be linked to a higher level of stresses experienced by the material, it is more likely to find all three types of microfractures. Very low conditioning which may be related to lower stress levels are mostly associated with the existence of only transgranular fractures.
It is also important to note that a number of microfractures were associated with the presence of pores. It appeared that the pore structure had an influence on both the direction and the length of the fractures. At the same time, the largest grains into the material's matrix seemed to have relevance in the direction of propagation of fractures.
As mentioned previously, two unblasted (u1 and u2) and four blasted (b1, b2, b3 and b4) samples were collected and then crushed by impact in order to quantify the potential variation in strength of the fragments. The samples selected were broken according to the modified RBT procedure. Results from this analysis are shown in Fig. 5. The values clearly evidence the impact of blasting on the reduction of the material impact breakage strength. In this case, the average strength reduction between unblasted and blasted samples is in the order of 39%. The variation in the blasted A*b values suggests that there is no evident relationship between the material strength and the position of the samples and distance from the explosive charge.
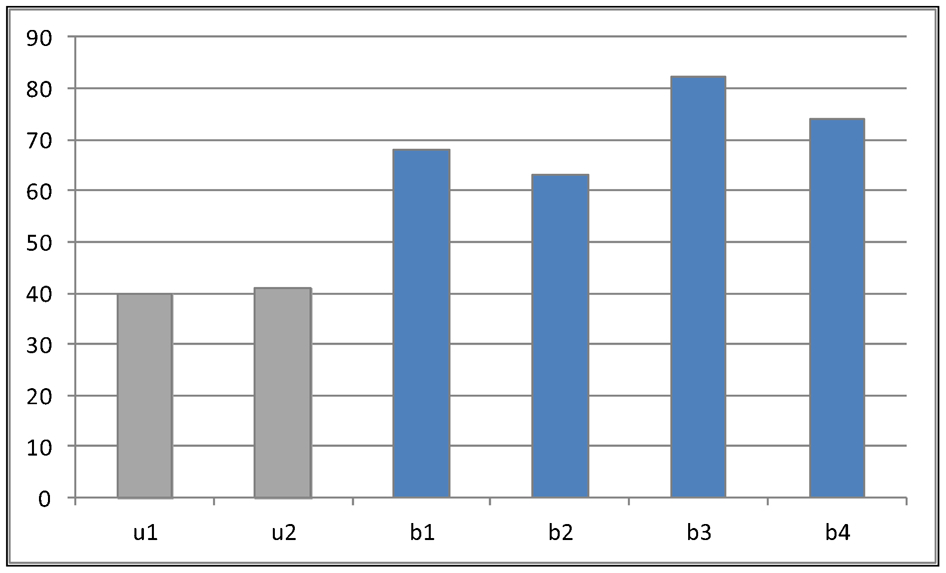
A*b values for unblasted (u1, u2) and blasted (b1–b4) samples
Preliminary modelling of stage 1
One of the key objectives of applying a modelling tool such as the HSBM was to better define the expected influence of boundary conditions on the final breakage patterns damage state of the synthetic sample as well as the potential degree of conditioning inside fragments after blasting. The application of the HSBM model for analysis of damage (conditioning) has been previously demonstrated and validated by Onederra et al. (2013). One of the key objectives of applying a modelling tool such as the HSBM was to better define the expected influence of boundary conditions on the final breakage patterns damage state of the synthetic sample as well as the potential degree of conditioning inside fragments after blasting. The experimental results from this stage were used to calibrate a model. Besides the geometry of the sample and the type of explosive; density, UCS and velocity of detonation were the material properties used as input into this model.
Results from this preliminary model are shown in Fig. 6. Most of the breakage and damage was concentrated in the lower part while the top remained undamaged. This matched the results from physical experiments and therefore demonstrated the ability of the HSBM model to replicate actual results if an appropriate calibration procedure is adopted.
Output from HSBM modelling of exploratory test
As previously mentioned, failure of individual strings shown in red was seen as a potential indicator to quantify conditioning (internal damage) across the sample. Figure 6 shows some examples of this internal damage (conditioning) at different depths within test P0.
A procedure was implemented to map the density of failed strings to identify different conditioning regions. A conditioning index was calculated as the ratio between the number of fractures inside the rings of the analysis grid and the volume of those rings. Figure 7 presents a plot of this conditioning index which is represented as number of fractures per cubic centimetre. This particular analysis was used to confirm that damage and conditioning outcomes in controlled blasting at this scale would be strongly influenced by both the position of the explosive with respect to free faces and the initiation point. These two parameters define the shape and intensity of the fracturing generated by propagation and interaction of stresses from the detonation of an explosive charge. The proposed conditioning zoning based on physical observations and modelling results was considered appropriate in order to guide the sampling strategies of repeatable tests.
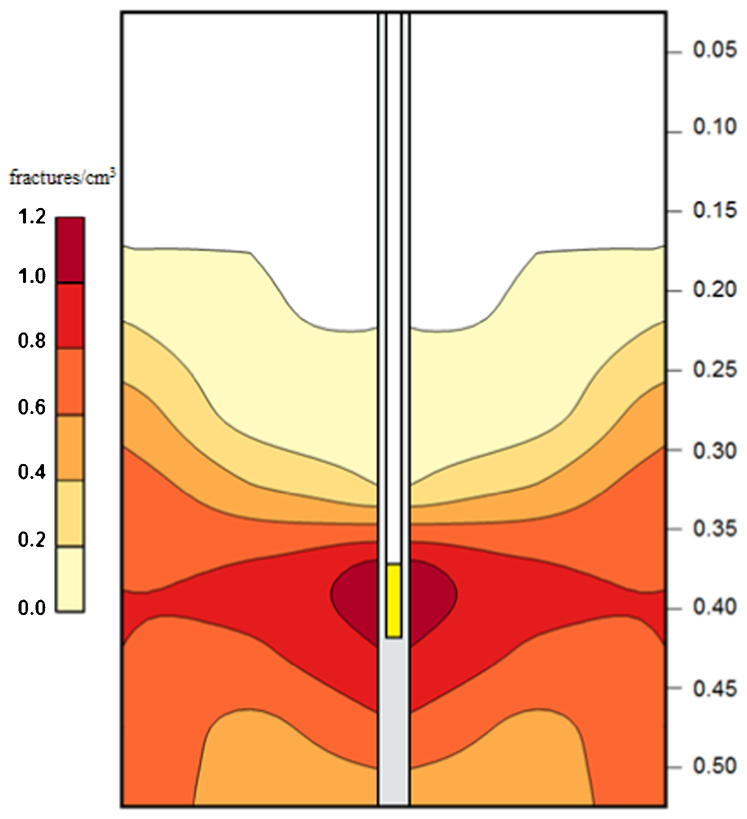
Contours of conditioning zoning of exploratory test
Stage 2 – repeatable tests
Figure 8 shows the experimental set up implemented in repeatable tests E1 and E2. The emulsion based explosive charge is 60 mm long located at the centre of the cylinder with a reduced borehole diameter (e.g. 17 mm) to minimise excessive pulverisation and fine fragmentation. A uniaxial shock accelerometer rated to 100 000g was also installed to measure peak radial velocities.
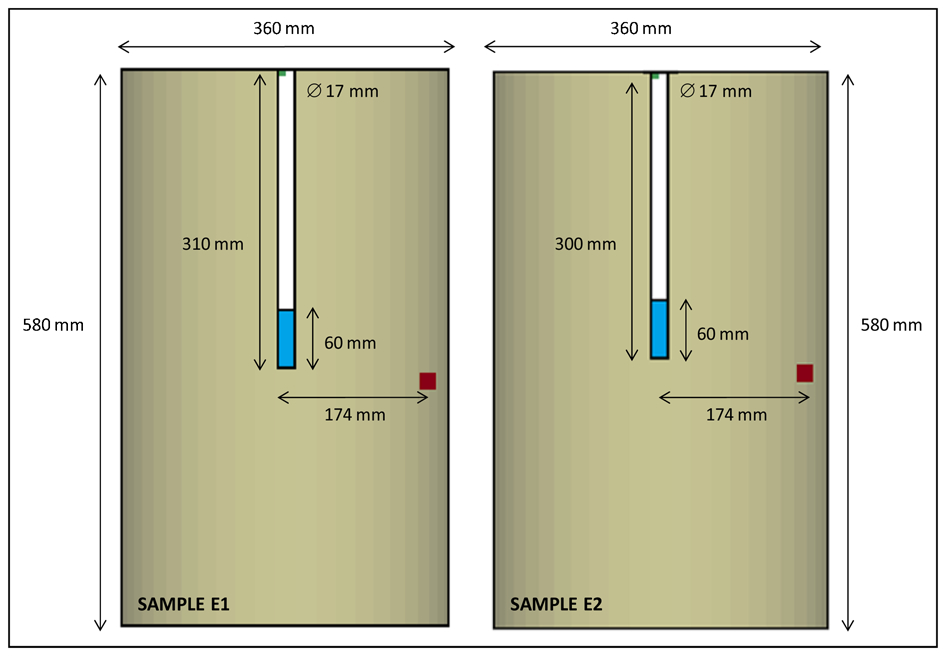
Experimental set up of controlled blasting repeatable tests
Tests E1 and E2 showed similar overall breakage patterns. Seven major radial fractures running all across the samples were generated. They defined the sliced shape of the biggest fragments. Figure 9 shows these fractures at top and around 100 mm depth for drum E1 and E2. Figure 9 also shows the semi-conical shaped bottom resulting in drums E1 and E2. In both samples, this solid portion is almost undamaged and is delimited by the major fractures previously mentioned.
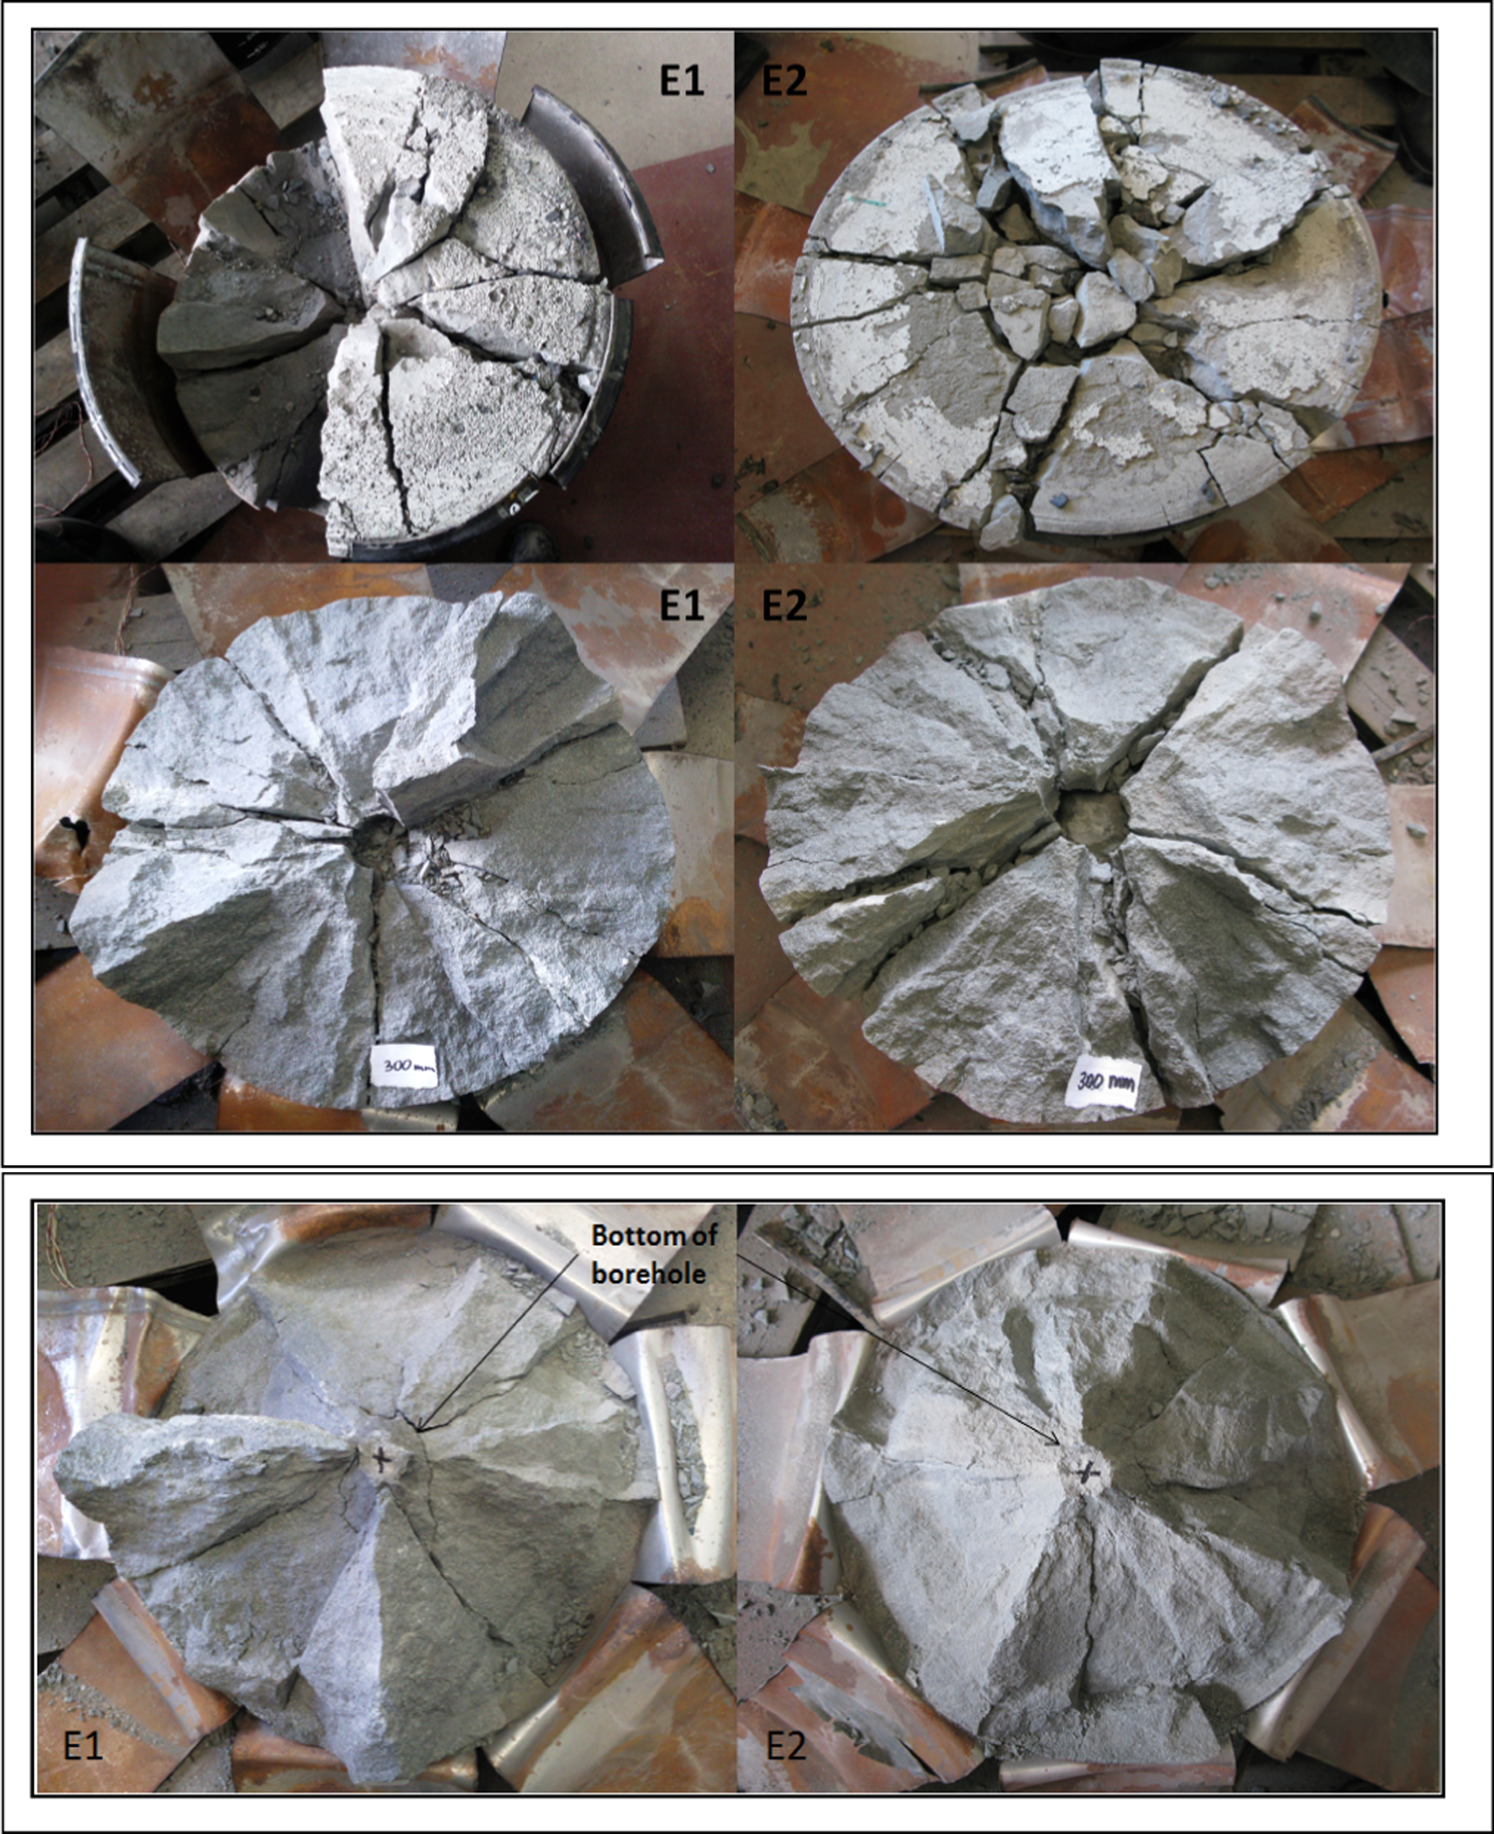
Major fractures in tests E1 and E2 at top, mid depth and bottom of sample
After these tests, a more thorough model calibration procedure was adopted using results from the first test (i.e. E1). Velocity histories were added to the HSBM model to match the peak arrival measured using the shock accelerometer. Breakage patterns were also used to calibrate the first test. A solid conical portion was developed below the explosive charge while zones of low damage are found on the top of the samples as shown in Fig. 10. The model was subsequently run by only modifying the geometry that matched the actual configuration of E2. The results from this model are given in Fig. 11.
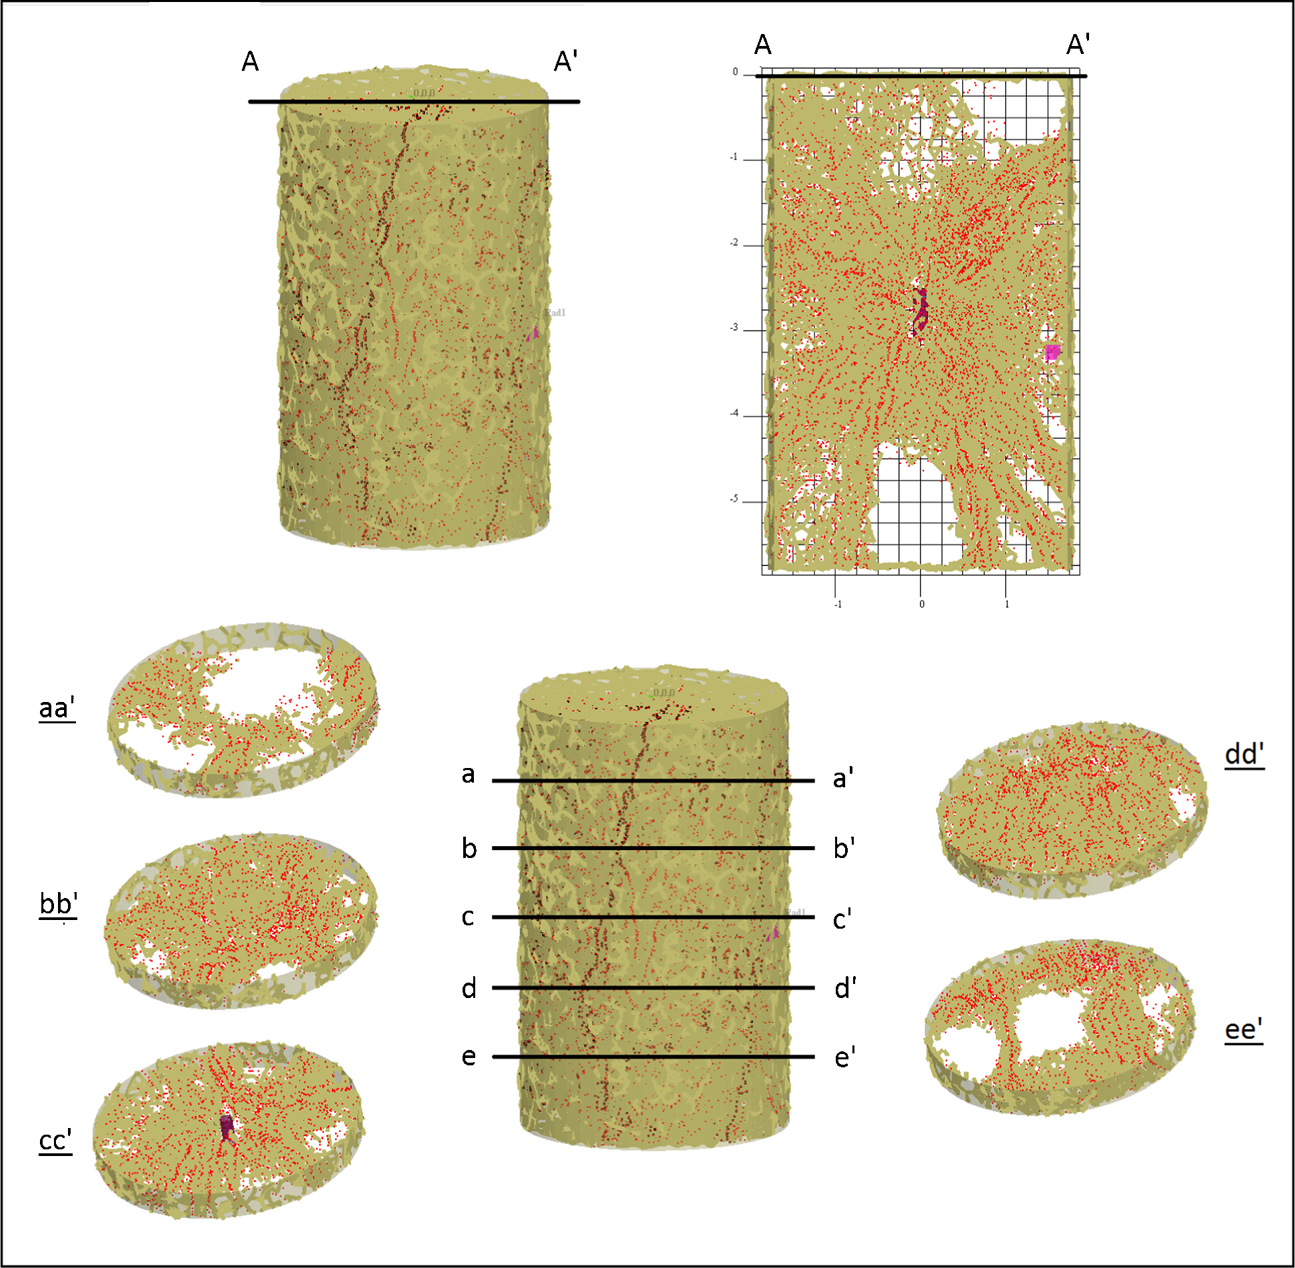
3D modelling output showing zones of damage in test E1
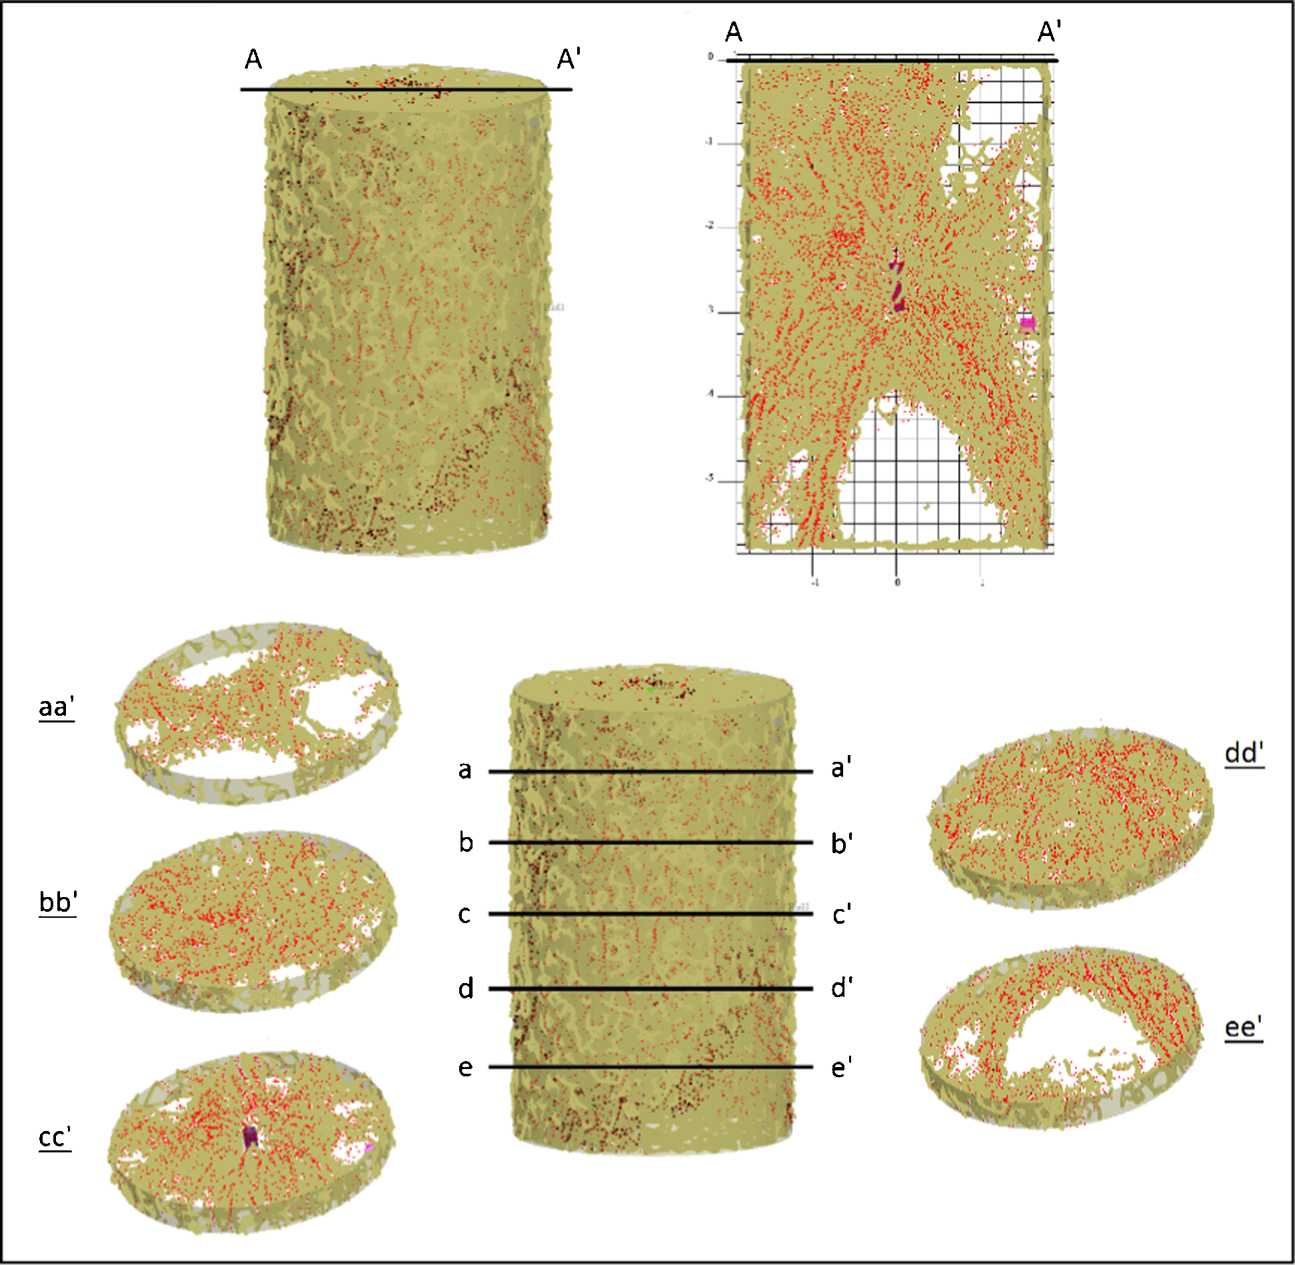
3D modelling output showing zones of damage in test E2
As shown, no significant differences were found between the two models in terms of extension of conditioning zones. However, it was observed that the slightly higher position of the charge in test E2 made the solid conical portion below the explosive charge slightly bigger and that the higher intensity conditioning zone is extended a little further towards the top. This was consistent with the differences observed in the physical experiments.
Following the approach discussed in the exploratory experiment, the number of fractures represented as red dots and shown in Figs. 10 and 11 are counted for each section to calculate the conditioning degree indices for these tests. The iso-contours from this analysis describing low, intermediate and high conditioning zones are shown in Fig. 12. There are no major differences between the conditioning profiles for tests E1 and E2. The shape and extent of the high and intermediate conditioning zones are similar and are centred on the explosive charge. The low conditioning zones are located on the bottom and top of the samples. The shapes of the zones can be explained by the effect of the point of initiation position (top) and the direction of propagation of the detonation front. The spatial distribution of the zones of damage is also consistent with observations of the physical results. In these experiments, no fragments could be collected for analysis from the high conditioning zones. This is because most of them did not reach the minimum size defined as acceptable for further testing (i.e. 13·2 mm).
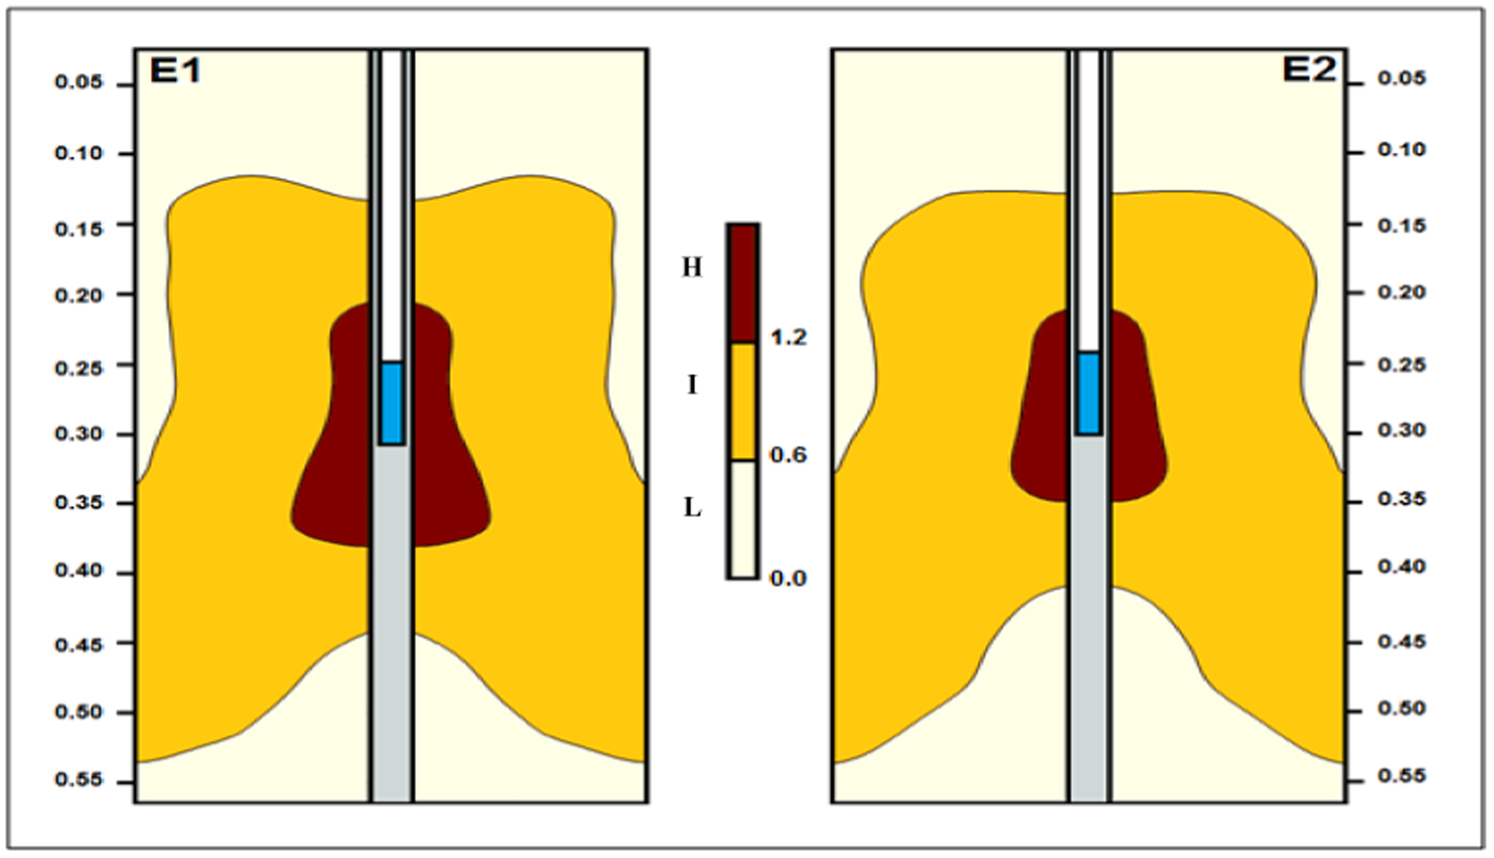
Plot of contours of conditioning degree indices (H: high; I: intermediate and L: low conditioning) for tests E1 and E2
Statistical analysis based on conditioning zoning
The data obtained were analysed using descriptive statistical techniques and presented on both interval and box-and-whisker plots. This type of analysis is particularly useful when evaluating the disparity or consistency of measured parameters. Differences between unblasted material and different levels of conditioning were assessed by performing analysis of variance (ANOVA) statistical hypothesis tests for a single factor. The analysis uses variance to evaluate differences on group means.
A total of 44 samples were subjected to RBT. For test E1, 10 samples were found to be within the low conditioning area; and 10 belonged to the intermediate conditioning zone. In test E2, 11 and 13 samples were found to come from the low and intermediate conditioning zones respectively. Figure 13 shows the interval and box-and-whisker plots for tests E1 and E2 respectively. The graphs indicate that the scatter of the values for the samples within the intermediate zones was greater than that encountered within the low conditioning area. These analyses also evidenced that test E1 presented data far more dispersed than test E2. Statistical analysis showed that for both samples the impact breakage strength of the material decreased after blasting. Test E1 showed an increase in the A*b (ranking value) of 26·9 and 57·1% for low and intermediate conditioning degree respectively. In the case of test E2 the material increased its impact breakage ranking by 14·3 and 20·2% on average for low and intermediate conditioning zones respectively. As discussed earlier, the greater the A*b ranking parameter, the weaker the sample.
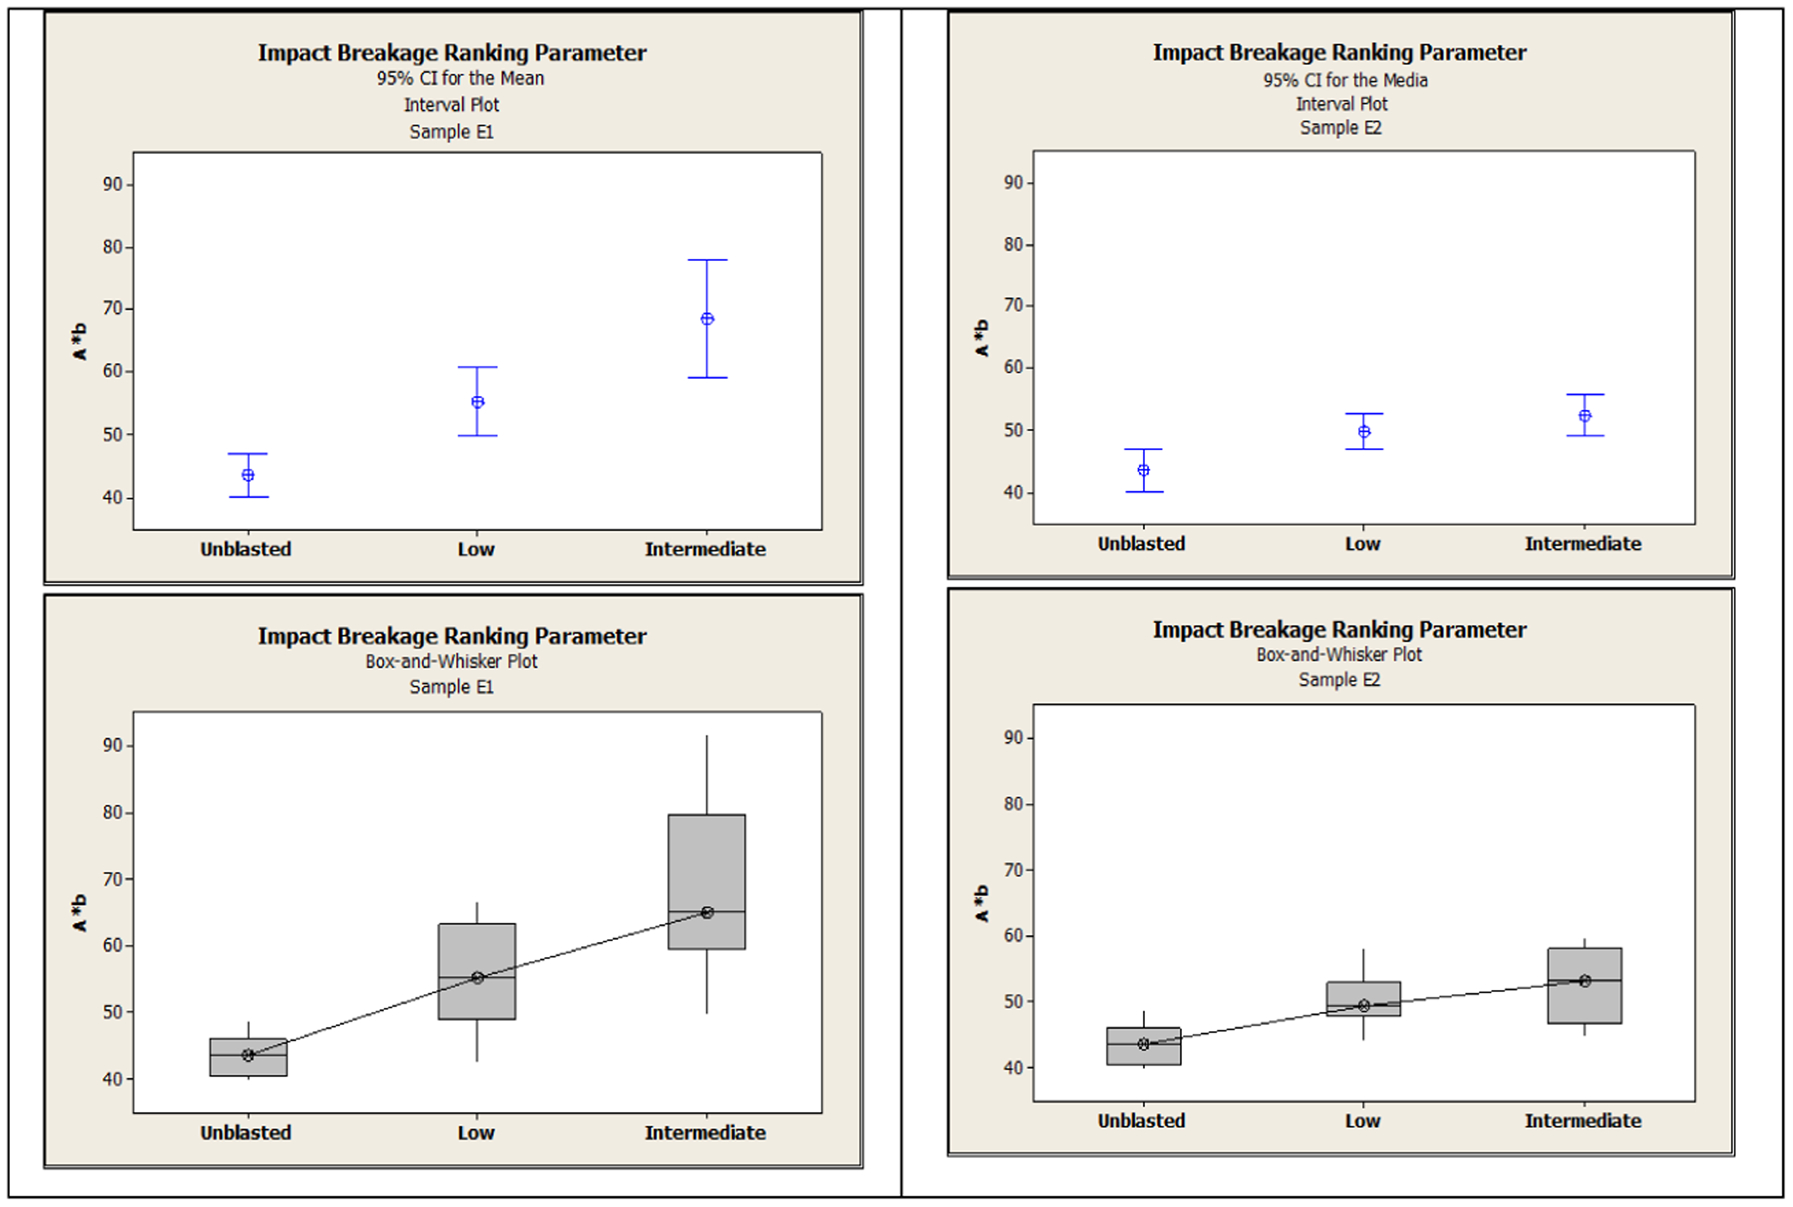
Impact breakage ranking parameter v. conditioning zoning for test E1 (left) and E2 (right)
Analysis of variance also indicated that for both tests (i.e. E1 and E2) there was a statistically significant difference between the strength of unblasted material and of material in both the low and intermediate conditioning zones. However, in test E2 there was no significant difference between the effect in low and intermediate conditioning zones. This may be attributed to the complex mechanisms of fracturing involving loads at high strain rates coupled with unpredictable heterogeneities. Despite this, physical and modelling results confirmed that the results of both blasting tests were similar. By combining the results of both tests and grouping samples into specific conditioning zones, the complete dataset showed that the fragments belonging to both low and intermediate conditioning zones presented a reduction in impact breakage strength after blasting. The impact breakage ranking parameter (A*b) of the material increased 20·3% on average when fragments were in the low conditioning zone. This increase reached 33·1% when the material was obtained from the intermediate conditioning zone. Interval and box-and-whisker plots from this analysis are shown in Fig. 14.
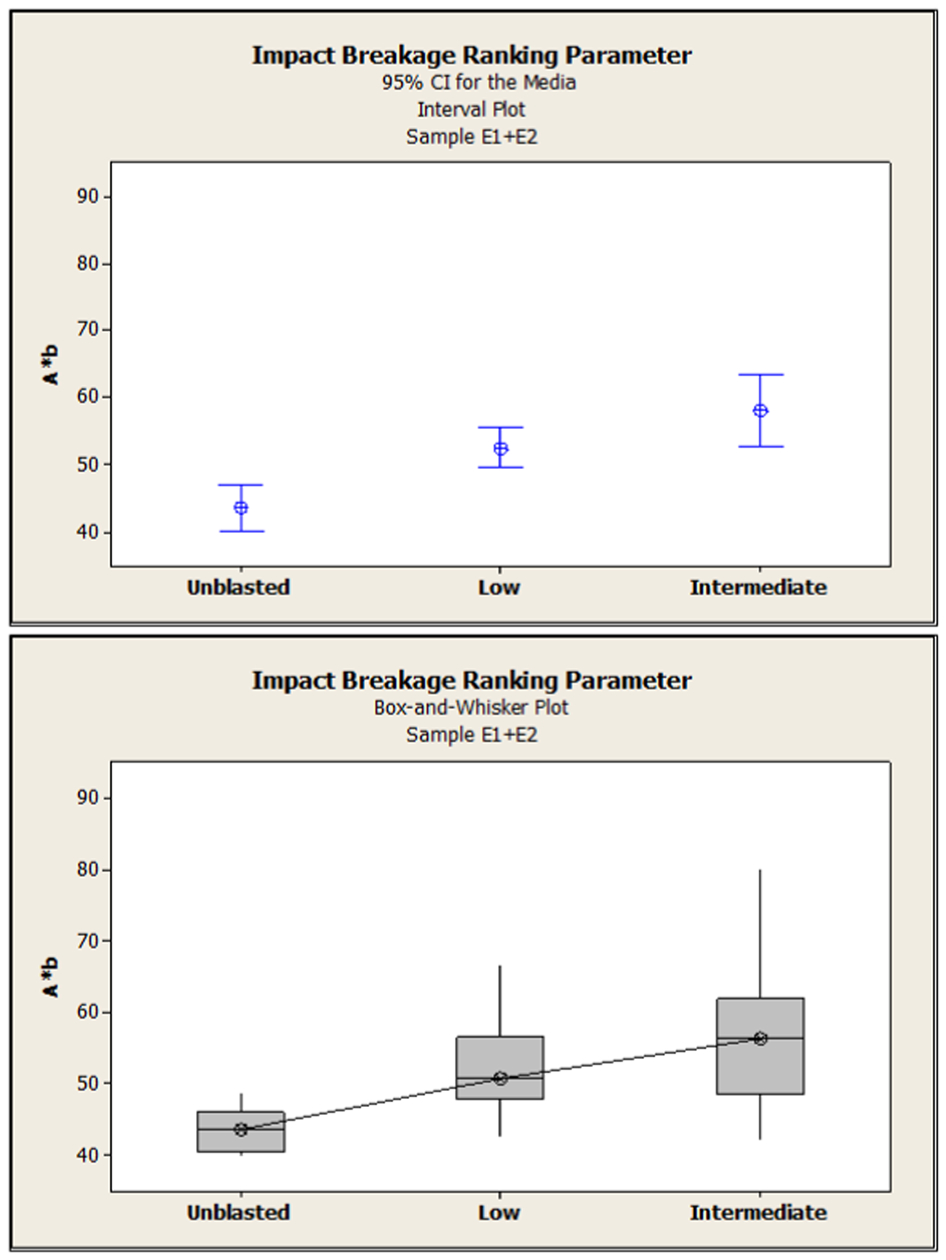
Impact breakage ranking parameter v. conditioning zoning of combined tests
At the time of writing this paper, another two validation tests had been conducted. Results were consistent with the trends described in these repeatable tests. Final results and analysis from these validation tests will be reported in a subsequent publication.
Conclusions
Controlled blasting tests and blast modelling work were conducted to understand and quantify the effect of blasting on the creation of fractures inside fragments referred to as conditioning. Fragment conditioning is studied through the use of indirect and direct measurement techniques on samples collected from different zones around an explosive charge. Modelling is used to map different levels of conditioning throughout the blasted samples and explore the impact of boundary conditions on the spatial distribution of conditioning levels.
X-ray tomography analysis performed during an exploratory experimental stage showed that intergranular fractures were the most abundant in this type of synthetic material with around 62% of occurrence. In contrast, only around 35 and 3% of transgranular and intragranular fractures were found respectively. Additionally, an important number of fractures were associated with the presence of pores. The pore structure demonstrated to have influence on both the direction and the length of the fractures created. At the same time, the largest grains into the material's matrix had relevance in the direction of propagation of fractures.
Preliminary observations showed that when the degree of induced conditioning is relatively high, it is more likely to find all three types of fractures. However, very low overall conditioning was mostly associated with the pure existence of transgranular fractures. It appears that the progression in the stress levels is strongly related to the type of microfracturing, being the transgranular fractures the ones created at the lowest threshold, while intragranular fractures would require higher stress levels.
Accounting for the complexities associated with physical experiments, analysis demonstrated that tests E1 and E2 were repeatable and comparable. Modelling was used to map different levels of conditioning throughout the blasted samples and explore the impact of boundary conditions on the spatial distribution of conditioning levels. Combined statistical analysis of repeatable tests showed that the measured impact breakage ranking parameter (A*b) increased by 20·3 and 33·1% within the low and intermediate conditioning zones respectively. This translates into a statistically significant strength reduction of the material. These results in conjunction with other documented experience suggest that blast-induced conditioning can have a positive impact on comminution performance and thus energy consumption. Results from this work provide the basis for a methodology to better define post-blast breakage strength inputs into comminution performance models; as well as a preliminary approach to scale up the extent and degree of conditioning by blasting
Further work is required to evaluate the ability to control the degree of conditioning through the application of improvements in designs and novel blasting technology. Further validation of the conditioning zone approach is also required. A comminution index adjusted for the impact of blasting should be established to predict comminution performance more accurately. This can be based on a combination of both ROM fragmentation and expected impact breakage strength of the material. At the time of writing this paper, another two validation tests had been conducted. Results were consistent with the trends described in these repeatable tests. Final results and analysis from these validation tests will be reported in a subsequent publication
Footnotes
Acknowledgement
The authors would like to acknowledge support from industry sponsors of the AMIRA International P843A GEM project: Anglo Gold Ashanti, Anglo American, ALS, Barrick, BHP Billiton, Boliden, CAE Mining, Codelco, Geotek, Gold Fields, Golder Associates, ioGlobal, Metso Minerals, Minera San Cristobal, Newcrest, Newmont, OZ Minerals, Penoles, Quantitative Geoscience, Rio Tinto, Teck, Vale, Xstrata Copper. Support from L. Kuhar, N. Chapman and A. McFarlane of CSIRO Minerals down under is also appreciated.