
Abstract
The mining industry routinely collects samples to assist with decision making, whether for exploration, resource estimation, grade control, or plant design and balances. Poorly designed sampling protocols can result in elevated project risk by increasing variability. Critically, such variability produces both financial and intangible losses. Sample collection, preparation and assay or test work protocols that are optimised to suit the ore type, together with QAQC systems will reduce variability. Many gold deposits display a high natural variability, where the in situ variability can be enhanced by poor sampling practice to yield a high-nugget effect. In this case, specialised protocols are often required. Reporting codes require the Competent Person to consider the quality and implication of sampling programmes. Despite its importance, sampling often does not receive the attention it deserves. In this paper, the importance of good sampling practice is exemplified through a series of case studies, which show the many sampling issues that frequently go unrecognised or unaddressed, resulting in poor decisions and financial loss.
Abbreviations
atomic absorption spectroscopy;
accelerated cyanide extraction;
analytical error;
blast hole drilling;
constitution heterogeneity;
Certified reference material;
correct sampling errors;
distribution heterogeneity;
delimitation error;
gold liberation diameter;
extraction error;
fire assay;
sampling error;
geological nugget effect;
gravity recoverable gold;
grouping and segregation error;
half absolute relative difference;
heterogeneity test;
diamond drill core (diameter of 63.5mm);
incorrect sampling error;
sampling constant;
diamond drill core (diameter of 48mm);
pulverise and leach;
preparation error;
quality assurance/quality control;
reverse circulation drilling;
run of mine;
screen fire assay;
sampling nugget effect;
theory of Sampling
Introduction
The importance of high-quality sampling throughout the gold mine value chain, from exploration, through evaluation and exploitation, has been stressed by many authors (Carrasco, Carrasco and Jara 2004; Dominy, Noppé and Annels 2004; Gy 1982, 2004; Holmes 2004, 2015; Minnitt 2007, 2013; Morrison and Powell 2006; Pitard 1993, 2009; Sketchley 1998; Spangenberg 2011). The sampling process, inclusive of sample collection, preparation and assaying or testing, is a critical component to all stages of a mining project as it forms the basis for Mineral Resource and Ore Reserve estimates (JORC 2012). Sampling includes in situ material and broken (or crushed) rock for both geological and metallurgical purposes. The focus is often on grade sampling (e.g. resource definition and grade control), though metallurgical sampling for plant design, control and metal balances (Giblett, Dunne and McCaffery 2012; Guresin et al. 2012; Holmes 2004) must not be ignored.
In all cases, the aim is to gain a representative sample to accurately describe the material in question. Field sample collection is followed by sample reduction in both mass and fragment size to provide an assay charge or test sample. This process is challenging in the gold environment and particularly when a high-nugget effect and/or coarse gold is present (Dominy 2014a; Dominy, Johansen, Annels and Cuffley 2000; Dominy and Petersen 2005; Pitard 2007; Royle 1989).
This contribution presents case studies that exemplify some of the sampling issues that can be typically identified across the gold mine value chain. The effects of poor practice are presented and solutions given. An attempt is made to provide a financial and intangible loss estimate for each case study.
Theory of sampling
Theory of sampling overview
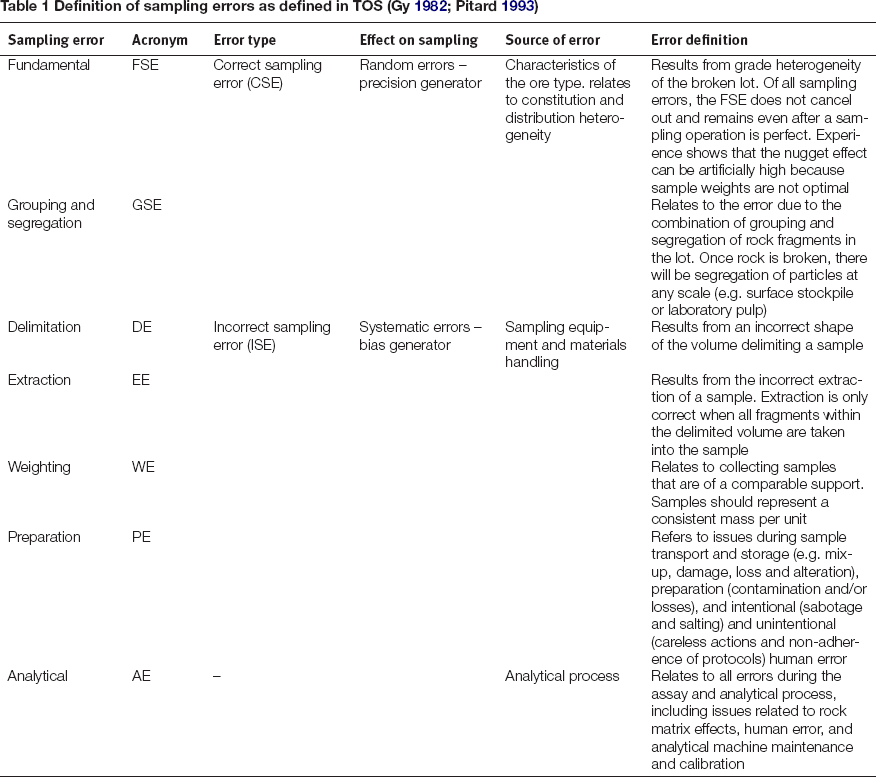
Samples should be collected and prepared within the framework of the Theory of Sampling (TOS) (Gy 1982; Pitard 1993), along with an appropriate QAQC system (Sketchley 1998; Simon and Gosson 2010; Vallée 1998). Sampling errors are defined in TOS; the key errors are defined in Table 1 (Gy 1982; Pitard 1993). Uncontrolled errors lead to an elevated nugget effect (Carrasco 2009; Dominy 2014a; Pitard 2007).
Theory of sampling was developed in the 1950s by Dr Pierre Gy at the time to deal with sampling challenges in the mining industry (François-Bongarçon 2008; Gy 1982). Its usage subsequently spread to other sampling applications across the food, pharmaceuticals, environmental and waste management sectors to name a few. Across the mining industry, its application has been highly variable though on the increase since the late 1980s, but to date not routinely applied. Over the last 15years, the author has had involvement with around 120 gold projects globally, for which only around 20 could be said to be fully compliant with TOS.
Some authors have questioned the applicability of TOS and in particular the so-called FSE equation applied to gold (Geelhoed 2011). François-Bongarçon (1998) and François-Bongarçon and Gy (2002) addressed key issues and proposed a modified FSE equation. The modified equation has been applied successfully by practitioners to optimise sampling campaigns (Afewu and Lewis 1998; Cintra et al. 2007; Cossio, Noyola, Gonzalez and Espinosa 2004; Dominy and Petersen 2005; Dominy, Platten, Xie and Minnitt 2011; Fallon et al. 2012; Pitard 2009). The use of the equation represents a modelled expectation that may or may not be attained in practice, but provides a starting point for optimisation.
Beyond the FSE equation, TOS provides important guidelines for reducing the sampling errors (Table 1). It is here to stay, though there is still much to do in context of research, communication and education (François-Bongarçon 2008, 2015; Pitard, Esbensen and Paoletti 2015).
Nugget effect and TOS
The nugget effect is the random component of variability that is superimposed on the regionalised variable, and is defined in a variogram as the percentage ratio of nugget variance to total variance. The magnitude of the nugget effect relates to: in situ heterogeneity of the mineralisation; sample support; sample density; and sample and assay procedures (Carrasco 2009; François-Bongarçon 2004; Pitard 2007).
The nugget effect has two principal components (Carrasco 2009; Dominy 2014a; François-Bongarçon 2004; Pitard 2007; Platten and Dominy 2003): the geological nugget effect (GNE) and the sampling nugget effect (SNE). Some deposits naturally have an inherently high GNE, which can be inflated through poor quality sampling.
A major cause of SNE is the heterogeneity of broken rock (e.g. a rock pile, crushed rock or pulp), which to some extent reflects the primary in situ heterogeneity. In this context, heterogeneity is defined as the nature of the lot, in which all the contained fragments are non-identical. In this case, two types of heterogeneity are defined: the constitution heterogeneity (CH), and the distribution heterogeneity (DH). Constitution heterogeneity and DH contribute to the SNE, through the FSE and grouping and segregation (GSE) errors.
Throughout the mine value chain, optimised sampling protocols aim to reduce the total sampling variance thereby also reducing the total nugget variance; skewness of the data distribution; and number of extreme data values.
Correct sampling errors
Correct sampling errors are considered ‘correct’ because they cannot be removed by correct sampling (Table 1; FSE and GSE). They relate to the inherent heterogeneity of the material being sampled and control sample precision (Pitard 1993).
Precision specifically relates to the CH of the material in question and leads to the FSE. Poor precision in samples generates ore/waste misclassification. The FSE can be estimated via the FSE equation (François-Bongarçon and Gy 2002; Gy 1982). Out of all sampling errors, the FSE does not cancel out and remains even after a sampling operation is perfect. It is controlled via the optimisation of sample mass and size reduction process (Petersen, Dahl and Esbensen 2004).
The DH and related GSE also contribute to sample precision. Distribution heterogeneity represents the difference in average composition of the lot from one place to the next in the lot; it is responsible for the irregular distribution of grade and values in groups of fragments of broken ore. The DH can be influenced by large differences in density and fragment composition. Distribution heterogeneity of a given lot is governed by CH, the spatial distribution of fragments and the lot shape, thus leads to GSE. From a practical perspective, GSE cannot be measured, but may have a material effect on the total sample error (François-Bongarçon 2014; Pitard and François-Bongarçon 2011). It is controlled by accumulating many small increments to form a composite sample. Segregation can theoretically be reduced by homogenisation, though in the presence of liberated gold particles is a futile exercise that promotes further segregation. The treatment of coarse-gold-bearing samples is a special case (Dominy 2014a; Dominy and Petersen 2005; Royle 1989).
Incorrect sampling errors
The incorrect sampling errors (ISE) (Table 1; DE to PE) arise as a consequence of the physical interaction between the material being sampled and the technology employed to extract the sample. They result in bias, which can be reduced by the correct application of sampling methods, equipment and procedures (Esbensen and Paasch-Mortensen 2010; Gy 1982; Holmes 2015; Petersen et al. 2004; Pitard 1993, 2009).
The AE is generally not considered as an ISE, though remains a potential bias generator. It can be minimised through proper QAQC in the laboratory across staff activity, and analytical equipment maintenance and calibration. It may also be affected by rock matrix effects.
Defining a representative sample
A sample can be described as being representative when it results in acceptable levels of bias and precision. The total variance for resource and grade control sampling should not be more than ± 32%, with the total FSE component not more than ± 16% (Pitard 2013). The FSE is reported at a given confidence limit, usually 68% or one standard deviation. All sampling variances are cumulative and contribute to the total, which in turn contributes to the SNE. In reality, FSE and GSE are likely to contribute up to 90%, with DE, extraction error (EE) and AE up to 25% of the total (Pitard 1993).
FSE equation and application to gold ores
The FSE can be theoretically estimated before material is sampled, provided characteristics (e.g. sampling constant – K) embedded in the FSE equation are determined (Gy 1982; Pitard 1993). The equation addresses key questions of sampling broken rock:
what weight of sample should be taken from a larger mass, so that the FSE will not exceed a specified variance; what is the possible FSE when a sample of a given weight is obtained from a larger lot; and before a sample of given weight is drawn from a larger lot, what is the degree of crushing or grinding required to lower error to a specified FSE.
A technical issue with the use of the FSE equation is the numerical value of the power in the so-called liberation factor (François-Bongarçon 1998; Gy 2004). The problem was addressed by François-Bongarçon (1998), who suggested a modified FSE equation that includes the parameters α and liberation diameter (dλ) (François-Bongarçon 1998; François-Bongarçon and Gy 2002).
K can be experimentally determined using a sampling tree-based method, which also yields a value for α (François-Bongarçon and Gy 2002; Minnitt and Assibey-Bonsu 2010; Minnitt, Rice and Spangenbeg 2007). In addition, the heterogeneity test (HT) can also be used to determine K, though no value of α is defined (François-Bongarçon 1993; Pitard 1993; Magri 2007; Minnitt and Assibey-Bonsu 2010). The HT possesses representivity challenges when applied to coarse gold-bearing deposits (Dominy and Xie 2015).
As originally defined, dλ represents the mineral liberation size below which 95% of the material must be ground in order to liberate at least 85% of the gold (Gy 1982; Pitard 2004). For gold mineralisation, dλ can be redefined to dλm, representing the screen size that retains 5% of gold given a theoretical lot of liberated gold (Bazin, Hodouin and Blondin 2013; Dominy 2014a; François-Bongarçon and Gy 2002; Pitard 2015; Royle 1991). If coarse gold is dominant, then dλm can represent the coarse most influential population (Dominy et al. 2012; Pitard 2009). If gold particles cluster, then dλm should be redefined as dλclus (Dominy and Platten 2007; Pitard 20072009). The value of K is dependent on the microscopic properties of the minerals, and varies with gold grade and dλm or dλ.
A direct approach to the determination of gold particle size and dλm is suggested by some practitioners (Dominy et al. 2011; Dominy and Xie 2015; Pitard 2015). This may include a combination of mineral particle size determination via optical and/or electron/X-ray microscopy (Dominy et al. 2012; Lyman and Schouwstra 2011) and/or crush-screen-concentration (Dominy et al. 2011; Gonzales and Cossio 2007). Research has indicated that α can generally be taken as 1.5 (François-Bongarçon 1998; François-Bongarçon and Gy 2002).
Gold mineralisation and sampling
Nature of mineralisation
Gold mineralisation frequently displays evidence of two populations, representing fine- and coarse-gold (above 100μm) particles (Dominy, Xie and Platten 2008; Dominy and Platten 2007; Pitard 2009). These may be a part of separate paragenetic stages. In general, the fine-gold particles are likely to be relatively disseminated through the mineralisation and responsible for a ‘background’ grade of between 0.5 and 5g/t Au (Dominy et al. 2008); whereas, coarse particles are likely to be more dispersed and/or locally clustered, being critical to economic viability in low-grade deposits.
Mineralisation containing substantive quantities of coarse gold (>15% >100μm) is often typified by a high-nugget effect, which represents variations in: (1) the in situ size distribution of gold particles (including effects of gold particle clustering), and (2) gold particle abundance (Dominy 2014a). Grade is generally correlated to gold particle size, although the relationships are complex (Dominy and Platten 2007; Dominy et al. 2008). Higher grades often relate to abundant coarse-gold and/or clustered gold particles. The coarse-gold particle population will generally be challenging to sample compared to the fine-gold population (Dominy 2014a).
Peculiarities of gold sampling
There are a number of peculiarities of sampling for gold, which relate to both CSE and ISE. Those that drive FSE include:
primary gold particle distribution is often erratic (high GNE), with localised clustering effects (Dominy and Platten 2007; Platten and Dominy 2003) and grades are relatively low (gram per tonne Au), thus gold particles can be relatively rare ‘events’ (e.g. Poisson distribution) particularly in low-grade ores (Pitard and Lyman 2013).
The gold content of a sample and the gold content of the surrounding ore can be very different. Similarly, there may be large differences between the primary sample and subsequent sub-samples unless rigorous optimisation is undertaken.
Those issues that contribute to the GSE and ISE include:
poor disintegration of gold particles during pulverising often lead to smearing and/or the coating of sample preparation or testing equipment leading to PE (Dominy and Petersen 2005; Pitard 2009) high contrast between the densities of gold and gangue minerals promote segregation once liberated, which leads to GSE (François-Bongarçon 2015; Pitard 2009) and bias during diamond drilling relates to the plucking of gold particles from the core surface as a result of the drilling process (Dominy 2014a; Pitard 2009), which leads to a negative grade bias (EE). Core sawing can also lead to gold loss in the cuttings (PE).
These problems can be overcome through the use of larger sample and assay charges, and careful procedures to minimise sampling errors.
Case studies
Introduction
The following case studies documented between 2001 and 2007 show sampling issues that can be found in gold projects globally. Each case study is reported anonymously, and the sampling errors and relative impact on the project are discussed. It was concluded that for all presented case studies, the sampling issues were the most material. For those that were producing operations, the resource/reserve estimation process was considered appropriate.
Case study 1: Core quality issues
A shear-zone style deposit located in the Former Soviet Union was at an advanced stage of evaluation as a joint open pit and underground operation. A feasibility study had been completed.
The deposit was characterised by steeply dipping gold-quartz-sulphide veins up to 0.3m in width, forming a larger 15–30m wide stockwork zone. The global reserve grade was 5.7gt− 1 Au. There was minimal coarse gold present, though the deposit was nuggety due to the pod-like nature of the sulphide mineralisation within the veins. The resource had been diamond drilled on a relatively fine grid and had some underground development in it. An estimate by the owner defined Measured, Indicated and Inferred Mineral Resources in accordance with the 2004 JORC Code.
During an independent review, it was found that there was poor documentation with regard to QAQC and that the (total) core recovery was generally between 44 and 71% with a mean of 61%. The owner had drilled a number of confirmatory diamond holes, whose recovery improved, but were still relatively low between 65 and 83%.
The low recoveries indicated that there was a large amount of core (sample) loss, and that the actual sample collection process was prone to a high EE. Further investigation showed that core loss was principally related to the sheared and altered nature of much of the mineralisation and to some extent drilling quality. The remaining half core was highly fragmented and friable, testifying to the difficulty in cutting the original sample. Where such a core problem exists, it is strongly recommended that after detailed logging and photography, the entire core composite be crushed and then split for laboratory submission (Annels and Dominy 2003). A mineralogical and assay investigation should be undertaken to ascertain the impact of the core loss on the mineralisation.
These issues were of obvious concern and as a result, the Measured blocks were reallocated to the Indicated and Inferred categories, and Indicated Resources to the Inferred category. Some previously Inferred blocks became unclassified. As a result of the resource downgrade, the company was unable to raise the finance required for project development. They had to fund additional diamond drilling to confirm their expectations of the deposit, revise the feasibility study, and undertake an investor relation programme to avoid loss of confidence in the project.
Proper consideration of core quality early on would have saved the operator both money and reputation. The additional drilling used a triple tube core barrel and driller with improved expertise in poor ground. In zones of poor core recovery, the entire sample was crushed, split in half and one-half submitted to the laboratory.
Case study 2: Incorrect compositing
The deposit was located in North America, where a new vein system had been located between two former underground operations. A steeply-dipping 3m to 5m wide vein had been defined using diamond drilling on a 20m by 20m grid. All drill cores were logged and 1m half-core lengths submitted for 1-kg SFA. Coarse, often visible gold was known from the previously mined veins and was confirmed in the new vein by core logging and SFA.
A resource estimate yielded a global grade of 6.5gt− 1 Au, which was lower than the expected 10–15gt− 1 Au required to support a small underground mine. The project was put on hold.
A later review found that in the drive to collect 1m core samples, any core samples on the footwall of the vein that were < 0.5m were bagged and not sent for assay. Geological studies revealed that the footwall of the structure contained a discrete high-grade vein bearing visible gold. This entire mineralisation stage had been virtually excluded from the estimate with a loss of 50–60% of the gold inventory.
The remaining footwall (half) core was collected, assayed by SFA and the resource re-estimated. The new global grade was 12.9gt− 1 Au, much closer to expectation.
This example shows the clear need for proper training of staff and communication between all parties. The project geologists were focused with fixed core lengths, with no consideration that a geologically based sample regime was more appropriate. In essence, this was an EE, where the mineralised zone was not sampled fully. From a project perspective, this error led a good project to be put on hold for 9months. The project subsequently went into production, yielding a ROM grade of 14gt− 1 Au over 4.5years.
Case study 3: What coarse gold?
A pseudo-coarse gold problem may be present in some gold deposits, due to the presence of gold particle clusters that give the effect of individual coarse-gold particles (Dominy and Platten 2007). These clusters, which may be distributed on the centimetre-scale or greater, give rise to high assay variability in field samples. However, once a sub-sample is pulverised, the effect of the clusters is removed if the individual gold particles making up the clusters are liberated. Thus, any resulting pulp will tend to have lower variability, unless ‘true’ coarse-gold particles exist.
An Australian greenstone-hosted vein deposit was found to have a coarse-gold problem. The vein had a mean width of 2.5m and a global reserve grade of 11gt− 1 Au. High variability was found for the first 12months of reconciliation, where the annual ROM grade was 7.5gt− 1 Au.
Checks of diamond half (NQ) core and laboratory pulp duplicates indicated a very high variability, where 90% of the data were ± 60% (half absolute relative difference: HARD) or worse. The issue had been ignored, as there was apparently no indication of visible gold within drill core. Assays were based on a 30-g sub-sample for fire assay (FA) scooped from the pulveriser bowl.
An initial review of metallurgical data indicated that a gravity recoverable gold (GRG) yield of 55% was achievable, suggesting that coarse gold was present. A number of samples were taken from low- to high-grade intersections, where mineralogical studies revealed the presence of gold particles up to 1mm in size, with many in the 150–500μm range.
A series of 50 half-core samples were taken for whole-sample SFA and it was found that between 15 and 75% of the gold in the samples reported to the screen (mean 40%). A comparison was made between the new SFA grades and the original 30g FA, and it was found that the SFA were generally higher than the original FA by about 20%.
Drill holes were re-logged and it was found that visible gold was common. In addition, it was found that clusters of visible gold particles extended over 2cm. This clustering resulted in increased heterogeneity within both half and crushed core.
In this case, there was adequate QA, but no QC follow-up since the pulp duplicate data were ignored. An inappropriate sampling protocol in a clustered-coarse-gold environment resulted in a high FSE. Furthermore, the pulps were prone to a high GSE, as not all the coarse gold was reduced in size during pulverisation. Scooping from the bowl was in effect grab sampling with an inherent high DE and EE. Given the presence of coarse gold, there was also the potential for contamination (PE) and the need for cleaning the pulveriser bowl with a barren flush between samples.
Timely identification of visible gold in core should have been achieved and acted upon. The original sample protocol was replaced by a half-core LeachWELL and effective QC follow-up. Reconciliation improved over the following 6months, with grade and tonnes within ± 11% of expectation.
Case study 4: Gold segregation in pulps
An underground vein operation in North America was known to contain coarse-gold particles up to 1.2mm in size, and rarely up to 4mm. The plant recovered between 40 and 60% of gold via a gravity circuit. The vein had an average width of 2.5m and a global reserve grade of 17.8gt− 1 Au. Monthly reconciliations were up to ± 50% on grade and up to ± 15% on tonnes.
From drill core and underground chip samples, a 2-kg sample was pulverised and a 30-g FA undertaken. There was no formal sampling protocol or laboratory QAQC system. With new owners, systems were introduced into the pre-existing laboratory. It was identified that the pulp duplicates displayed a very poor precision; where 90% of the data were ± 55% HARD. In addition, the pulverisers were not cleaned between samples and there was evidence of gold contamination between some samples.
A number of exhaustive tests were undertaken on 2kg pulp lots, where the pile was mixed, flattened and 40 consecutive 50g sub-samples taken for FA. The variability was very high, and in one instance, the range between the minimum and maximum values was 250gt− 1 Au.
These findings confirmed that the pulps were heterogeneous due to the poor comminution of gold particles during pulverisation and the excessive GSE within the pulps. Different pulp sub-sampling techniques further augmented the level of GSE. One laboratory technician homogenised the pulp by ‘mat rolling’ then simply scooped off 30g from the top of the pile, thereby missing gold that had segregated to the bottom of the pile. Another technician placed the pulp on the mat, shook it rigorously, flattened the pile and cut a series of sample lines through the pile with a greater chance of picking up segregated gold at the pile base.
An additional issue of sample contamination was identified. Where very high-grade samples (>30gt− 1 Au) usually bearing visible gold were present, the following sample or two samples were often contaminated. Tests were undertaken, where it was found up to 10% of the high grade was smeared into the following samples. At the time, no barren flushes were undertaken in the laboratory and equipment hygiene was poor.
In essence, the ‘mat roll’ method understated, while the ‘shake, flatten and cut’ technique overstated the gold grade. The recent mine records were revisited and it was found that during a leave of absence by the ‘overstating’ technician, a number of stope blocks had been abandoned due to the low sample grades achieved. The stope-bounding drives and raises were subsequently re-sampled and assayed using the new protocol. They were found to be of ore grade and were subsequently mined out recovering 11000oz Au.
The key issue was that coarse gold needs to be treated differently. Pulps-bearing liberated gold cannot be homogenised; GSE can be highly problematic; and proper protocols and procedures must be set up both in the mine and laboratory. An SFA was introduced to account for coarse gold, along with improved laboratory procedures and staff training. Full QAQC protocols were introduced, particularly covering equipment cleaning and contamination monitoring. Barren flushes between samples were introduced and were assayed at a rate of 1 in 20. Where visible gold was observed or high grades expected, additional barren samples were introduced and subjected to FA.
Case study 5: Grab sampling for grade control
Grab sampling has been used as a grade control tool in many gold operations globally (Dominy 2010). A shear-zone hosted underground operation in Australia consistently had reconciliation problems. Mineralisation did bear some coarse gold, though this was not dominant. Most gold was sulphide-hosted and below 150μm in size. This was manifested as a general under-call with respect to the reserve grade (7.4gt− 1 Au) of around 25%. The decision to send material from the stockpile to the plant was based solely on grab sampling.
Each stock pile represented approximately 500t of supposed ore. Twenty 3kg samples were taken from around the edge of the stockpile, at a fragment size of generally < 12cm. Each sample was sent to the laboratory for a 500g LeachWELL-based pulverise-and-leach (PAL) assay.
A test study was undertaken based on 200 3-kg grab samples collected from a chosen stockpile. For the total population, the mean grade was 12.8gt− 1 Au, the minimum grade 0.01gt− 1 Au and the maximum grade 79.7gt− 1 Au. There are a number of grade permutations possible if an exhaustive 20 set sample batches are drawn. Out of 200 samples, the lowest grade combination of 20 samples was 0.1gt− 1 Au, and the highest grade combination 49.1gt− 1 Au. The mean was 10.6gt− 1 Au. The test stockpile was fed to the plant and autosampler after secondary crushing, where a batch mean head grade of 4.2gt− 1 Au determined. The mean of the first 20 samples taken was 8.2gt− 1 Au, which implies under normal circumstances that the lot would have been sent to the plant as ore. At the time, a mine cutoff grade of 4.6gt− 1 Au was applied.
The operation was battling reconciliation problems and achieving a lower head grade. The reserve model was based on diamond drill data on a 20–30m by 20–30m pattern. Face chip sample data were ignored, as it was considered to be biased and only represented around 50% of mine faces due to operational constraints. As a result, all material dumped on the surface stockpiles, which included mineralised waste, and marginal, medium and high-grade ore, was grab sampled prior to being sent to the waste tip or plant. Given the biased nature of grab sampling, most of the mineralised waste and marginal ore were sent to the plant diluting the ore feed. Grab sampling was considered the key issue. The grade estimate was also considered to be suboptimal.
This study showed that the use of grab samples to assess grade is problematic. The majority of stockpiles were sent to the mill as ore. This was in part related to a higher proportion of gold in the fine ( < 1cm) fraction, thus biasing grab samples high. An important point to note is that each grab sample or group of 20 grab samples did not represent the stockpile. Grab sampling is prone to chronic FSE, GSE, DE and EE (Dominy 2010; Pitard 2009). Fundamental sampling error calculations indicated that a 25-t sample was required from the stockpile to achieve an acceptable level of FSE.
Grade control subsequently re-focused to use the diamond drilling, which was closed to a 15m by 15m spacing. LeachWELL (1–2kg) was used for all samples and grab sampling was stopped. The resource model was also improved via the use of an optimised kriged block model. A managed low-grade stockpile was introduced. Reconciliation improved to ± 12% for grade and tonnes in 6 months.
Case study 6: Reverse circulation and blast hole sampling
In many open pit gold projects, blast hole (BH) drilling has been used as the principal grade control sampling method. More recently, BH has been replaced with reverse circulation (RC) drilling in an attempt to improve sample quality and grade control outputs (Pitard 2008; Chieregati, El Hajj, Imoto and Pignatari 2015).
This case study is based on an African open pit gold operation, working for a large tonnage low-grade (1.9gt− 1 Au) greenstone-hosted shear-zone type deposit. Gold was principally distributed in quartz veins, though some local wallrock disseminations were observed. The gold was quartz and/or pyrite hosted, with minimal visible gold. About 20% of the gold was gravity recoverable and mineralogical studies identified a maximum gold particle size of around 350μm.
During the first few years of operation, all grade control was undertaken as part of the BH drilling pattern, and samples were taken from the cuttings. Such a methodology is known to be problematic with issues relating to DE, EE and GSE, namely, hole-wall caving, sample loss into cavities, contamination and particle segregation within the drill hole. Delimitation error also existed where the hole was drilled below the current bench – the so-called ‘sub-drill’. In addition, the collection of sample material from the surface ‘cone’ was fraught with problems relating to high FSE, pile segregation (GSE) and sample delimitation and extraction (DE and EE).
In this case, BH samples were collected with a sectorial or pie tray (approx. 10kg from 200kg, representing 2.5m), providing an acceptable DE in some cases, though the EE can be high due to overfilling resulting in sample loss. However, half of the 10kg sample (e.g. 5kg) was poured (no splitter used) into a bag for laboratory submission. After crushing to P80 −2mm, a 1kg sub-sample was taken and pulverised to P90 −75μm and a 200g sub-sample riffle split and a 30g FA undertaken. This protocol yielded an FSE of ± 92%.
Subsequently, RC drilling with a face hammer bit was introduced for grade control. Reverse circulation has many improvements over BH drilling through the air propelled recovery of the drill chippings up the centre of the drill rod, which leads to a reduction in contamination and improved mass recoveries. It also provides improvements in grade and geological resolution (a closer spacing than BH and capability for angled holes to reflect the mineralisation trend) and reduced overall sampling error (reduced FSE, EE, DE and GSE). The key issue with taking a sub-sample from a 200kg lot of chippings is that the FSE can only be lowered by either reducing the entire nominal fragment size of the entire lot or by taking a bigger sample. The RC drilling produced a finer product and the run length was reduced to 0.7m to decrease the primary sample size. A 10kg RC sample was collected via a cone splitter at the rig. At the laboratory, this was crushed to P80 −1.5mm, 5kg riffle split for pulverisation, and 1kg taken for a LeachWELL assay. The overall FSE for this protocol was ± 29%, a clear improvement over the old BH protocol.
This was still not an optimal figure, but an overall improvement was achieved. At the time of introduction, it was possible to compare the drilling and assay results of both the BH and RC samples for a number of benches. It was found that the RC drilling protocol yielded a nugget effect of 44%, whereas the BH samples gave a value of 62%.
An improvement supporting the use of RC versus BH drilling for grade control was seen. However, a level of compromise had to be accepted, even with the sampling protocols for RC where a large field sample can be required to minimise the FSE.
Case study 7: Uncertainty in heterogeneity testing in coarse-gold ores
The HT is a common approach to determine the value of K for FSE equation use. The method consists of extracting a number of fragments at random from different size fractions of the lot. The number of individual fragments should generally be as large as possible, but for practical purposes is suggested to be around 50 (Gy 1982; François-Bongarçon 1993; Pitard 1993).
Table 2 shows variability in HT results from North American coarse-gold-bearing mineralisation. The mine operator aimed to optimise sampling protocols and undertook a HT on ore fragments from a stockpile. The initial test (Test #01 in Table 2) yielded a relatively low K value. Sampling protocols were optimised for this figure.
Fifty, 100 and 200 piece experiments for a coarse-gold ore deposit in North America. All fragments were approximately 1.5kg (equivalent particle size diameter 16cm) and where pulverised in their entirety and subsequently screen fire assayed
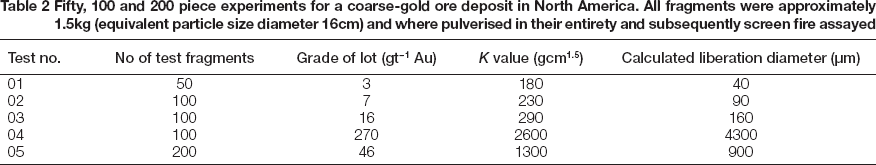
A later review noted that the K value was below expectation given that the mine recovered some 65% of its gold via gravity and that visible gold was common in both drill core and underground exposure. Three additional tests were undertaken, this time with 100 fragments in each test lot (Tests #02-04; Table 2). The K values defined displayed strong variability ranging from 230 to 2600gcm− 1.5. Test #04 yielded a particularly high value for both K and dλ, being related to two very high grades. A fifth test was undertaken using 200 fragments of 1kg weight.
A study was undertaken of gold particle size and distribution based upon mineralogical observation, inspection of gravity concentrates and metallurgical screening and assay tests. It concluded that for ROM grade ore of 15gt− 1 Au, the dλ value was 3mm.
The original sample protocol was based on half HQ core sampling, pulverising of the entire sample, and sub-sampling 500g for a later sub-sample of 30g for FA. Duplicate pulp FA were rarely undertaken, but those undertaken showed high variability (90% within ± 70% HARD). Test work also identified coarse-gold contamination between samples preceded by high-grade material. Two barren flushes were introduced after any sample-bearing visible gold or expected to be high grade. Protocols were adjusted to take into account the coarse nature of mineralisation through the total SFA of all half core or face samples.
In many cases where coarse-gold particles are relatively sparsely distributed, the picking of 100 test fragments is likely to only represent low-grade fine-gold background population (Dominy 2014a). This example shows that the calibration of the FSE equation using HT can be problematic in the coarse-gold environment (Dominy and Xie 2015). It is generally found that a direct approach to dλ determination is more appropriate (Dominy et al. 2011; Pitard 2015).
Case study 8: Case of QA with no QC
In this example, a greenstone-hosted disseminated gold deposit in Central Africa had been drilled out by three NQ diamond drill campaigns. Spatially, the three sets of drilling broadly covered the same mineralised zones. The gold is fine-grained, hosted in pyrite and/or arsenopyrite and generally below 50μm in size. The largest campaign contained 60% of the assay database that was used for resource estimation.
During an independent review of the resource, it was found that the key drill programme had problematic QAQC data. In particular, the results for the CRMs, inserted at a rate of about 1 in 30, were consistently high. The results of inter-laboratory check pulp samples, submitted at a rate of 1 in 50 were overall biased low.
The sample collection and preparation protocols were found to be acceptable. Despite the high bias indications of the CRM data, the implications were ignored in the resource estimate. Detailed review showed that the entire batch of assays was about 36% higher with respect to grade. This error was shown to relate to the laboratory, where poor maintenance and calibration of AAS equipment led to high AE. This is an example of clear QA with no supporting QC.
The remaining half core was assayed using the same protocol at a different laboratory. CRMs were inserted at a rate of 1 in 20. The resource was re-estimated, which led to the deposit grade reducing from 1.8 to 1.5gt− 1 Au. This resulted in project suspension and withdrawal of funding.
Case study 9: Poor mill balance sampling
An underground operation in South America was extracting 100000t per annum at 15gt− 1 Au. Much of the gold was coarse (up to 2mm in size), with the processing plant based on a 13th− 1 gravity-only circuit to extract around 80–85% of the gold. On an annual basis, the operation was expected to produce around 40000oz Au. By the end of the first year of production, the operation had produced 31000oz Au. Based on the mill balance, a recovery of 94% was calculated from a head grade of 10.3gt− 1 Au and mean tailings grade of 0.6gt− 1 Au.
A review of all aspects of grade control and reconciliation was undertaken. It was found that the tailings grades were based on a single 1kg hand sample collected via a small bucket once per hour, and this was sometimes missed. Thus 13t of ore was represented by a 1kg tailings sample. A series of 250kg bulk samples of tails were collected and tested in a metallurgical laboratory. It was found that the grade of these averaged around 2.5gt− 1 Au and that gold particles up to 0.75mm were contained. An autosampler was fitted to the tails outflow, which was initially set to collect a 2.5kg sample every 5min. Over a period of 1month, this revealed grades averaging 3gt− 1 Au and on a shift basis up to 6.5gt− 1 Au. These high grades were linked back to the gravity circuit, which was not optimised and thus coarse gold was being lost.
The initial tailings sample yielded an FSE of ± 51%, together with increased DE and EE using a manual sampler. The revised test protocol dropped the FSE to ± 9% and importantly took multiple increments over an hour thus having a higher probability of collecting a coarse-gold particle(s). By collecting multiple samples, the periodic fluctuation error was also reduced (Pitard 1993). An autosampler was also introduced. In the original protocol, the small hourly samples did not resolve periodic pulses of gold lost to the tails stream, which represented higher feed grades to the gravity circuit. The incorrect tails sampling was understating the actual gold content by 6700oz, which was effectively unaccounted for in the mill balance and hence a high recovery was calculated.
The study led to a number of changes in the plant to improve recovery, including modifications to the grinding circuit to grind finer and improvements to the gravity circuit. The post-modification tailings sample protocol was reduced to 1kg sample per 20min, which given the removal of the coarse gold yielded an FSE of ± 7%. Six months after modifications, plant recovery had increased to 89%, based on a 13.5gt− 1 Au head grade.
Case study 10: Poor metallurgical sampling strategy
A South American project was being evaluated with the intent to re-commence underground operations. Mineralisation is dominated by quartz-sulphide reefs generally 1m in width hosted in granodiorite. Economic grades are related to ore shoots, which extended around 75m along strike and >300m down plunge. The central 25m core of the Main Reef ore shoot contains a high-grade zone at 15–30gt− 1 Au, compared to the 4–8gt− 1 Au in peripheral zones. Gold mineralisation contained coarse gold up to 2.5mm in size, particularly in the core zone. Finer gold ( < 0.15mm) was common in the peripheral zones.
Historical mining had previously used simple gravity and amalgamation methods to extract gold, yielding recovered head grades in the 15–25gt− 1 Au range. As part of the evaluation programme, HQ diamond core drilling was undertaken. Core recovery and quality was good.
During re-evaluation, two 100kg diamond half-core composites (H#1 and H#2) were taken for metallurgical recovery testing based on the standard GRG test. The two samples were crushed to P80 −3mm and 25kg split off for GRG testing. Composite head grades were 36 and 47gt− 1 Au for H#1 and H#2 respectively, yielding GRG values of 90 and 96%. A single 100kg half-core composite was taken from the low-grade peripheral zone (L#1), the sample was crushed to P80 −3mm and 25kg split off for GRG testing. This yielded a head grade of 16gt− 1 Au and a GRG value of 81%.
Based on these results, a 75000t per annum gravity plant was built, with a recovery expectation of 70%. The expected head grades of 15gt− 1 Au were not being achieved, yielding around 5gt− 1 Au and a gold recovery of 30–40%.
A number of issues related to geological interpretation and metallurgical sampling were identified. The original metallurgical samples H#1 and H#2 were from very high-grade core mineralisation, and were not representative of that domain. Only two samples were collected. Sample L#1 was unrepresentative of the low-grade zone, and was biased by one intersection of relatively high-grade material that was present in the low-grade zone. Only one sample was collected.
During sample preparation, the crushing and splitting of the 100kg samples down to 25kg test masses yields a high FSE (up to ± 38% at 90% confidence), where less than ± 15% would be preferable. In addition, the splitting process after crushing was based on shovelling 25kg directly into buckets from a pile. The splitting of metallurgical test sub-samples from a primary composite is a key issue, where the split process is not representative (Dominy 2014b). This is further compounded when the primary sample is not representative either. In this case, the sub-sampling process was non-equiprobable with high risk of DE, EE and GSE.
Geological interpretation of the high-grade zone focused on a ‘continuous’ zone down the centre of the shoot (considered to be 35% of the shoot). This was not the case, where in reality there was a high-grade core but it comprised a series of en-echelon sub-shoots, which only accounted for about 15% of the shoot. The high-grade zone contains a high-level of GRG, whereas the low-grade zones contain substantially less. This lead to a reserve grade bias (15 versus 5gt− 1 Au) and over-reliance on GRG gold for plant design.
Subsequent metallurgical testing of the low-grade shoot indicated that an achievable GRG was in the range of 20–25% with most of the gold (>70–80%) being sub-100μm, sulphide-hosted and requiring 24h leaching to achieve a 75–85% recovery.
A further metallurgical testing programme for the low-grade domain was instigated (25 75–100kg samples), which ultimately led to the commissioning of a CIL plant at the mine. After further controls on mining were applied and the operation of the new CIL circuit, head grades were increased to 13gt− 1 Au, with recoveries between 90 and 95%.
Discussion
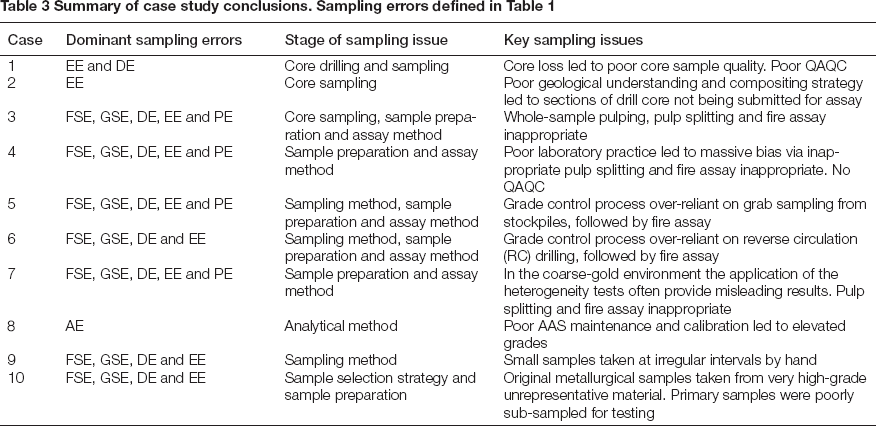
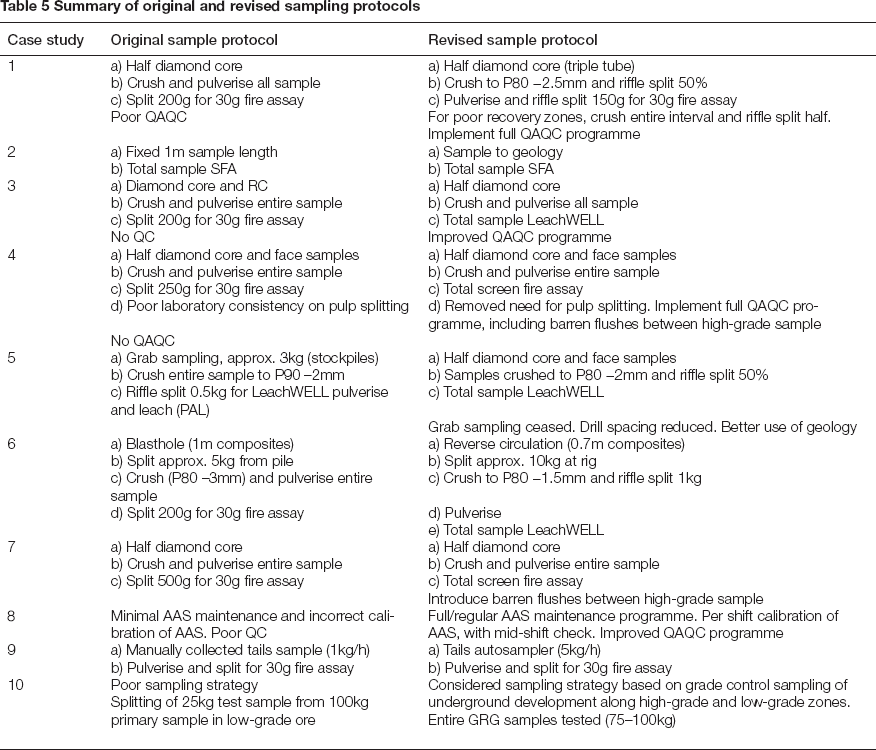
The sampling issues reported in the case studies relate to the full range of TOS errors (Table 3), that resulted in monetary and intangible losses (Table 4). These errors were reduced through the implementation of new protocols, often supported by new or additional ore characterisation (Table 5).
Summary of case study conclusions. Sampling errors defined in Table 1
Estimated monetary and intangible loss estimates for case studies. Monetary loss includes estimate of correction cost. For operations, includes loss in revenue from poor reconcilation (i.e. gold loss from actual versus planned). Monetary loss is on an annual basis for operations and over the delay period for development projects. For development projects includes sustaining cost over delay period
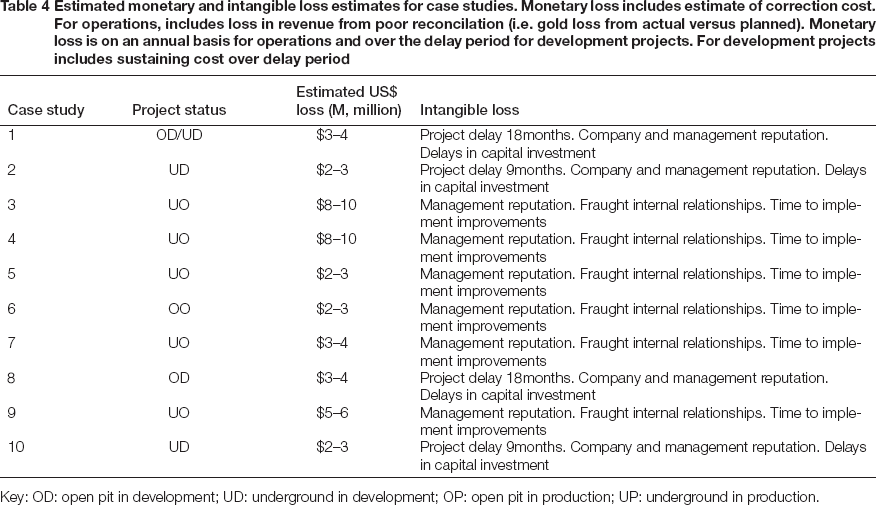
Key: OD: open pit in development; UD: underground in development; OP: open pit in production; UP: underground in production.
Summary of original and revised sampling protocols
Quality assurance/quality control issues in Case 1 relate to poor QA and lack of QC implementation. Accepted QAQC procedures are well-documented and require appropriate training and implementation (Abzalov 2008; DS3077 2013; Sketchley 1998; Vallée 1998). Full and timely analysis of QA data is required and must lead to investigation if required.
Inappropriate sample type is exemplified in Cases 5 and 6, where grab samples are used for underground grade control and BHs for open pit grade control. Both methods have well-documented issues, and their use is discredited in many circumstances. Alternatives for underground grade control include better use of geology and geological mapping, and closer-spaced diamond drilling. For open pit grade control, the application of RC drilling is recommended. Reverse circulation drilling has also been applied in the underground environment with some success (Clark and Carswell 2014).
Inappropriate coarse-gold sampling protocols for resource estimation and grade control led to problems in Cases 4 and 7. Protocols may involve pulverisation of an entire sample, which results in gold liberation. In such a case, sample splitting is problematic other than with a rotary sample splitter. Any homogenisation attempt will be useless and merely promote GSE. Mat mixing and scooping from a pile of pulp should be avoided at all costs. A large sample assay method, such as SFA or LeachWELL, is optimal. Good preparation equipment hygiene is required. Barren flushes of the pulverising equipment should be undertaken between each sample.
Poor core recovery (Case 1) typically reflects poor drilling and/or ground conditions (Annels and Dominy 2003). Where this is unavoidable, there will be a strong bias in assay grade due to mineral loss. From a sampling perspective, the best option is to either (a) assay the entire sample length or (b) to crush it and split off a proportion for laboratory submission.
Poor laboratory practice in Cases 3 and 8 led to bias. One case study (3) shows a common issue of handling pulps containing liberated gold. Scooping from the pile in any fashion will be affected by the segregation of liberated gold particles. The incorrect calibration of analytical equipment is careless.
An inappropriate sampling strategy for the plant balance led to erroneous reconciliation in Case 9. The flawed protocol was poorly executed. Manual samplers cannot be considered as best practice. In addition, the protocol was not optimised for the coarse-gold ore type.
Poor sampling strategy is shown in Cases 2 and 10, where grade distribution and/or geology were ignored. Effective understanding of the ore zone and likely geometallurgical domains are critical to designing grade and metallurgical sampling programmes.
Conclusions
Sampling errors across the entire mine value chain generate both monetary and intangible losses. At the project development stage, these losses can relate to biased resource/reserve estimates, potential project delay and/or wasted/misused capital. During mine operation, issues principally relate to ore/waste misclassification and poor reconciliation. In all cases, there are monetary costs in correcting protocols. Intangible costs relate to people and company reputation, poor relationships between technical disciplines, and wasted time enforcing poor protocols and implementing new ones.
In many cases, project teams are more interested in the effects of poor sampling than dealing with the cause. For example, during poor reconciliation, disciplines often spend more time trying to apply correction factors and/or apportioning blame. Management and practitioners often consider sampling to be of minimal importance, which reflects a lack of knowledge and understanding of its proper application across the mine value chain.
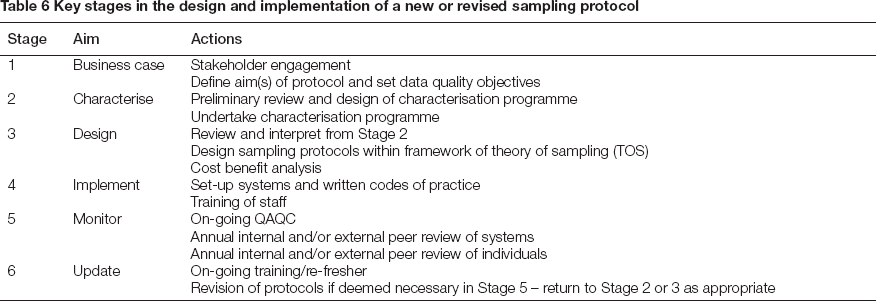
Design of an optimised sampling protocol must consider its aim and objective (s) in context of ore type and position in the mine value chain. In most cases, a dedicated ore characterisation programme will be required to support application of TOS and final protocol design. An approach to protocol design is presented in Table 6.
The optimisation process should consider:
geological/mineralogical nature of ore type(s) and likely geometallurgical domains and relationship to grade. Characterisation with respect to gold particle sizing, mineralogy and heterogeneity is critical whole core sampling followed by full sample assay via SFA or LeachWELL effectively yields FSE and GSE values of zero. With good laboratory practice, the PE and AE can be minimised. Arguments against whole core sampling revolve around no reference core remaining, though this author contends that with modern digital photography and detailed logging, this should not be an issue alternatively, RC drilling may be considered given that it provides a larger field sample size than core, though there is a loss of geological information and extreme care must be taken during sample splitting and assaying application of TOS and FSE equation to optimise protocols avoiding gold liberation, except during pulverisation of the final assay charge sub-sample and test for possible contamination in coarse-gold ores using effective large assay charge techniques, such as SFA or LeachWELL, if coarse gold is present; or whole-sample processing via a laboratory-scale system ensuring that separate splitters, crushers and pulverisers are used where coarse gold is present and that equipment is effectively cleaned between samples and blanks are used in the plant, autosamplers taking multiple increments should be used supported by appropriate sample preparation and assay protocols carrying out systematic QAQC programmes to measure the reliability of each of the sampling, preparation and assaying steps, and then optimising the process and proper documentation, staff training and periodic review.
Throughout any sampling and assaying or test work programme, QAQC must be a primary feature. Metallurgical sampling and test work programmes frequently have minimal to zero QAQC. Protocols must be set up with judicious consideration to cover field collection and security, laboratory preparation and analysis/testing to minimise sampling errors.
The overall conclusion of this discourse is that correct sampling and assaying practices are critical to a profitable gold mining industry. Management, technical and field staff should be educated to ‘sample better’ throughout the mine value chain. A project or operation should appoint an appropriately trained TOS champion to drive best practice. Good resources now exist to service this need, both in the form of consultants and educators, and a new international sampling standard (DS3077 2013). It is now time for TOS to be integrated into international reporting codes (e.g. JORC Code 2012).
Key stages in the design and implementation of a new or revised sampling protocol
Acknowledgements
The author would like to acknowledge the companies who have consented to the presentation of the case studies under confidentiality agreements. The late Dr Allen Royle (University of Leeds, UK), Professor Yuling Xie (University of Science and Technology Beijing, PRC), Professor Richard Minnitt (University of Witwatersrand, RSA) and Professor Kim Esbensen (GEUS, Denmark) are thanked for helpful discussions. Mining Technology reviewers are acknowledged for their constructive comments on the manuscript.