
Abstract
Determination of the sampling constant is an important step when applying the Fundamental Sampling Error equation to optimise sampling protocols. The classic method for its determination is based on the heterogeneity test (HT). In coarse gold-dominated mineralisation, the HT sometimes provides an evaluation of the fine-gold background grade population heterogeneity, but understates that of the important high-grade coarse-gold component. This is because the total mass of fragments is too small to represent the full gold particle size distribution of the mineralisation. Despite this, single heterogeneity tests (SHT) are often undertaken on deposits where the presence of coarse gold is ignored, not realised or understated. Resultant sampling and assaying protocols are frequently of poor quality and do not match the mineralisation characteristics. For coarse gold-dominated mineralisation, an empirical approach for sampling constant determination is recommended via direct estimation of the liberation diameter.
Keywords
Introduction
The importance of high quality sampling during deposit evaluation and exploitation has been stressed by many authors (Pitard 1993; Carrasco, Carrasco and Jara 2004; Minnitt 2007). Samples should be collected and prepared within the framework of the Theory of Sampling (Gy 1979, 1992; Pitard 1993). For a sample to be representative, it must be unbiased and precise. The precision of sampling protocols relates to the fundamental sampling error (FSE), which can be estimated via the FSE equation (Gy 1979).
Broken rock sample protocol optimisation using the FSE equation requires determination of the sampling constant (K; Gy 1979). The most widely applied approach to determining K is the heterogeneity test (HT; Gy 1979). The standard 50 or 100 piece test is applied across various commodity types including gold (Gy 1979; Pitard 1993; Carrasco et al. 2005; Magri 2007). It is not unusual for a single heterogeneity tests (SHT) to be used to represent an entire deposit or domain, without consideration of ore characteristics or variability.
Mineralisation containing substantive quantities of coarse gold (>15% above 100 μm) is often typified by a high-nugget effect, which represents variations in: (1) the in situ size distribution of gold particles (including effects of gold particle clustering), and (2) gold particle abundance (Dominy 2014a). Grade is generally correlated to gold particle size, although the relationships are complex (Dominy and Platten 2007; Dominy, Xie and Platten 2008). Higher grades often relate to abundant coarse gold and/or clustered gold particles. The sampling of coarse gold mineralisation is generally challenging and discussed further in Dominy, Annels, Johansen and Cuffley (2000) and Dominy (2014a).
Gold mineralisation frequently displays evidence that fine- and coarse-gold particles may be part of separate paragenetic stages. In general, the fine gold particles are likely to be relatively disseminated through the orebody and responsible for a ‘background’ grade of between 0.5 g t− 1 Au and 5 g t− 1 Au (Dominy et al. 2008). The coarse particles are likely to be dispersed in nature and/or locally clustered, being critical to economic viability in low-grade deposits.
This paper reports on a unique investigation of HT variability in coarse gold-dominated mineralisation. A comparison is made between a number of repeat HTs across four deposits. It links sample representivity to gold particle distribution, and in particular, the critical effect of gold particle clustering. The study demonstrates that the use of the HT is inappropriate in coarse gold mineralisation.
Fundamental sampling error
In the context of broken rock, the FSE is the smallest residual error that can be achieved even after homogenisation of a sample lot is attempted. When FSE is not optimised for each sub-sampling stage, it often becomes a major component of the sampling nugget variance (Pitard 2007; Dominy 2014a). The FSE is dependent upon the constitution heterogeneity (CH), which relates to sample weight, mineral fragment size and shape, liberation stage of the gold, gold grade, and gold and gangue density. The FSE can be theoretically estimated before the material is sampled, provided the sampling characteristics (e.g. K) embedded in the FSE equation are determined (Gy 1979; Pitard 1993). The FSE equation presented by Gy (1979, 1992) is usually modelled as

 f = shape factor; g = granulometric factor; c = mineralogical factor; λ = liberation factor [where λ = (dl/dN)0.5]; dl = liberation diameter; dN = nominal material size; MS = sample mass and ML = lot mass. For a full derivation of equation (1), the reader is referred to Gy (1979, 1992) and Pitard (1993).
A technical issue with the use of the original FSE formula is the numerical value of the power in the liberation factor, λ [equation (1)] (François-Bongarçon 1998a, 1998b). Gy (1979) originally proposed a value of 0.5, though subsequently reported its limitations (Gy 2004). This value gives reasonable results for base metal ores (Pitard 2009); however, it generally results in unrealistic values when applied to low-grade ores such as gold. The problem was addressed by François-Bongarçon (1998a, 1998b) who suggested a general model, which replaces 0.5 with b, where b = (3α). Substituting this into the original equation (1), the following modified equation results

In the strictest sense, dl represents the mineral liberation size, below which 95% of the material must be ground in order to liberate at least 85% of the gold (Gy 1979; Pitard 2004). Coarse gold particles have the tendency to flatten and potentially aggregate during comminution, thus reducing the probability of sub-samples containing a representative number of gold particles (Royle 1989). Consequently, for gold mineralization, dl can be redefined to dlAu, representing the coarsest gold of most influential particles (Royle 1991; François-Bongarçon and Gy 2002; Pitard 2004, 2007; Bazin, Hodouin and Blondin 2013; Dominy 2014a; Pitard 2015). The dlAu is effectively the screen size that retains 5% of gold given a theoretical lot of liberated gold. If gold particle clustering is observed, the combined clustered-particle liberation diameter (dlclus) needs to be defined. Parameters, dλAu and dlclus, vary depending upon the comminution state of the lot (Pitard 2004, 2007).
For the case of gold, the sampling constant is given as
Some authors have questioned the applicability of the FSE equation (Geelhoed 2011), particularly applied to gold. However, the François-Bongarçon (1998a, 1998b) modified equation (2) has been successfully applied by many practitioners to optimise sampling campaigns. The use of the equation represents a model, i.e. an idealised expectation that may or may not be attained in practice. The results of QA/QC programmes will ultimately provide evidence for representivity through the application of duplicate field and laboratory samples.
Determination of the sampling constant
General methodologies
Three broad methods have been suggested for estimating values for K. These range from mineralogical deportment-based, duplicate sampling analysis (DSA) to HT. The HT is the topic of this paper and will be discussed in more detail.
The mineralogical deportment approach relates to the determination of mineral particle size via electron microanalysis (Lyman and Schouwstra 2011). The sampling constant is then determined using estimates of the composition distribution within individual size fractions. Direct determination of the liberation diameter and back-calculation of K can be achieved via crush-screen-concentration (Gonzales and Cossio 2007; Dominy, Platten and Xie 2010) and X-ray tomography (Dominy et al. 2012).
An approach first recommended by François-Bongarçon (1993) is the DSA or sampling tree experiment (Minnitt, Rice and Spangenberg 2007). This methodology allows the calculation of both K and α. It is a complex approach that splits an initial approximately 75 kg sample into six sub-lots of decreasing nominal top-size. Each sub-lot is binary split from 1 to 32 samples. The method has been criticised as it introduces excessive grouping and segregation error into the process that is difficult to eliminate (Minnitt et al. 2007; Minnitt, Francois-Bongarçon and Pitard 2011). This led Minnitt, François-Bongarçon and Pitard (2011) to suggest a segregation-free analysis (SFA) approach to overcome this issue. Minnitt (2014) compares the DSA and SFA approaches on a Witwatersrand ore-type, where the α values were relatively consistent, but the K values were an order of magnitude different resulting in inconsistent sample protocols.
Minnitt and Assibey-Bonsu (2010) undertook a comparison of the DSA and HT approaches across three ore-types. They conclude that the results were significantly different in each case. The K values from the DSA were up to an order of magnitude different from the HT. Duplicate sampling analysis back-calculated liberation diameters were within expectation, though the HT liberation diameters were extremely low. The comparisons did not include coarse gold ores or investigate test precision.
HT approach
HT sampling strategy
A detailed description of the HT method is given in Gy (1979) and Pitard (1993, 2004), with non-coarse gold case studies presented in Carrasco et al. (2005), Magri (2007) and Gonzales and Delgadillo (2011).
Two HT variants are applied to coarse (>5 cm) and fine ( < 5 cm) rock fragments. These in effect represent laboratory coarse rejects or RC drill chippings ( < 5 cm) and stockpile or mill belt loads (>5 cm). A consistent fragment mass is chosen for any test. The methods are robust when the ore type is hard and breaks into a range of fragment sizes. If the ore type is soft and breaks into very fine (<1 cm) material, then determination of heterogeneity can be difficult. In addition, if the critical ore component selectively breaks into very fine fragments then any HT may be biased to the non-critical component.
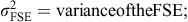
Fragment selection needs to account for mineralisation style. In the case of a wide mineralised body such as stockwork or sheeted vein systems, the fragments should be taken from the full ore zone to include ore and waste (Fig. 1b). In more discrete narrow structures (e.g. veins), the fragments should represent the vein zone, which in many cases will be dominated by quartz (Fig. 1a). Wall rock mineralisation should be characterised separately.
a single fragment for a 0.5 kg 50 piece single heterogeneity tests (SHT); and b 30 fragments for a 100 group grouped heterogeneity tests (GHT). c SHT fragments can be collected one-by-one from stockpiles or the composite crushed for the GHT method; and d consistently sized drill core lengths can be used for the drill core heterogeneity tests (DHT) approach or a composite crushed for the GHT
Prior to laboratory submission, it is appropriate to clean the fragments or groups of fragments to facilitate a visual review for mineralogy and the presence of visible gold.
For all HT approaches, the fragments or groups should be assayed fully to extinction to reduce sampling errors. Applicable methods include multiple fire assays, and whole-sample screen fire assay (0.5–2 kg) or LeachWELL (0.5–5 kg).
Coarse rock fragments: SHT approach
When coarse rock fragment lots, such as in a stockpile or mill feed, are to be tested (Fig. 1a and c), the total primary sample mass generally ranges from 25 to 250 kg depending upon the number of fragments selected and their individual mass. The single fragments are selected randomly, for example, from a series of surface stockpiles (Fig. 1c) or over a period of time from a mill feed belt. Gy (1979) and Pitard (1993) recommend that the collection of 50 individual fragments of 0.5 to 2.5 kg is picked one by one and each assayed to extinction (Fig. 1a). Practice has been to collect 100 individual fragments for more variable ore-types. In reality, hundreds of fragments may be required to achieve an acceptable level of precision for a given fragment size in coarse gold ores.
Fine rock fragments: grouped HT (GHT) approach
The approach for fine rock fragments (e.g. blast hole and RC chips or laboratory jaw crusher product) generally uses 50–100 groups of 30–50 of individual fragments to be picked one by one (Fig. 1b). Each group of fragments is then assayed to extinction.
The primary sample is generally a composite from different sources (e.g. RC rejects or crushed core) and ranges between 200 and 500 kg. This lot is crushed to 90% passing 2 cm. After crushing, the entire lot is either used for the test or between 40 and 60% split off for screening. The experimental procedure consists of screening out fragments generally between about 0.6 and 1.25 cm. This size fraction is spread on a table and individual fragments are collected randomly to give a sub-sample of around 40–100 g. In reality, hundreds of groups may be required to achieve an acceptable level of precision in coarse gold ores.
Drill core pieces: drill core HT approach
An alternate approach is to use drill core (Fig. 1d). Individual pieces of core can be used where a single piece is taken as equal to the diameter of the sphere having the same volume for that piece of core (François-Bongarçon 1993). Multiple pieces of comparable size core through an ore zone then constitute a drill core heterogeneity tests (DHT) of a given number of pieces. Between 50 and 100 core pieces of constant mass are taken and assayed to extinction. This approach has some advantage in that the data may already exist in the resource database and be present in a large quantity (e.g. >100 pieces).
Calculation of K from HT data
The methodology is based on the hypothesis that the grade (a) of a size fraction and the proportion MLa/ME1 (where MLa is the mass of the size fraction and ME1 is the mass of the lot) of this size fraction in the lot, varies minimally between the size fragments (Gy 1979; Pitard 1993). An approximation of CH is the heterogeneity invariant (HIL) of a lot, which is the product of the sampling constant (K) and the nominal fragment size dN. HIL is given as (Gy 1979; Pitard 1993)

A g value of 0.5 calculates HIL for the original fragment size, whereas if g is set to 0.25 this estimates HIL for the entire unclassified original lot. The value of K can be back-calculated from HIL by assuming α as default of 1.5

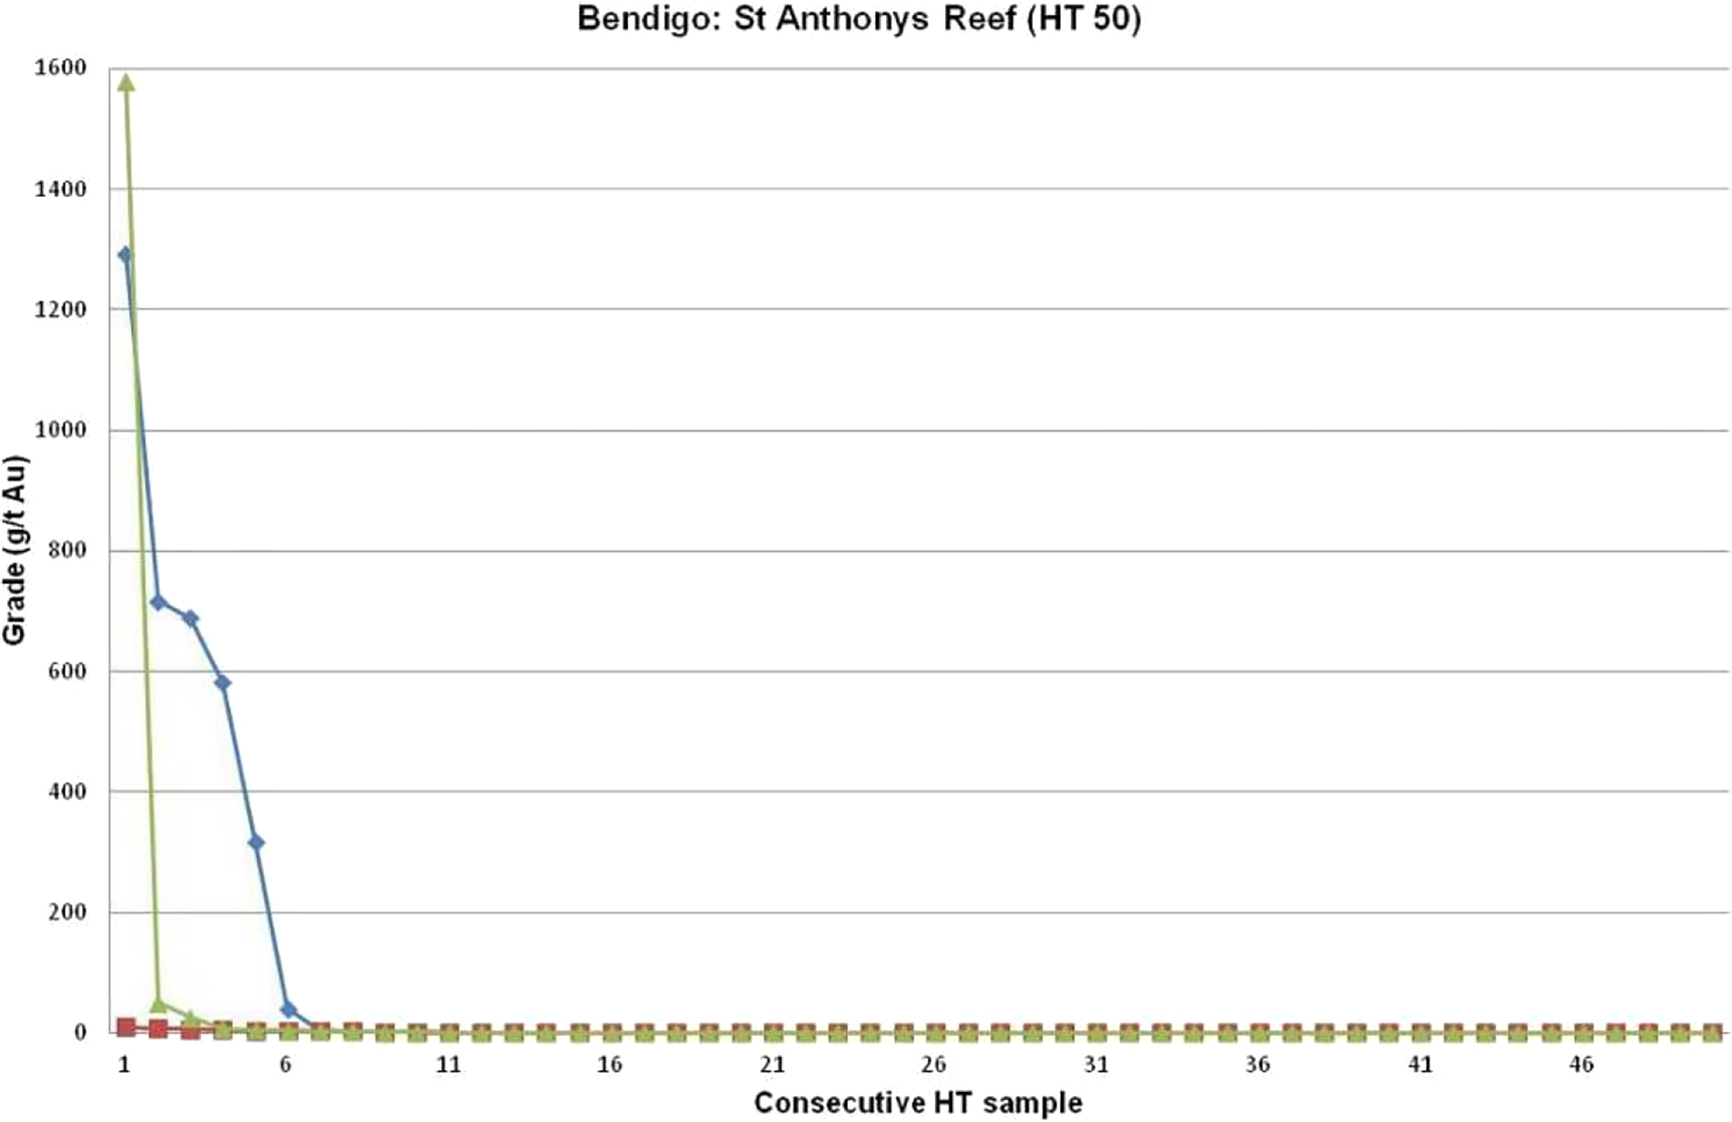
Three 50-piece 2.5 kg single heterogeneity tests (SHT) grade profiles for the Bendigo St Anthony's reef
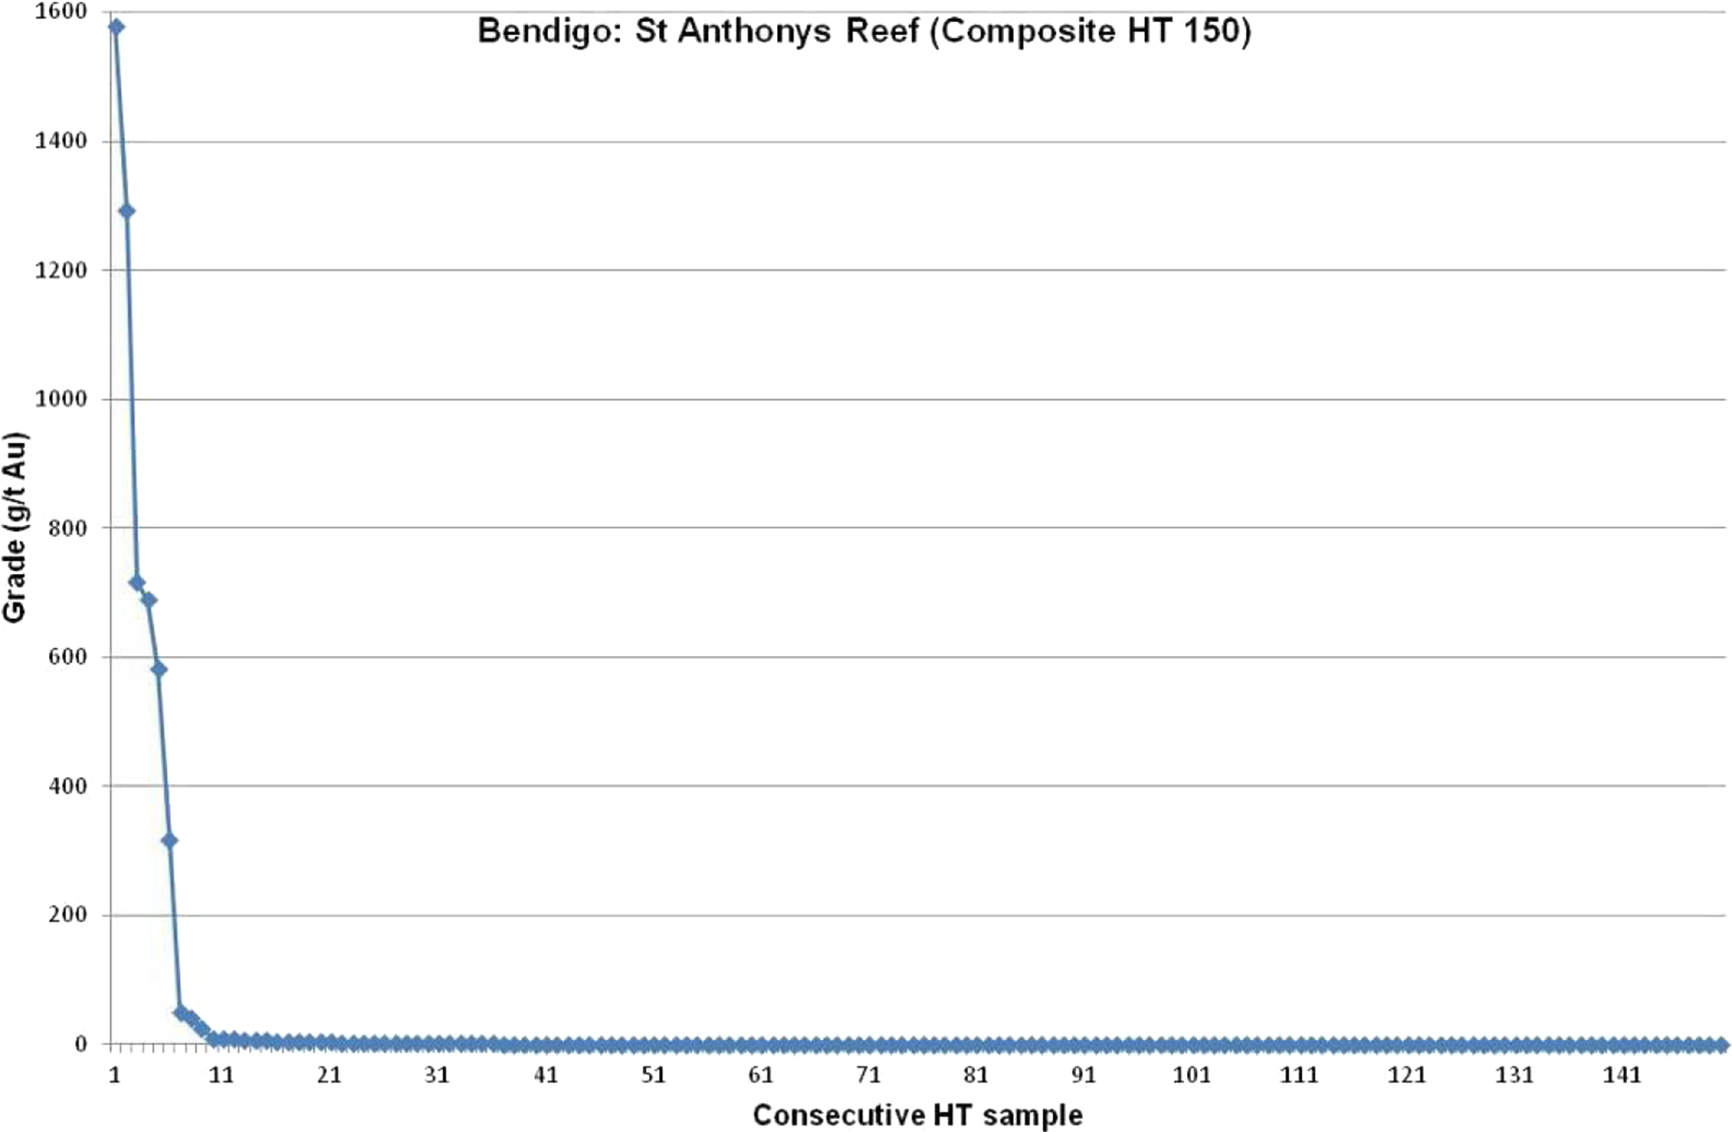
Composite 150-piece 2.5 kg single heterogeneity tests (SHT) grade profile for the Bendigo St Anthony's reef. Displays a typical HT curve where many (in this case 93%) show grades more consistent with the low-grade background mineralisation (see individual curves in Fig. 2)
Calculation of liberation diameter from HT data
The liberation diameter (dl) sensuo stricto is back-calculated from K using

Case studies
Introduction
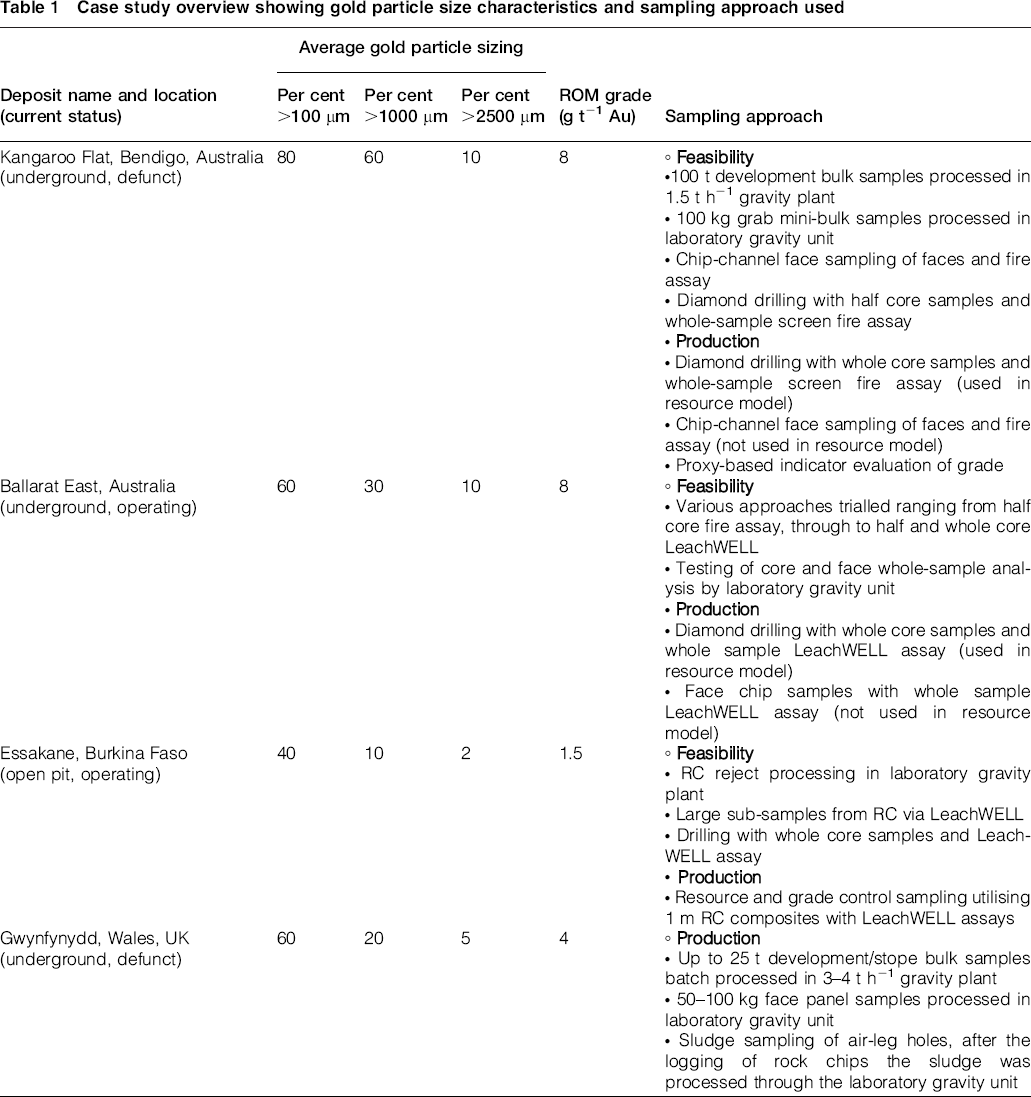
Four coarse-gold dominated deposits were evaluated using the HT approach. All deposits are characterised by >40% coarse gold (Table 1). A summary of the HT results is presented in Table 2. HIL values are calculated from the HT data via equation (4). K was calculated using equation (5) and dl back-calculated using equation (6).
Case study overview showing gold particle size characteristics and sampling approach used
Heterogeneity test results summary for case studies
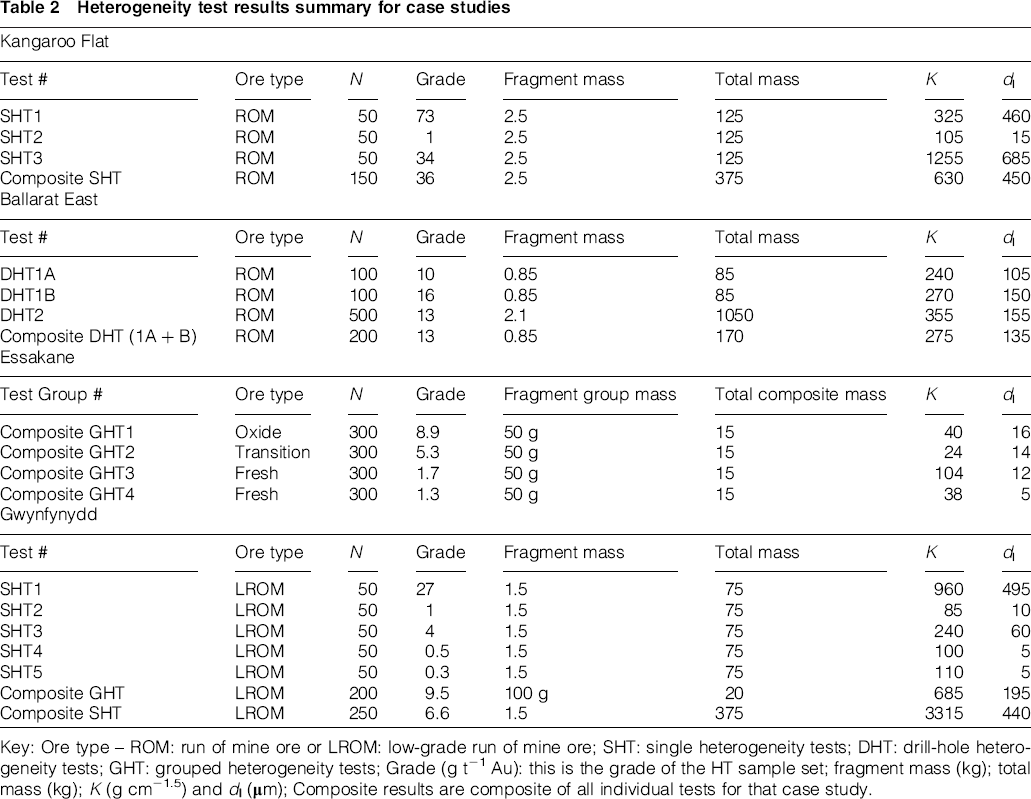
Key: Ore type – ROM: run of mine ore or LROM: low-grade run of mine ore; SHT: single heterogeneity tests; DHT: drill-hole heterogeneity tests; GHT: grouped heterogeneity tests; Grade (g t− 1 Au): this is the grade of the HT sample set; fragment mass (kg); total mass (kg); K (g cm− 1.5) and dl (μm); Composite results are composite of all individual tests for that case study.
Kangaroo Flat mine, Bendigo, Victoria, Australia
During the feasibility programme, the St Anthony's reef was bulk sampled (Dominy et al. 2000; Johansen and Dominy 2005). As part of this study, an initial SHT was collected from development ore, based on 50 2.5 kg pieces (Fig. 2; Table 2, Bendigo test #1 – Johansen and Dominy 2005). Two additional SHTs were selected from later development (Fig. 2; Table 2). Individual fragments collected were >70% quartz to reflect the nature of the reef. The three tests yielded K values of 105, 325 and 1255 g cm− 1.5. Back-calculated dl values ranged from 15 to 685 μm. The composite (SHT #1, 2 and 3) 150 piece SHT yielded a K value of 630 g cm− 1.5 and dl of 450 μm, which is a close representation of the known background gold population (Fig. 3; Johansen and Dominy 2005).
Bulk sample processing of St Anthony's reef indicated 5000 μm as being a more appropriate dlAu for run-of-mine ore (Johansen and Dominy 2005). A dlclus value of 10 000 μm was locally observed, comprising numerous particles for grades >10 g t− 1 Au. For the bulk sampling programme, the dlAu of 5000 μm was taken (Table 3). This was applied to bulk sample optimisation, where a 100 t primary lot was reduced to a 15 t sub-sample for processing (Johansen and Dominy 2005). This yielded an FSE of ± 10% at the 70% confidence level. If the original SHT results had been applied, a sample cut size of 0.2 t would have been taken. This sample mass would yield an FSE of ± 95% at the 70% confidence level. The precision of the 15 t sub-samples was 90% (half absolute relative difference) within ± 20%, indicating that the split was valid.
Comparison between heterogeneity tests (HT) and test work results
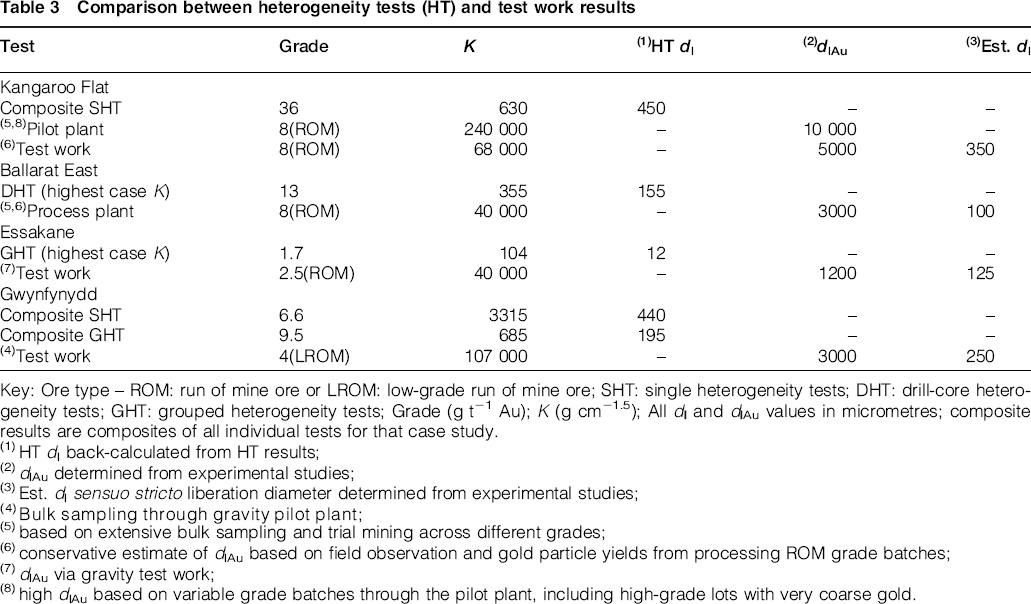
Key: Ore type – ROM: run of mine ore or LROM: low-grade run of mine ore; SHT: single heterogeneity tests; DHT: drill-core heterogeneity tests; GHT: grouped heterogeneity tests; Grade (g t− 1 Au); K (g cm− 1.5); All dl and dlAu values in micrometres; composite results are composites of all individual tests for that case study.
HT dl back-calculated from HT results;
dlAu determined from experimental studies;
Est. dlsensuo stricto liberation diameter determined from experimental studies;
based on extensive bulk sampling and trial mining across different grades;
conservative estimate of dlAu based on field observation and gold particle yields from processing ROM grade batches;
dlAu via gravity test work;
high dlAu based on variable grade batches through the pilot plant, including high-grade lots with very coarse gold.
Essakane open pit, Burkina Faso
Essakane is a sediment-hosted sheeted vein system. As part of an RC drilling programme undertaken during the feasibility study, a series of GHTs were undertaken to evaluate likely sampling protocols. RC rejects were chosen by domain and composited to yield a grade of around 2 g t− 1 Au. Composites of 350 kg were selected from spatially distributed primary samples that averaged around 2 g t− 1 Au.
Each GHT comprised approximately 100 (N) groups of 30 (p) particles, or nearest number of p to achieve a mass of 50 g (Fig. 1b). Particles were randomly picked from screened primary composites, providing a dN size of 1 cm. Three sets of GHT 100 tests were taken across four lithological-based ore types. The GHTs were collected from intersections across the sheeted vein mineralisation. Individual tests for each lithology showed some variability (Figs. 4 and 5; Table 2).
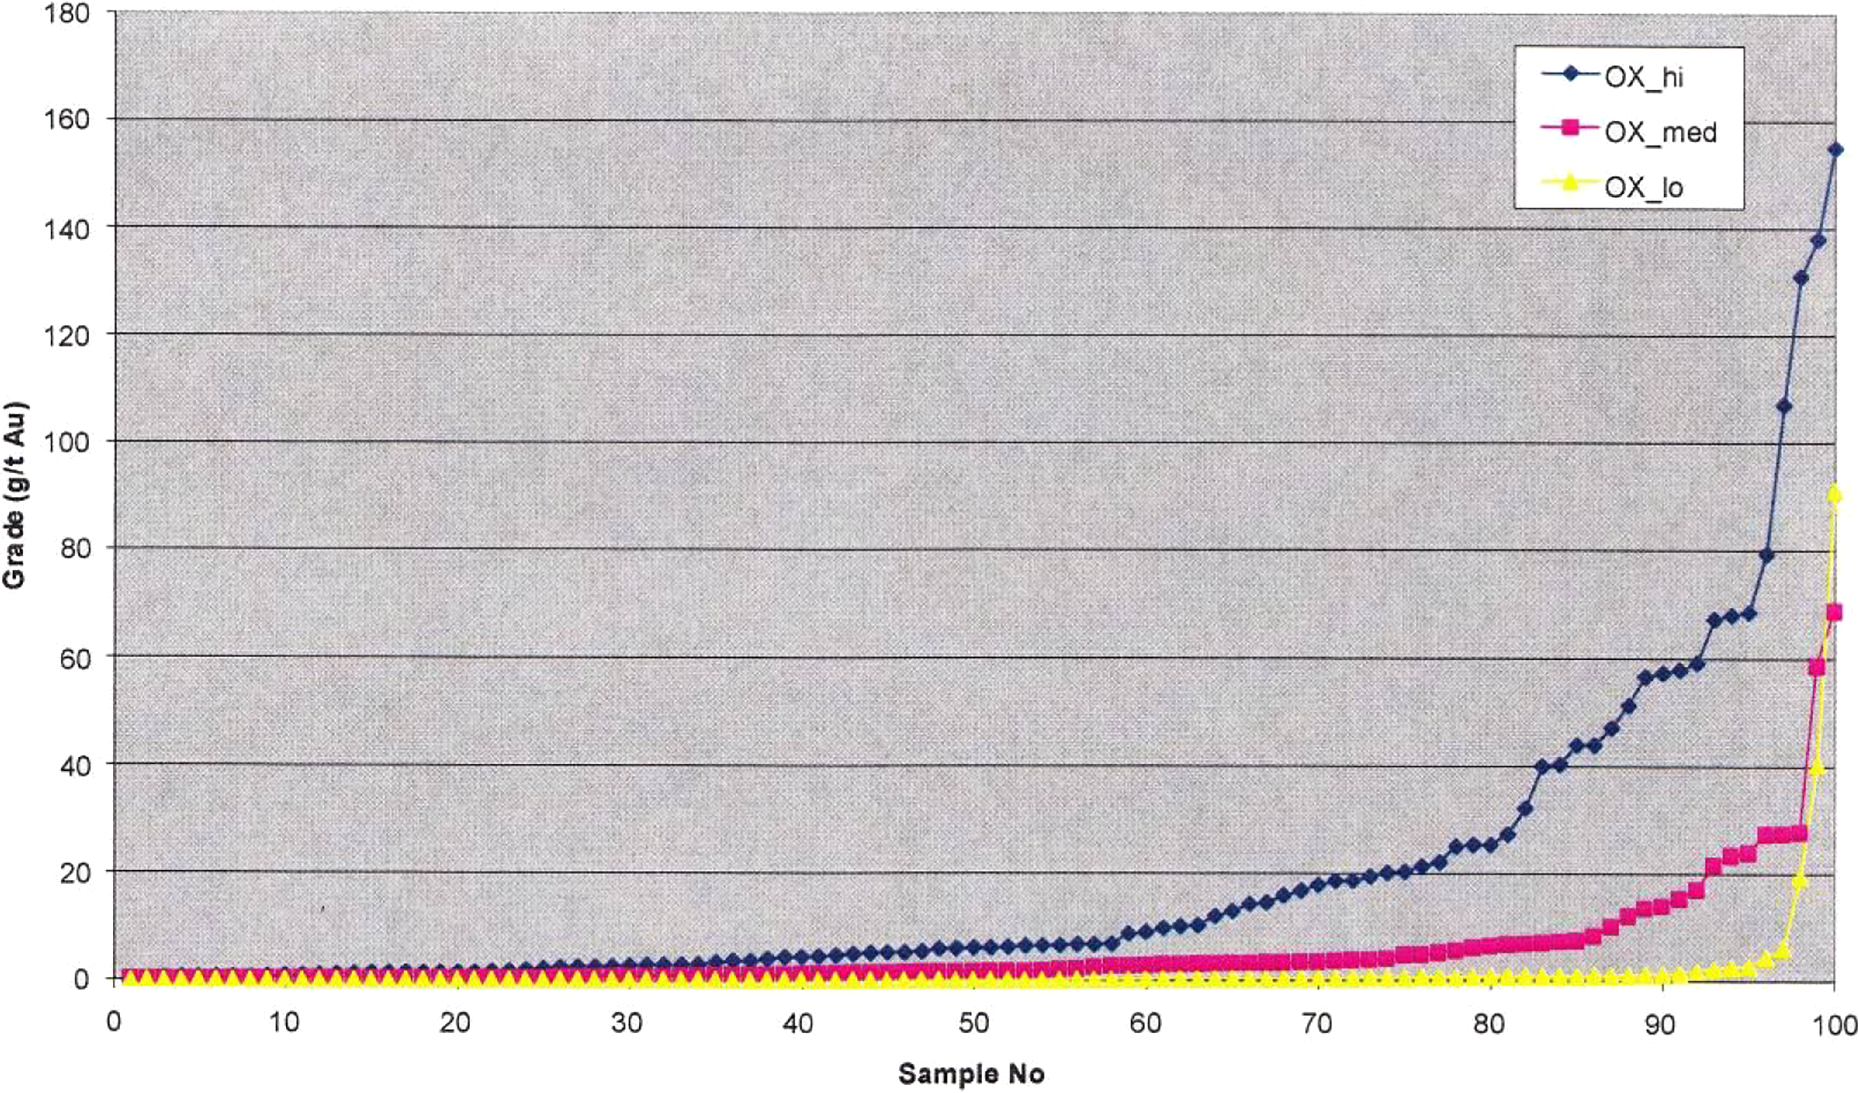
Three 100 group (30 particles) GHT grade profiles for Essakane oxide zone mineralisation
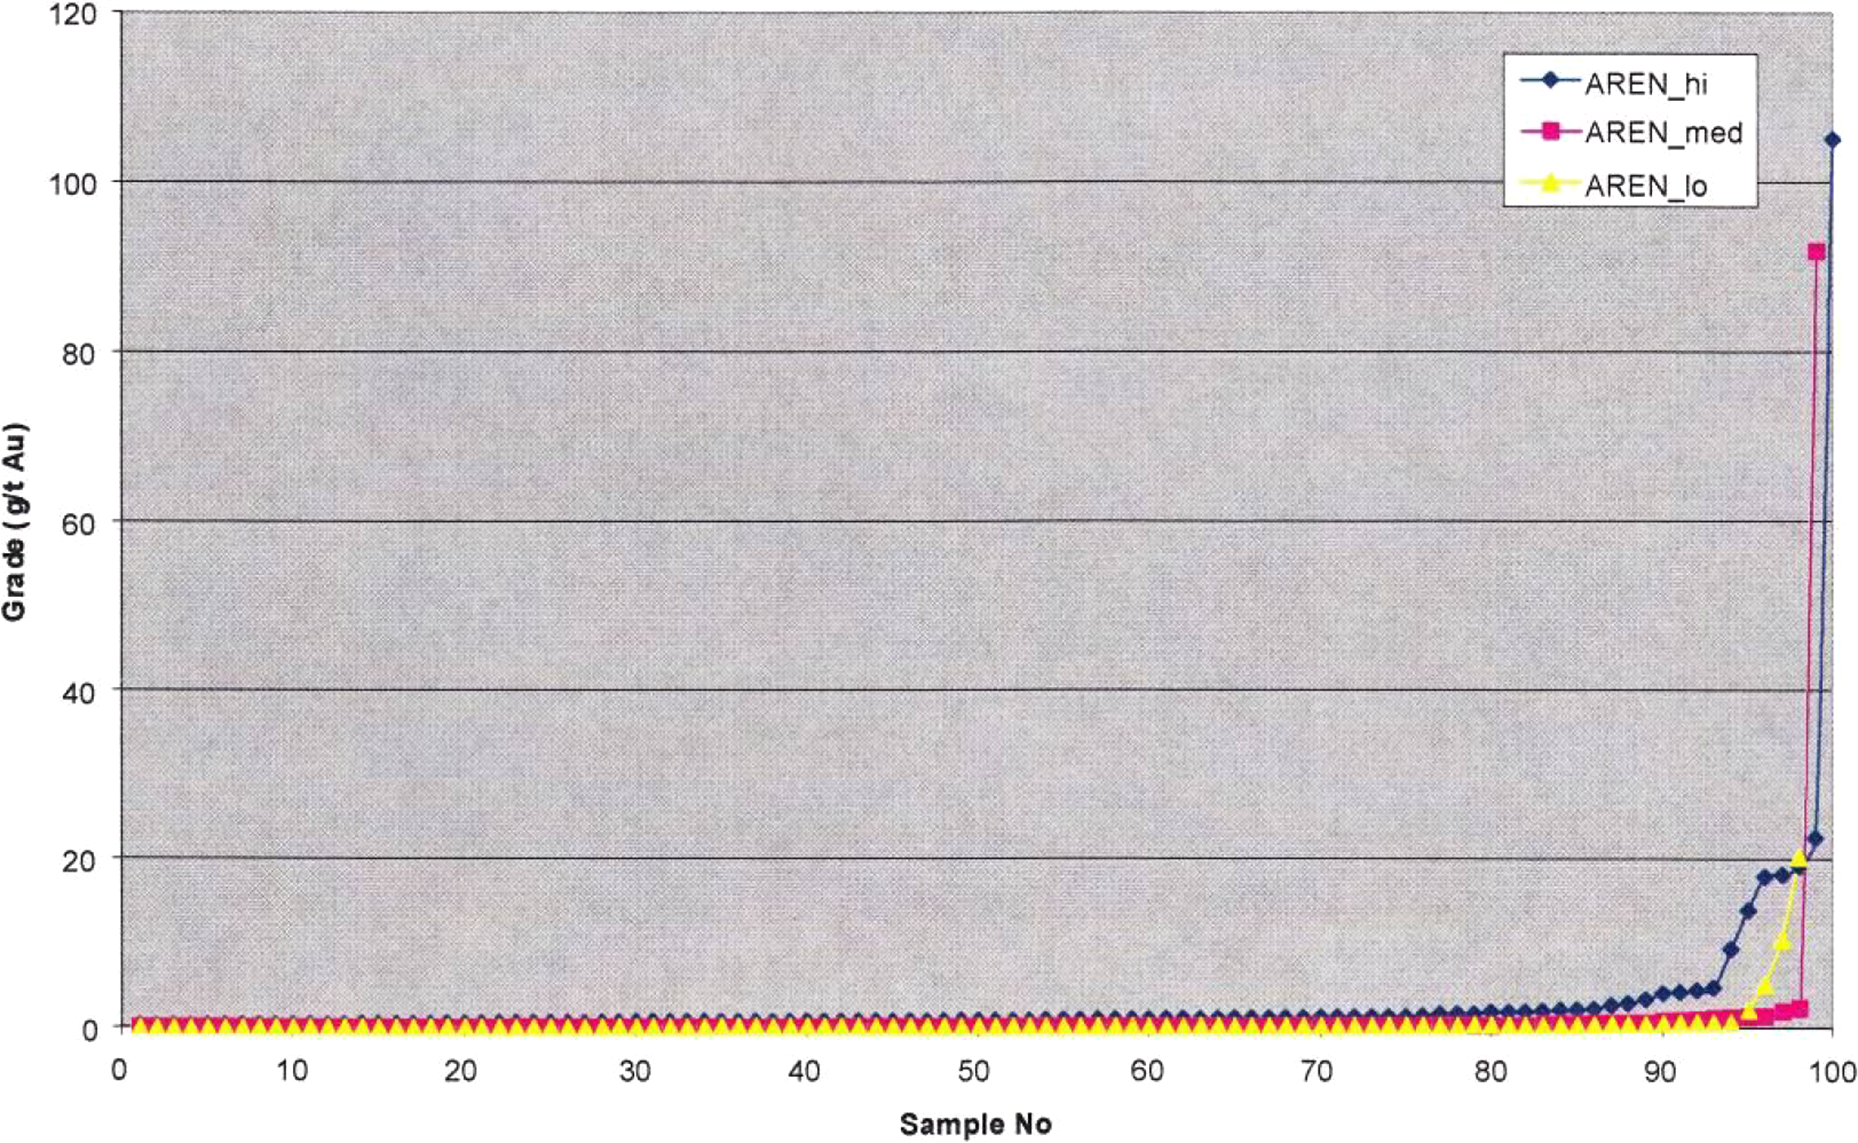
Three 100 group (30 particles) GHT grade profiles for Essakane fresh zone mineralisation
Composite GHT results across the four zones showed relatively minimal variability. However, historical knowledge (artisanal miners extracting gold by simple gravity methods), preliminary metallurgical testing (gravity recoverable gold values to 70%), geological observation (over 500 diamond and RC drill samples showing visible gold to 3 mm in size), screen fire assay results (>20% gold caught on the screen) and strong assay duplicate variability indicated the strong presence of coarse gold, and thus the GHT results appeared unrealistic.
As a result of the GHT findings, a series of metallurgical tests (including mineralogical work), screen fire assaying and processing of RC reject material via a laboratory Knelson concentrator was undertaken. These combined led to a dlAu of 1200 μm being defined as the worst case scenario over the four mineralised domains (Table 3).
Gwynfynydd mine, Wales, United Kingdom
Mineralisation at Gwynfynydd comprises composite quartz-sulphide veins. Five 50 (1.5 kg) piece SHTs were undertaken on Chidlaw lode stope material. The material sampled was low-grade (4 g t− 1 Au) run-of-mine ore. Individual fragments collected were quartz dominated to reflect the nature of the reef (>70% quartz). The low-grade ore was known to contain coarse gold, with up to 90% extractable by gravity (Dominy 2014b).
The tests yielded K values of between 85 and 960 g cm− 1.5 (Table 2; Fig. 6). Back-calculated dl values ranged from 5 to 495 μm (Table 2). The composite 250 piece SHT yielded a K value of 3315 g cm− 1.5 and dl of 440 μm (Fig. 7).
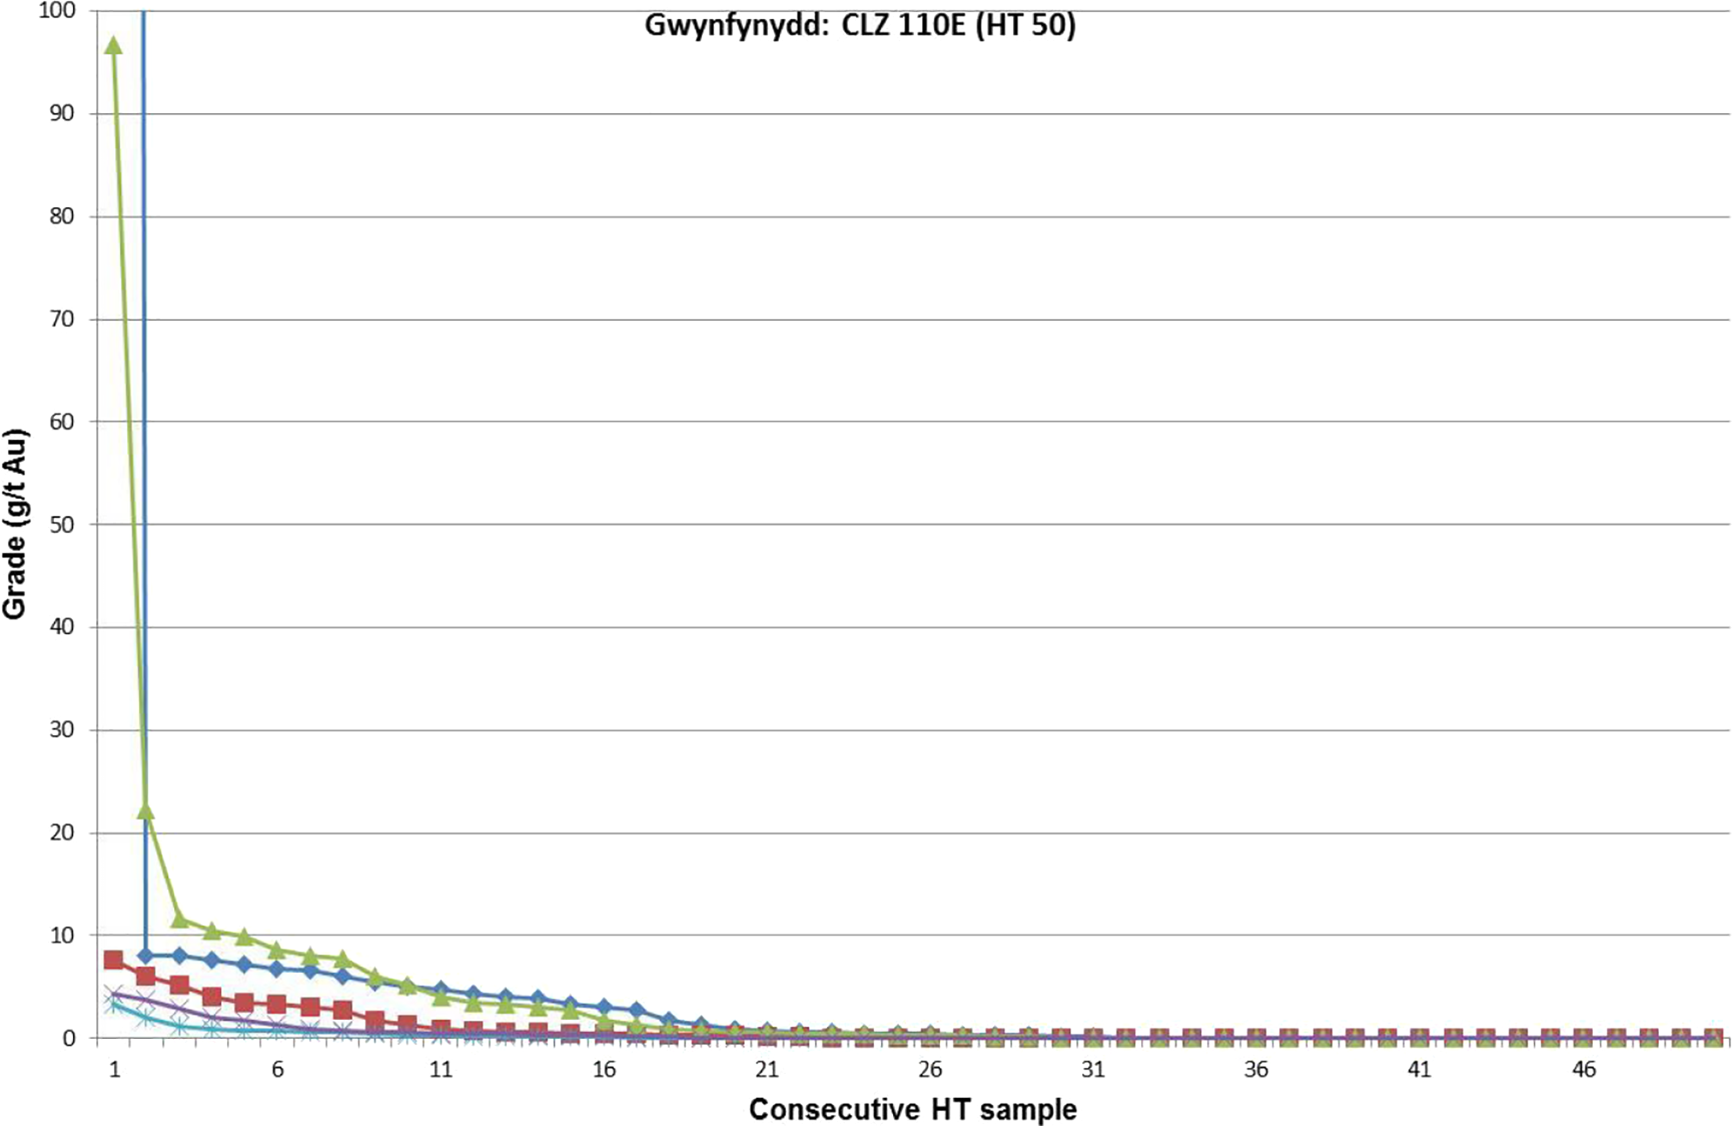
Five 50-piece 1.5 kg single heterogeneity tests (SHT) grade profiles for the Gwynfynydd Chidlaw lode
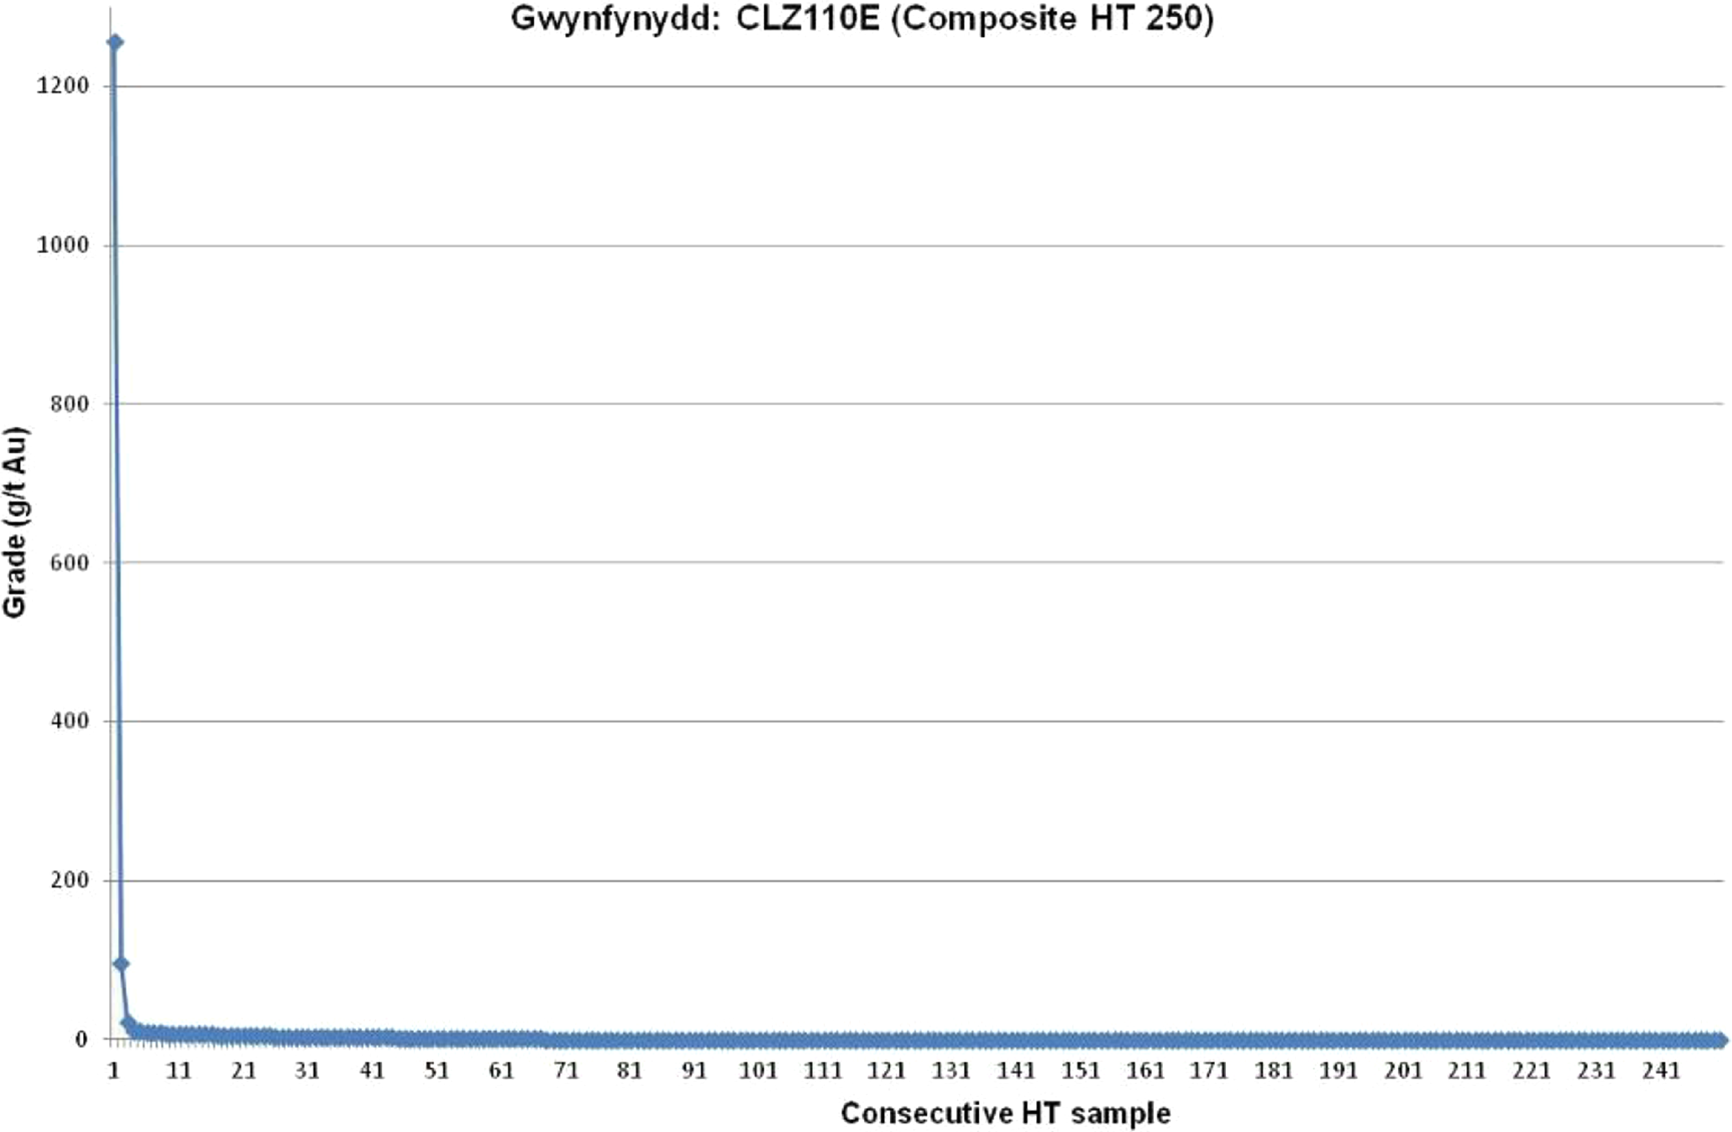
Composite (five 50-piece 1.5 kg single heterogeneity tests (SHTs) from Fig. 6) SHT grade profile for the Gwynfynydd Chidlaw lode
The tests show the potential precision issues with SHTs, given that SHT #2, #4 and #5 provide for relatively similar K values and SHT #1 a high value. Of note is the mean grade of the tests, which varies between 0.3 g t− 1 Au and 27 g t− 1 Au. This indicates that SHT #1 picks up more coarse gold compared to SHT #3, for example, as confirmed in screen fire assays. Field observation indicates that discrete gold clusters are present. Laboratory gravity processing of grade control samples consistently verified the presence of coarse gold in the low-grade ore (Dominy 2014b)
In addition, two GHTs were collected from a surface stockpile and from the same ore zone as the SHTs. Some 500 kg of 5–10 cm ore fragments were collected, crushed to P90 (2 cm and screened to produce approximately 190 kg of 1 cm product. Two one-hundred lots of 50–60 fragments were collected to gain a consistent group mass of 100 g. All samples were screen fire assayed in their entirety. Grade profiles for the two GHTs are given in Fig. 8. The tests yielded K values of 55 and 410 g cm− 1.5. The back-calculated dl values were 10 and 210 μm, respectively. The composite 200 GHT yielded a K value of 685 g cm− 1.5 and dl of 195 μm. Assays of the entire three fractions are shown in Table 4, which show grade heterogeneity between fractions.
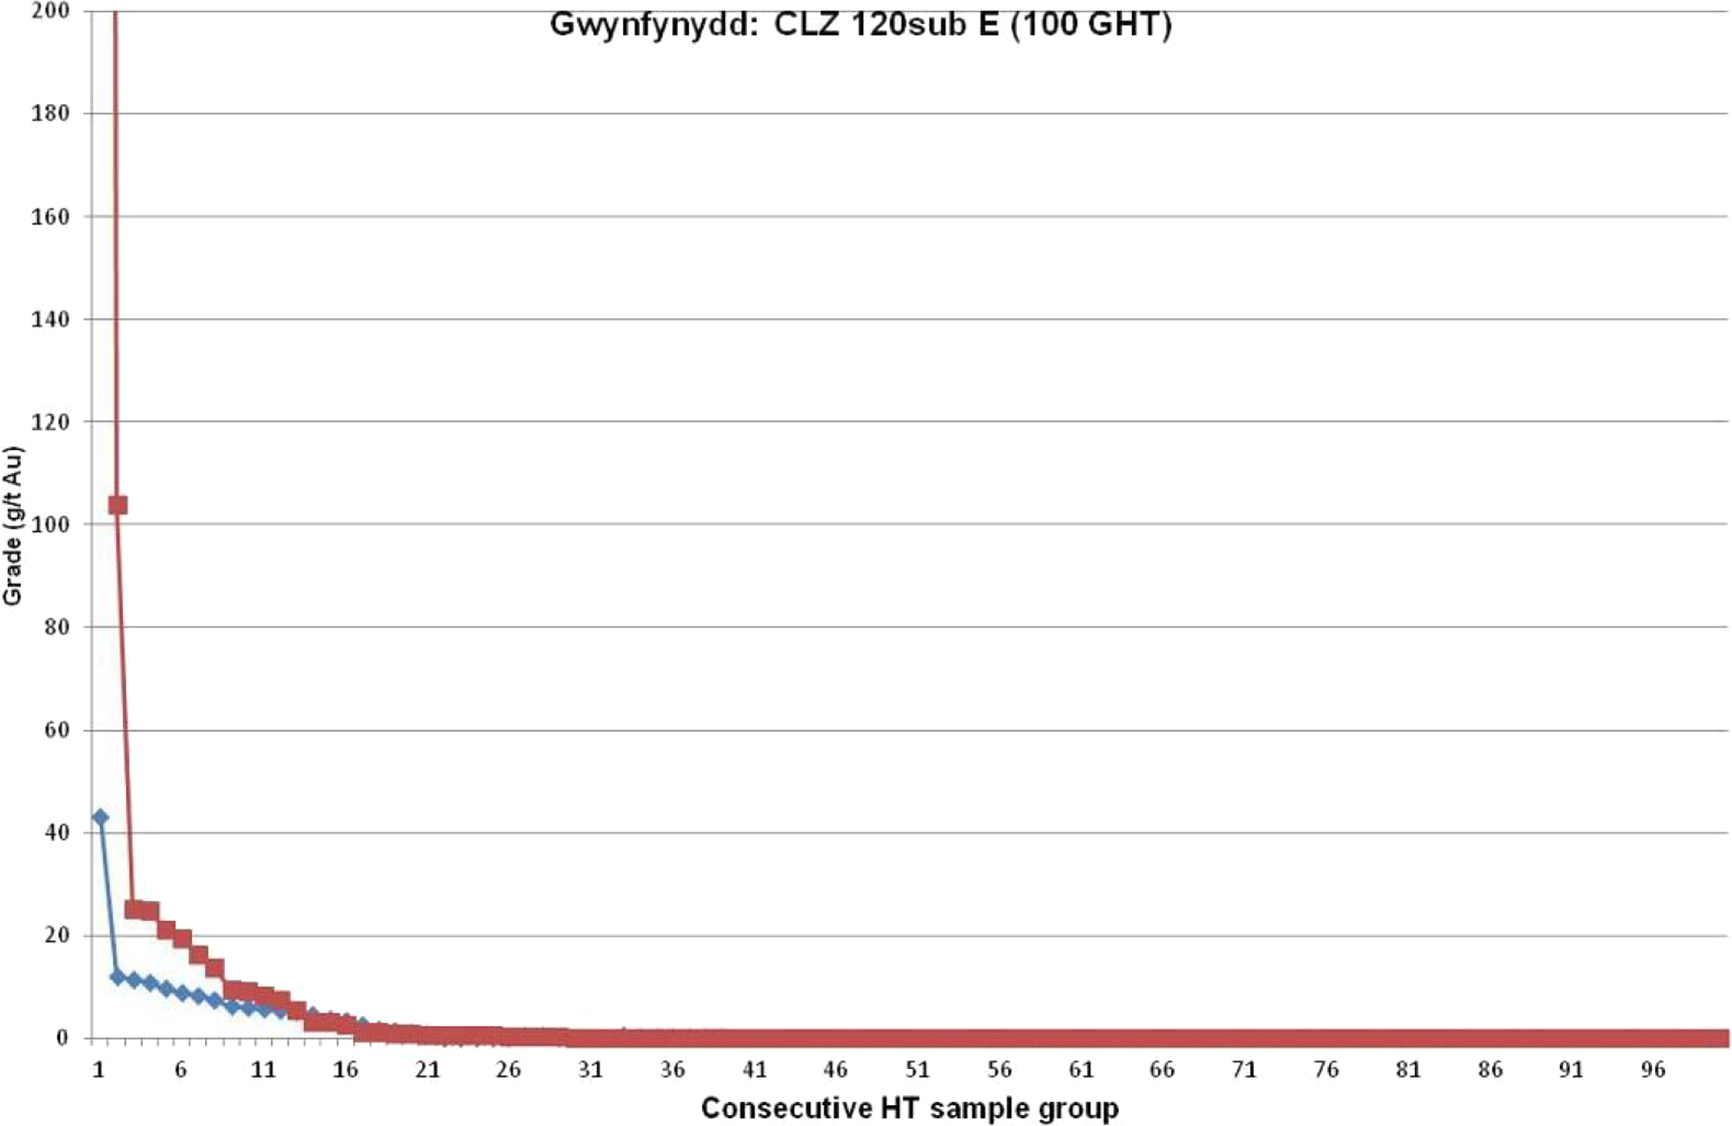
Two 100 group (60 particles) GHT grade profile for the Gwynfynydd Chidlaw lode. The highest grade on GHT2 (red curve) is 1456 g t− 1 Au
Screen analysis of Gwynfynydd and Bendigo ores
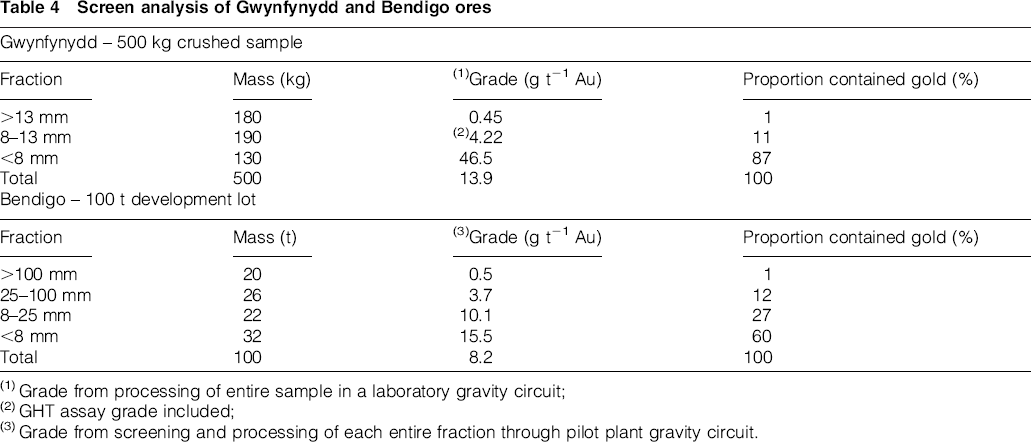
Grade from processing of entire sample in a laboratory gravity circuit;
GHT assay grade included;
Grade from screening and processing of each entire fraction through pilot plant gravity circuit.
The HTs (SHT and GHT) generally recognised coarse gold, but understated the effect of spatially restricted clustering. Further field and laboratory studies confirmed that in the low-grade ore, gold typically clustered with a dlclus of between 3000 and 8000 μm (Dominy and Platten 2007; Dominy 2014b). X-ray computed tomography confirmed the presence of clustered gold particles in hand specimens. For the low-grade ore domain, a dlAu of 3000 μm was used (Table 3).
Ballarat East mine, Ballarat, Victoria, Australia
Mineralisation at Ballarat comprises composite quartz veins, which locally form complex stockwork-like zones. Two sets of 100 piece DHT tests were available for the Llanberis Mako lode (Fig. 9). These are based on half NQ2 core pieces of average length 35 cm, mass 0.85 kg and comprising >70% quartz. The tests yielded K values of 240 and 270 g cm− 1.5 (Table 2). The back-calculated dl values were 105 and 150 μm, respectively. The composite yielded a K value of 275 g cm− 1.5 and dl of 135 μm (Table 2).
Two 100-piece 0.85 kg drill core heterogeneity tests (DHT) grade profiles from half NQ2 core for the Ballarat mine
An additional 500 piece DHT was extracted from the Mako database. These were whole NQ2 core pieces of average length 40 cm, mass 2.1 kg and comprising >70% quartz. The composite yielded a K value of 355 g cm− 1.5 and dl of 155 μm (Table 2).
Within both drill core and underground faces, visible gold is common. Batch processing included recording of gold particle size in various fractions recovered from the plant. The dlAu equivalent was around 3000 μm for 8 g t− 1 Au ore.
HT result implications for the case study sites
The sampling protocols applied at each case study are presented in Table 1. Values for dlAu and dl (back-calculated from HT results and estimated from metallurgical testing) are summarised in Table 3.
Across Ballarat and Gwynfynydd, no substantive changes were made as the results reinforced existing approaches. At Ballarat, whole core sampling and assaying continues support resource models. At Gwynfynydd, grade control was undertaken using mini-bulk sample processed through a laboratory gravity plant.
At Bendigo, the results led to a revision of the feasibility bulk sample plant splitting protocol. This was validated by acceptable duplicate bulk sample precision results. Trial mining bulk lots were fed into a pilot plant with no sample splitting. Whole core sampling and assaying was ultimately used to support resource models produced during 2009–2011.
The results at Essakane led to a further review and re-assay of RC sample rejects. LeachWELL assay (two by 1 kg) was introduced as part of the feasibility re-assay of RC and drill core rejects, and used for RC grade control drilling.
Discussion
The case studies report an investigation into the HT approach applied to coarse gold mineralisation. The examples represent relative extremes in coarse gold mineralisation, and should not be extrapolated across all deposits. In the four cases, if the HT test results had been accepted then based on an understated K value, incorrect sampling protocols would have been applied. The case study results indicate variability and under-call of K values from repeat tests (Tables 2 and 3). The HT is prone to relatively low precision and high bias, because of the very heterogeneity it aims to quantify. Results often provide an evaluation of the finer grained background gold population, approximating the dlsensuo stricto. It does not represent the most influential part of the population (e.g. coarse gold dlAu). A large sample mass is required to represent the gold particle size distribution, which may be 1000 kg. The critical short coming of the HT approach is that it uses only one fragment size and then applies that value to all other fragment sizes. The selected fraction is unlikely to represent the true lot, and this is exacerbated in coarse gold-dominated ores. Comminution of coarse gold-ores liberates gold, which is often seen to concentrate into finer fractions (Table 4). There remain questions over the definition and application of the liberation diameter. Parameters dl and dlAu have different meanings and effect on the estimation of FSE. In a fine-gold ore, the two values are more likely to be close, and thus have a minimal effect on the optimal sampling approach. In coarse gold dominated ores, the values may be an order of magnitude different (Table 3), leading to different K values and required sampling approaches. Characterising coarse gold mineralisation is a different problem to fine-grained gold deposits. A direct approach is required that evaluates the in situdlAu. A crush-screen-concentration method can provide appropriate results (Gonzales and Cossio 2007; Dominy, Platten, Xie and Minnitt 2011). Dominy et al. (2010) and Dominy et al. (2011) suggest a staged approach involving: (1) initial rock and core observations; (2) collection and testing of mini-bulk samples; (3) coarse gold determination based on concentrates from stage (2); and (4) data integration to define gold particle size curves. Advanced mineralogical techniques such as QEMSCAN and Mineral Liberation Analyser (Lyman and Schouwstra 2011), and high-resolution X-ray computer tomography (Dominy et al. 2012) may also be applied. Sample protocols should be reviewed on a scenario basis and accounting for the correlation of grade with dlAu (or dlclus). As a protocol progresses through comminution stages, consideration should be given to the change in dlAu. Optimisation around the cutoff grade should be investigated as it may represent a worst case scenario. Where optimisation leads to specialist and potentially costly protocols, then a trade-off study should be undertaken where the FSE can be used as a proxy to financial loss (Pitard 2009). The HT approach is not completely disputed, given it can work relatively well for base metal ores (Pitard 2004; Carrasco et al. 2005; Magri 2007; Gonzales and Delgadillo 2011; Dominy unpublished data). Application must be considered in the light of mineralisation characteristics and likely data quality.
Recommendations
The precursor to any sampling programme is characterisation via sampling for sampling (Dominy et al. 2010, 2011). The focus of characterisation is the determination of (a) the gold particle size range and (b) the dlAu and/or dlclus leading to the evaluation of K. Correlations between grade, dlAu and/or dlclus should be investigated. Careful review of drill core is a good start. A first step in characterisation is to collect a 300–500 kg sample of run-of-mine ore (e.g. from stockpiles or mill feed belt) and crush to a P90 of − 20 mm. The total crushed lot is then screened over two screens, for example, 13 and 8 mm. The three individual size fractions are then rotary split down to around 8–10 kg (e.g. +13, 8–13 and − 8 mm) and pulverised for around six 1.5 kg screen fire assay. Screen fire assay is chosen to evaluate the gold particle size trapped on the screen, thus providing a clear indication of the presence of coarse gold. A large LeachWELL assay could also be applied, though would not yield the coarse gold information and requires fire assay of tails. It is recommended that if the grade difference between the fractions is less than one order of magnitude, then the HT approach may be valid (Table 4). When dominant coarse gold is identified, actions can be taken to minimise sampling errors. Whole diamond core samples followed by whole core assays are a valid option. In the case of RC drilling, the run length can be reduced to 0.5 m to give a smaller primary sample. Whole core and RC composites can be assayed via screen fire assay (up to 2 kg mass) or LeachWELL (up to 5 kg). An alternative is to use laboratory gravity processing, where samples from 2 to 3 kg up to 250 kg can be processing in their entirety to effectively yield a zero FSE (Dominy 2014b). With good laboratory practice, other sampling errors can also be minimised. Further details of coarse gold sampling and assaying approaches are given in Dominy (2014a). Sampling programmes should always be tempered with an understanding of geological and gold particle size variability to maintain reality. The value proposition for good sampling is compelling. Coarse gold mineralisation will always have a higher inherent risk than other gold deposits and require a specialised approach. For coarse gold mineralisation, pilot testing (>1 t samples) and/or trial mining (>500§t) as part of the feasibility study are recommended to verify grade and metallurgical properties (Dominy and Petersen 2005; Johansen and Dominy 2005; Cintra et al. 2007). This study highlights avenues for further research including: the relationship between α, ore type and its determination; clustering effects and its determination; the relationship between background grade/gold and high-grade coarse gold; the ratio at which coarse/fine gold becomes material; and alternate approaches to characterising coarse gold ores with respect of K.
Acknowledgements
This work has benefited from the support of various exploration and mining companies, including: Bendigo Mining Ltd., Castlemaine Goldfields Ltd., Gold Fields Ltd. and Welsh Gold PLC. Professor Richard Minnitt (University of Witwatersrand, RSA), the late Dr Allen Royle (University of Leeds, UK) and Professor Kim Esbensen (GEUS) are thanked for their advice. Journal reviewers are acknowledged for their constructive comments on the manuscript.