
Abstract
Developing biofilms with low water uptake could be a promising route to potential environmentally friendly applications. Here, we describe an environmentally friendly approach to physically adsorb water-insoluble polyfurfuryl alcohol (PFA) on soy protein isolate (SPI) to develop a new material. Adsorption of PFA on SPI is confirmed from solid state NMR spectroscopy with the decrease in the –CH2OH peak around 57 ppm. These types of biofilms are derived from 100% renewable resources. The mechanical performance of these biofilms (at 65±2% RH) cured at optimum curing time showed a mechanical strength, σ, of ∼20 MPa, a Young's modulus, E, of ∼0·5 GPa, and a maximum water uptake of ∼50% when immersed fully in water for 24 h with good dimensional stability. Additionally, thermal stability of the biofilms increased with the adsorption of PFA on SPI. Surface morphology showed the presence of physically adsorbed PFA on the surface of SPI.
Introduction
The last decade saw the potential, challenges and feasibility of using biopolymers as plastics and in reinforced composites. 1 , 2 Polylactic acid (PLA), 2 , 3 soy protein isolate (SPI), 4 , 5 poly hydroxyl alkanoates (PHA), 6 , 7 and thermoplastic starch (TPS)8 fall under the category of biopolymers and they have received considerable attention from researchers all over the world. Transformation of these biopolymers from laboratory to industry is, however, hampered due to their high costs and the chance to compete with agricultural land used for food products, for example, PLA and PHA. On the other hand, SPI and TPS can be produced at low costs, however, their higher water uptake and lower mechanical properties limit their widespread applications. Target markets for these biopolymers include packaging materials, disposable nonwovens and hygiene products, and some consumer goods.1 It will take a number of years to produce PLA or PHA at reasonable prices. But it is possible to increase the mechanical properties and the water resistance of SPI. The water resistance of soy protein based materials has been greatly improved by using plasticisers – such as ethylene glycol,9 acetamide,10 thiodiglycol,11 – and additives – such as stearic acid,12 alkyl or alkenyl succinic anhydride,13 and carbohydrate filler.14
Recently, it has been reported that the water uptake of soy protein based plastics and composites can be decreased up to 50% and the mechanical properties can be increased, up to 10 times by arylating the soy protein materials with 2,2-diphenyl-2-hydroxyethanoic acid.15–17 Upon arylation, the low elongation at break, for all these soy protein films is the major concern for potential applications of these bioplastics. 16 , 17 Additionally, a decrease in the mechanical properties of the soy protein films with the increase in arylation time has also been reported.18
There are a few reports available for another interesting biopolymer, i.e. polyfurfuryl alcohol (PFA) – a hydrophobic polymer – obtained from sugarcane bagasse.19–21 The formation of conjugated sequences in this thermoset polymer – responsible for black coloured PFA – is due to acid-catalysed self-condensation of furfuryl alcohol.20 The branching and crosslinking events in black coloured PFA, subordinate to the formation of the polyconjugations, has been well established by the reaction scheme presented on the following page.20 In this scheme, furfuryl alcohol (FA) is represented when n = 0.
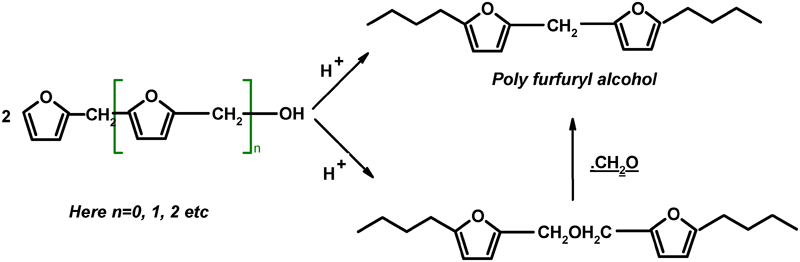
Importantly FA, the monomer of PFA, is completely hydrophilic and in this study, we have exploited this characteristic of the monomer for absorbing it on SPI to obtain physically adsorbed PFA. SPI films were prepared by the method reported previously.11 The adsorption of PFA on SPI samples and its effect on the structure, water uptake, molecular mobility, thermal behaviour, and mechanical properties were investigated. This work may contribute a novel idea for the preparation of water resistant soy protein materials with adsorption of PFA on it.
Experimental
Materials
Soy protein isolate (SPI) with about 90·27% (dry basis) protein content was purchased from Zhenghou Ruikang Enterprise Co., Ltd (Zhengzhou, China). Thiodiglycol (TDG) (bp = 164–166°C, mol. wt. = 122·19, and density = 1·182 g cm−3), furfuryl alcohol (FA) and p-toulenesulphonic acid (PTSA) monohydrate were purchased from Sigma-Aldrich, and were used as received.
Preparation of SPI films
TDG (30% w/w with respect to SPI) was mixed with SPI powder in an electronic mixer for about 15 min.11 The resulting mixture was subjected to a hot press at 140°C for 20 min under 50 bar pressure to prepare the SPI films. Here TDG has been used as plasticiser for the preparation of SPI films and the advantages of this plasticiser over commonly used glycerol plasticiser has been reported in the literature.11
Preparation of PFA-a-SPI films
A solution of PTSA monohydrate (0·3 phr with respect to the resin) prepared in 10 ml water was added dropwise to FA at room temperature in order to catalyse the FA. SPI films with dimensions of about 15 cm×3 cm, as prepared by the previously reported method,11 were immersed in the catalysed FA for 24, 36, 48 and 60 h. After the designated time, the SPI films were removed from the catalysed FA solution with the help of tweezers. Absorption of catalysed FA on SPI increased from 18% to 26% with the increase in immersion time of SPI from 24 to 60 h. In the next step, SPI films, with absorbed FA, were cured in an air oven for 2 h at 145–150°C to produce polyfurfuryl alcohol (PFA) adsorbed SPI films. The weight of PFA adsorbed on SPI film was dependent on the immersion time and it was found to be 3·2, 4·3, 6·6 and 6·7% for 24, 36, 48 and 60 h of immersion time, respectively. From Fig. 1, it was observed that with the increase in time, adsorption of PFA on SPI increased linearly between 48 and 60 h. Based on the above observations, the optimum time for absorption/adsorption of FA/PFA was 60 h (Fig. 1).
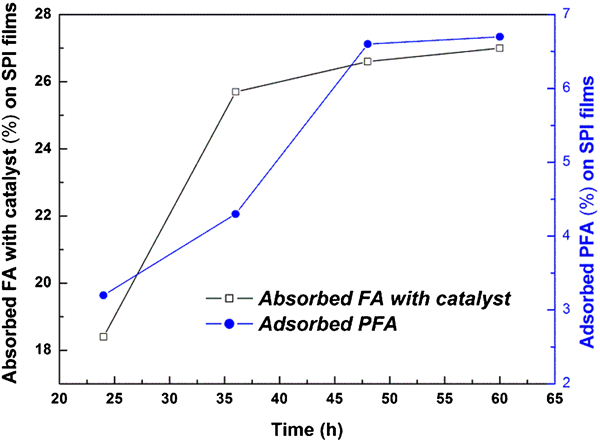
Absorbed furfuryl alcohol (FA) with catalyst and adsorption of polyfurfuryl alcohol (PFA) on soy protein isolate (SPI) films as a function of time (h)
Therefore, in the subsequent experiment, four SPI films (15 cm×3 cm) were immersed in catalysed FA for 60 h. Subsequently, these films were removed from the catalysed FA with the help of tweezers and cured at 145°C for 30, 60, 90 and 120 min in order to obtain cured PFA adsorbed SPI films (PFA-a-SPI) at different time intervals. PFA-a-SPI films obtained after curing at 30, 60, 90 and 120 min were designated as SPFA-30, SPFA-60, SPFA-90 and SPFA-120, respectively. It is true that once acid is added to FA, polymerisation starts that is slow in nature and the reaction mechanism has been illustrated.20 Crosslinking phenomena in PFA only take place at/above the curing temperature and that is the reason why FA absorbed SPI films were cured at 145–150°C.22
Characterization
Differential scanning calorimetry (DSC) of the catalysed FA was carried out on a Diamond DSC (Perkin Elmer, Buckinghamshire, UK) in the temperature range of 25 to 220°C at a heating rate of 10 K min−1. For DSC measurements, the sample was placed on an aluminium pan and nitrogen atmosphere was maintained during the test. Thermogravimetric analysis (TGA) of approximately 5 mg dried PFA-a-SPI film was carried out at a heating rate of 20 K min−1 between room temperature and 700°C in a nitrogen atmosphere on a TG-IR interface (Perkin Elmer, Buckinghamshire, UK). Fourier transform infrared spectra (FTIR) of the PFA-a-SPI were obtained on a Spectrum 100 FT-IR (Perkin Elmer, Buckinghamshire, UK) in the range from 4000 to 650 cm−1 using 8–10 mg of powdered sample. FTIR spectra of liquid FA and catalysed FA after 0 and 3 days of curing at room temperature were also obtained by putting a drop of liquid on the sample holder.
The solid state NMR spectra of PFA-a-SPI were acquired on a Varian VNMRS 500 MHz two-channel spectrometer equipped with a 4 mm Chemagnetics TM T3 HX MAS probe using a 4 mm zirconia rotor. All cross-polarisation (CP) spectra were acquired at ambient temperature with proton decoupling, a 2 μs 90° pulse, and a recycle delay of 3 s. The power parameters were optimised for the Hartmann-Hahn match; the radiofrequency fields were γCB1C = γHB1H≈54 kHz. The contact time for the cross-polarisation was 4 ms after optimisation with a variable contact time experiment. The free induction decay had 1667 complex data points and was Fourier transformed with 50 Hz line broadening. The spinning speed was 12 kHz. Adamantane was used as an external chemical shift standard, where the downfield peak was referenced to 38·3 ppm.
The tensile strength (σ), elongation at break, and Young's modulus (E) of the PFA-a-SPI films, conditioned for 3 days at 65±2% relative humidity (RH) prior to the experiment, were measured on an Instron 3369 tensile tester at a strain rate of 10 mm min−1 according to ASTM D882 (E). The films tested were 110 mm×15 mm (length×width) in dimensions and the thickness of the specimens was 0·75±0·05 mm. An average value from five replicates of each sample was taken for each of the tests mentioned above. The moisture content of the PFA-a-SPI films, at 65±2% RH, was also evaluated at room temperature. The films were preconditioned at 50°C for 24 h and weighed (W0). After conditioning the films for 3 days at the desired RH, the films were weighed (W1). The total weight gain of the film was used to calculate the moisture content of the films at 65±2% RH. Average values from three measurements are reported.
Dynamic mechanical thermal analysis (DMTA) was performed on a dynamic mechanical analyser (DMA8000, Perkin Elmer, Buckinghamshire, UK) in dual cantilever mode at a frequency of 1 Hz. The films tested were 50 mm×10 mm (length×width) in dimensions, and the test temperature ranged from 25 to 180°C, with a heating rate of 2 K min−1. The α-relaxation temperature, αr, was determined as the peak value of the loss angle tangent (tan δ). Scanning electron microscopic (SEM) images of the surface and cross-sections of the PFA-a-SPI films were taken on an FEI Quanta 200 (Eindhoven, The Netherlands) electron microscope at an accelerating voltage of 20 kV. The cross-section samples for SEM characterisation were prepared by freezing them in liquid nitrogen before fracturing. The surface morphology of the SPI film with absorbed FA was also recorded under the same conditions.
The water uptake of the PFA-a-SPI films was evaluated according to ASTM D570-81. The films were preconditioned at 50°C for 24 h and weighed (W0). After immersing in distilled water for 24 h, the films were dried with paper towels to remove the excess water on the surface and weighed (W1). The total weight gain of the film was used to calculate the amount of absorbed water. Average values from three measurements are reported.
Results and discussion
Structural characterization of PFA-a-SPI films
All the PFA-a-SPI films were characterised with the help of solid state NMR spectroscopy. Figure 2 shows the representative 13C solid state NMR spectra of SPI, PFA, SPFA-30 and SPFA-120. The top spectrum represents the SPI and the bottom one represents the PFA, while the middle two spectra correspond to the PFA-a-SPI with 30 min and 120 min curing times. The NMR signals observed around regions 180–165, 160–110, 65–45, and 40–10 were assigned to carbonyl carbons, aromatic carbons, the C-α of methines and side chain aliphatics of SPI, respectively23 (Fig. 2), whereas the NMR signals observed around 160–135, 135–90, and 45–20 ppm were assigned to C5, (C4+C3), and –CH2– of the PFA main chain24 (Fig. 2).
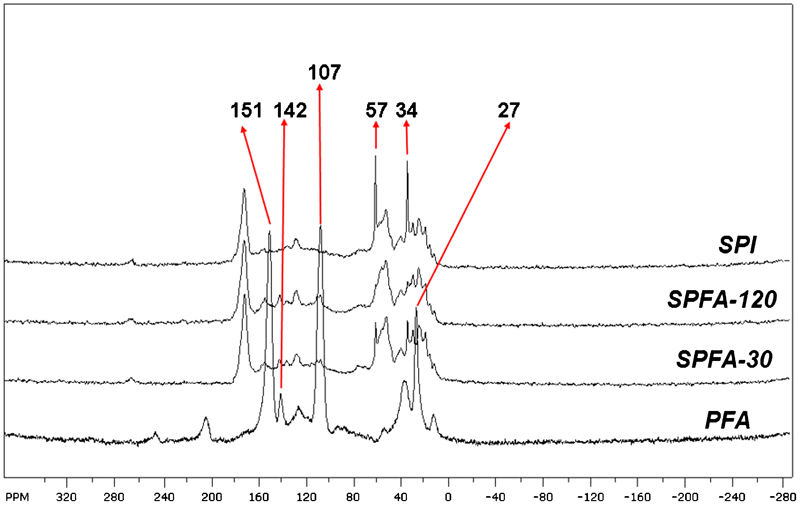
13C-CP/MAS spectra of SPI, PFA and PFA-a-SPI films. The NMR signals around 180–165, 160–110, 65–45, and 40–10 were assigned to carbonyl carbons, aromatic carbons, C-α of methines and side chain aliphatics of SPI, respectively, whereas the NMR signals around 160–135, 135–90, and 45–20 ppm were assigned to C5, (C4+C3), and –CH2– of PFA main chain
By comparing the overlaid spectra, the signals at ∼151, ∼142 and 107 ppm were no longer visible in SPFA, thus indicating the adsorption of PFA on SPI. Furthermore, in the region 160–100 ppm, the overlapping of the aromatic carbon signals of SPI with the C4 and C3 signals of PFA chain units also indicates the adsorption. Similarly, the signal around region 45–10 ppm was attributed to the overlap of side chain aliphatic carbons of SPI with the –CH2– of PFA. In this region, the absence of sharp signals at ∼34 ppm (SPI) and ∼27 ppm (PFA) also demonstrates the adsorption of PFA on SPI. The SPI and uncured PFA contain –CH2OH carbon at about 57 ppm.25 Due to curing, the peak at 57 ppm had decreased intensity in SPFA-120 compared to SPI and SPFA-30, and in PFA, the intensity was low.
On the other hand, as the curing time was increased from 30 min to 120 min, the sharp signals due to SPI in the region of 65–45 ppm converged towards broad spectra and this change seems to be more apparent with the increase in curing time which indicates the increase in degree of adsorption of PFA. This increase in polymerisation is also confirmed by the change in colour of PFA-a-SPI biofilms. Therefore, the solid state NMR analysis clearly confirms the adsorption of PFA on SPI and correlates well with the changes in properties of PFA-a-SPI films observed in this study.
Figure 3a shows the FTIR spectra of FA, catalysed FA and catalysed FA after 3 days. An FTIR spectrum for catalysed FA after 3 days was taken because SPI films were immersed in catalysed FA solution for a maximum of 3 days. The most relevant peak associated with the presence of a furan ring at 1003 cm−1 is observed in the FTIR spectra. However, there is no significant change in the spectrum of catalysed FA after 3 days and with that of the FA spectrum.
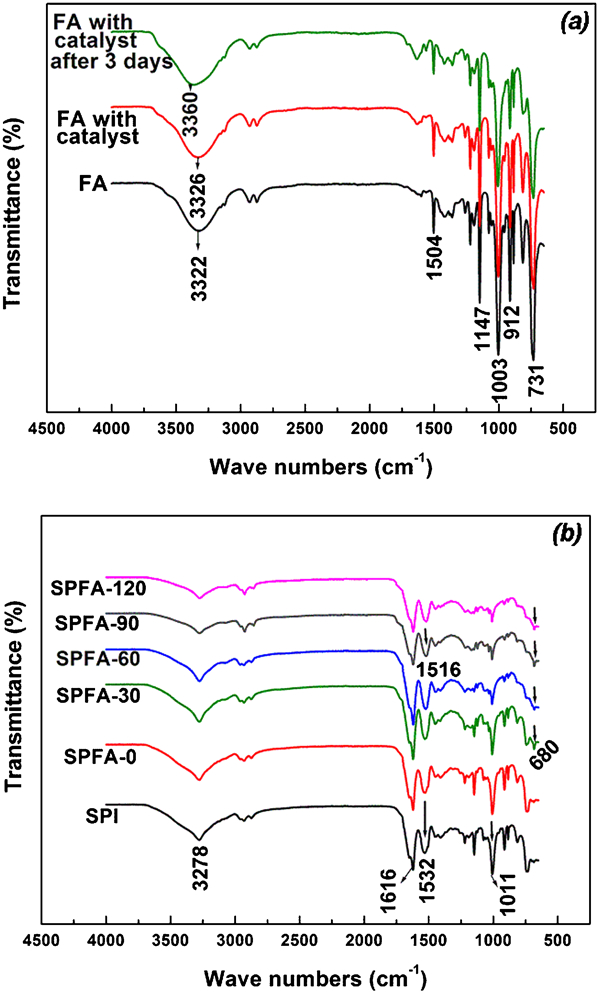
FTIR spectra of the FA, catalysed FA (a) and PFA-a-SPI films (b)
Figure 3b shows the FTIR spectra of the SPFA films. A broad N–H stretching band between 3200 and 3400 cm−1 is assigned to amide A of protein in PFA-a-SPI films. The main infrared band of protein is the amide I band appearing between 1600 and 1700 cm−1 which arises primarily from the stretch vibration of the peptide C = O group and is not observed in Fig. 3a. There is a shift of the band at 1532 cm−1 (assigned to N–H bending and C–N stretching) to lower frequency with the increase in curing time. The band at 1003 cm−1 from the furan ring merges with the band at 1011 cm−1 which is largely due to the C–O stretching of the alcohol. This band exhibited a decrease in intensity with the increase in curing time. Also, the number of methylene linkages in PFA increases with the increase in curing time, while the number of CH2OH groups present in SPI and PFA decreases due to self-condensation polymerisation and crosslinking phenomena during curing (discussed in ’Morphology of PFA-a-SPI films‚ section Figure 10 ). This is the reason for the decrease in intensity of the bands at 1011 cm−1 at long curing times.
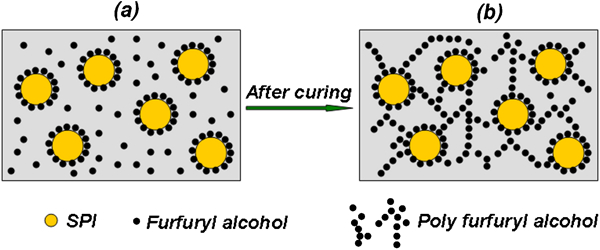
Schematic illustration of adsorption of PFA on SPI
Properties of PFA-a-SPI films
The moisture content of the PFA-a-SPI films conditioned for 3 days at 65±2% RH decreased with the increase in curing time and it was found to be 7·2, 5·7, 5·4, and 4·9 for SPFA-30, SPFA-60, SPFA-90 and SPFA-120, respectively. However, the moisture content of neat SPI film at 65±2% RH is 15% which is much higher than PFA-a-SPI films. The mechanical properties of the PFA-a-SPI films conditioned at 65±2% RH are shown in Fig. 4. The tensile strength and modulus of SPFA films exhibited an increase in their value from 7·5 to 20·6 MPa and 30 to 420 MPa, respectively, with the increase in PFA curing time from 30 to 120 min. Additionally, the percentage elongation at break also decreased with increasing curing time. It is important to note that the tensile strength and modulus of neat SPI films are 5·8 MPa and 15 MPa, respectively at 65±2% RH. Hence, adsorption of PFA on SPI increased the mechanical properties of the protein films considerably with about 6% elongation at break for SPFA-120. The elongation at break is higher than the arylated soy protein films, as reported earlier, 15 16 15,16,18 which is ideal for some consumer goods (such as containers or stationery) where lack of adequate extensibility restricts the application. Interestingly, the colour of the films darkened with the increase in curing time, which confirms the inevitable features of colour formation and branching in the polymerisation process of PFA.26
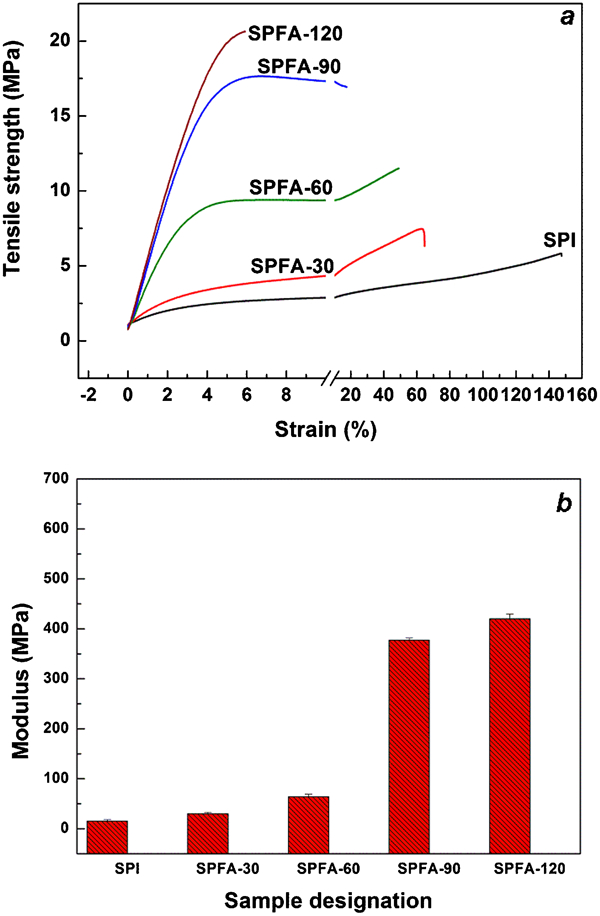
Stress–strain curves (a) and modulus (b) for PFA-a-SPI films conditioned at 65±2% RH for 3 days prior to the experiment
Figure 5 demonstrates the thermo gravimetric analysis (TGA) curves for PFA-a-SPI films. All the films exhibited two significant temperatures (Tmax) designated as Tmax1 in the temperature range 200–300°C and Tmax2 in the temperature range 300–400°C. First step mass loss is attributed to the loss of absorbed/adsorbed moisture and plasticiser (thiodiglycol) that has been used to prepare the SPI films. Second step mass loss is attributed to the degradation of the protein materials. The weight losses of the samples in the temperature range of 30–150°C have been determined and it was observed that with the increase in curing time for PFA, the weight loss decreased with the lowest value at 1·21% for SPFA-120. It also indicated that the PFA-a-SPI films showed lower moisture absorption. The Tmax2 peak increased from 335°C for SPI to 353°C for SPFA-120, indicating that the thermal stability of the films increases with the adsorption of PFA. The char yield at 700°C for SPFA films increased from 18·6% to 25·9%, with an increase in the curing time of PFA from 30 to 120 min. This can also be attributed to the increase in branching in PFA at long curing times.26
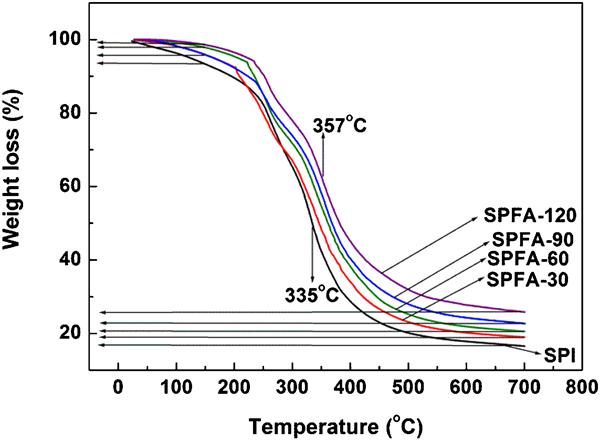
Thermal stability of PFA-a-SPI films. Top and bottom arrows on the left-hand side represent the decrease in moisture content and increase in char yield, respectively with the increase in curing time
Figure 6 shows the dependence of water uptake on curing time of the PFA-a-SPI films. SPI film, when immersed in water for 24 h, showed water uptake of 101%. However, with the increase in curing time for PFA in PFA-a-SPI films, water uptake decreased during immersion of SPFA films in water for 24 h and it was found to be 51% for SPFA-120. The decrease in water uptake in PFA-a-SPI films is due to the hydrophobic nature of PFA.
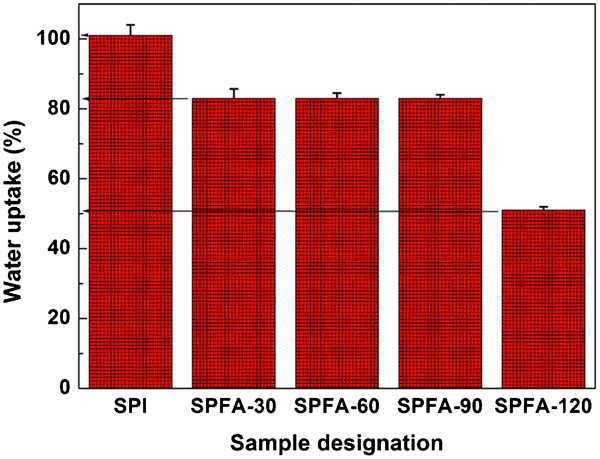
Water uptake of PFA-a-SPI films with increase in curing time
Figure 7 shows the temperature dependence of the loss factor (tan δ) of the PFA-a-SPI films. At short curing times (30 and 60 min), the increase in the Tα value is quite small, while at long curing times (90 and 120 min), there is significant increase in Tα values. This indicates that the increase in curing time for PFA decreases the molecular mobility of the protein segments in PFA-a-SPI. The decrease in the molecular mobility of the protein segments with the increase in curing time can be correlated with the percentage decrease in elongation at break for SPFA films, at long curing times (Fig. 4a).
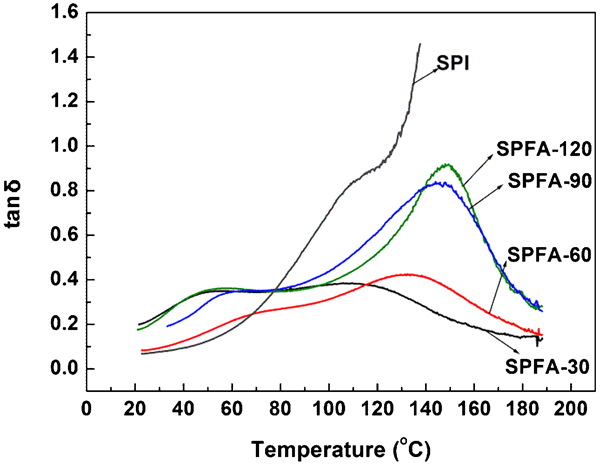
tan δ curves for PFA-a-SPI films at different curing times
Morphology of PFA-a-SPI films
Figure 8 shows the surface morphology of SPFA0 (catalysed FA absorbed on SPI film). From the surface morphology of SPFA0, we can obtain an idea of the surface morphology of FA absorbed on SPI. Catalysed FA as microparticles are observed in white (Fig. 8) while the black homogeneous surface represents the SPI moieties. Figure 9 (left) shows the surface morphology of PFA-a-SPI films at two different curing times. SEM images of the SPI film displayed a smooth and homogeneous structure on the surface. Upon curing, the PFA as microparticles appeared on the surface of SPFA-30 films which increases in dimensions in SPFA-120 indicating the crosslinking phenomena in PFA. Figure 9 (right panel) shows the fracture morphology of SPI and PFA-a-SPI films. In fracture morphology, homogeneous interfaces in SPI are observed. With the adsorption of PFA on SPI films, the fractured surface became rough with many parallel compact layered and raised structures suggesting a brittle surface.
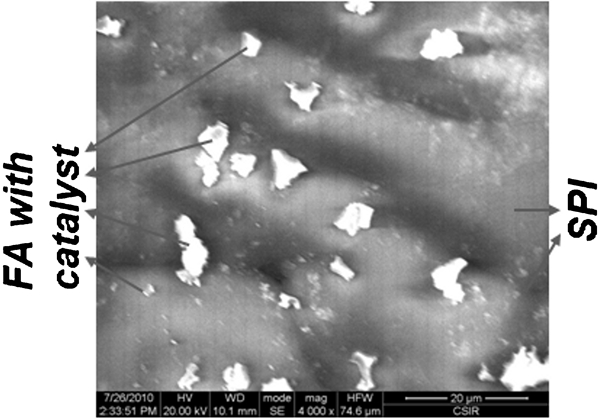
Surface morphology of catalysed FA absorbed on SPI film
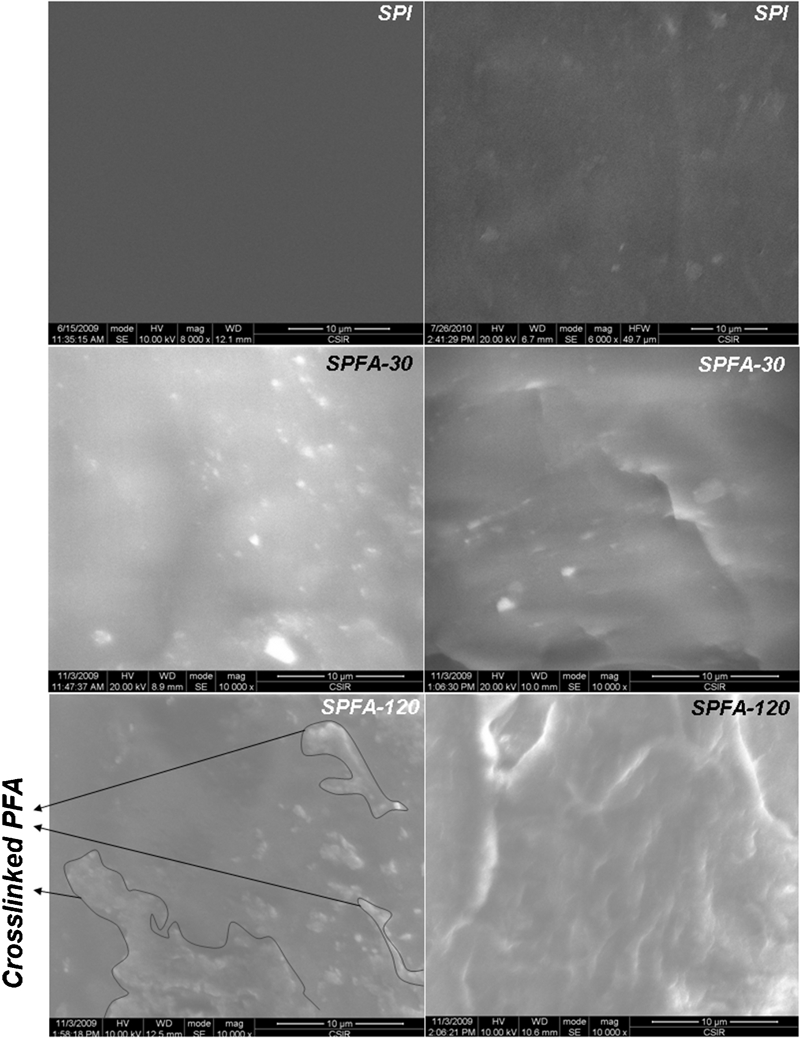
Surface (left) and fracture (right) morphology of PFA-a-SPI films
Based on the above results, the adsorption of PFA on SPI is illustrated schematically in Fig. 10. FA molecules appear around and in-between the SPI moieties due to the absorption of FA on SPI. FA undergoes self-condensation polymerisation and crosslinking at curing temperature (145–150°C) to give PFA. The length of the crosslinked structures increases with the increase in curing time. The more the crosslinking in PFA, the darker the colour of the PFA adsorbed SPI material. This is well confirmed by the decrease in the –CH2OH peak around ∼57 ppm in solid state NMR spectra with the increase in curing time (Fig. 2).
Conclusions
We have developed a new method for the fabrication of PFA adsorbed protein materials with good mechanical and thermal properties but with low water uptake. Interestingly, elongation at break, for these protein materials was found to be 6–7%. Surface morphology of PFA-a-SPI films showed the presence of crosslinked PFA on the surface of SPI. The resulting material is fabricated from 100% renewable resources. We anticipate that the inexpensive and simple process to create PFA adsorbed soy protein materials can be extended further to other proteins or cellulosic materials to prepare new materials with high mechanical and thermal properties but low water uptake. Further work is in progress to arylate the PFA-a-SPI films in order to reduce the water uptake of these biofilms even further.
Footnotes
Acknowledgements
I would like to thank Miss Heidi Assumption, Department of Chemistry and Polymer Science, Stellenbosch University, South Africa for help in carrying out solid state NMR spectroscopy. It is stated here that Dr Rajeev Kumar, one of the authors, was only involved in analysing the NMR results obtained from Stellenbosch University and he has no relation or involvement in any way in recording of the NMR spectra.