
Abstract
Life cycle assessment (LCA) is a sustainability measurement tool that identifies the environmental impacts of a product. The uniqueness of the LCA lies in its methodology, which aggregates all environmental burdens throughout the product's life cycle, providing many variables for optimisation of the product (or process). Having occupied a major market share, the environmental impacts associated with the manufacturing and disposal of polyolefins are quite high. The main theme of this paper is to review the reported LCA studies on polyethylenes and polypropylenes including recycled plastics, biobased materials, which are competing with polyolefins, and polyolefin composites. The widely claimed green product ‘recycled plastic’ is analysed in detail from an LCA perspective, and key points, which determine its sustainability, are discussed. The environmental impacts associated with the manufacturing of polyolefins and their bioalternatives are highlighted. The few published studies of polyolefin composites on different applications are also discussed.
List of symbols
energy recovery
high density polyethylene
low density polyethylene
mechanical recycling
organic montmorillonite
polyethylene
polyhydroxyalkanoates
poly(3-hydroxybutyrate)
polylactic acid
polypropylene
polypropylene–carbon nanofibre–glass fibre hybrid composites
polypropylene–glass fibre composites
Introduction
The consumption of plastics in UK is estimated to be 5 million tonnes per annum, and it is expected to increase by 1·5% each year. Properties such as lightweight, transparency, hygiene, durability and cost effectiveness have led to the development of many varieties and grades of polymers. The world's consumption of plastics was 1·5 million tonnes in 1945 and has grown to 245 million tonnes in 2006.1, 2 Even though there are wide varieties of plastic types in the market, the plastics that are mainly used in packaging applications are consumed in high volumes. The main reason behind this scenario is the availability of varieties of ‘use and throw’ products on the market, i.e. short life span products for many applications like milk bottles, water bottles, food packaging, etc. The simple property requirements and low cost associated with packaging have motivated industrial exploitation of polymeric materials for numerous applications. A relative comparison of plastic usage among different types of plastics is shown in Fig. 1. This pattern of usage has resulted in the disposal of a tremendous amount waste from plastic packaging in landfill sites, particularly polyolefins [i.e. polyethylenes (PEs) and polypropylenes (PPs)].
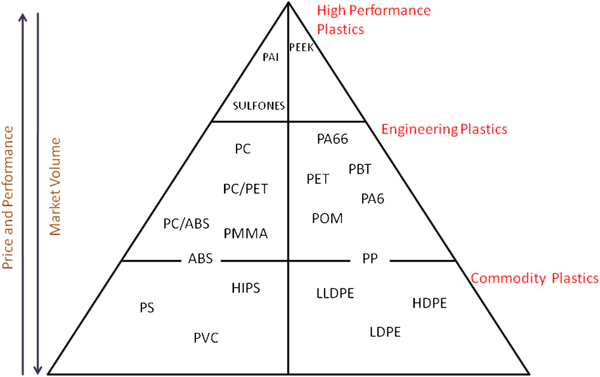
Polymer performance pyramid5
Plastic materials are manufactured from fossil fuels such as crude oil and have an energy content equivalent to that of the hydrocarbon feedstock from which they are produced.3 In addition to extraction from crude feedstock, polymer production involves cracking, monomer manufacturing and polymer manufacturing. These processes are highly energy intensive. Experts predict that the availability of fossil fuels may be limited to between one and three generations. Only 4% of petroleum resources are used for the production of plastics;4however, the environmental impacts associated with plastic waste disposal, non-availability of landfill sites and depletion of fossil fuels have motivated the plastic manufacturing sector to find alternative solutions. Since polyolefins have a huge market share among plastic materials, a small improvement in terms of sustainability of these materials can make a significant difference to the environment and the society. Several attempts have been made to reduce the environmental impacts associated with the use and disposal of PE. The use of recycled plastics, biobased polymers and biobased biodegradable polymers could be potential solutions to environmental problems such as reducing energy consumption, solid waste generation and global warming. This calls for a comparison of these alternative materials with the existing polyolefins.
The main objective of this paper is to review life cycle assessment (LCA) studies reported on polyolefins. Its scope is limited to the LCA of recycled polyolefins, polyolefins in packaging applications, fibre and particulate reinforced polyolefins and comparison of biobased materials, which are expected to substitute polyolefins for environmental reasons. Over 30 publications have been studied, and a tabular overview has been presented on LCA studies describing the analysis of temporal boundaries, functional units and impact categories.
Life cycle assessment methodology
The environmental performance of a product or a process has become a key issue. All major material manufacturers have developed different strategies to reduce environmental burdens. Some of these strategies are the following: using renewable or biological raw materials, source reduction, reuse methodologies, recycling or the use of recycled products and improving the energy efficiency of manufacturing processes. All or some of these methods may help in finding or developing a ‘sustainable product’. However, this may not be true always, as the product has to be analysed in its entire life cycle stages, i.e. from raw material acquisition to the end of its life, including the raw material supply chain, material processing, product fabrication/manufacturing and disposal. ISO 14040 defines LCA as ‘compilation and evaluation of the inputs, outputs and the potential environmental impacts of a product system’ and life cycle as ‘consecutive and interlinked stages of a product system, from raw material acquisition or generation from natural resources to final disposal’. The main advantages of using LCA as a sustainability measurement tool are avoiding problem shifting from one life cycle stage to another, locating ‘hot spots’ in the life cycle of a product and accounting for all types of emissions and resource consumptions. The LCA framework as outlined by ISO 14040 is shown in Fig. 2, and it mainly consists of four stages: goal and scope definition, life cycle inventory analysis, life cycle impact assessment and life cycle interpretation. A detailed explanation of all these stages can be found elsewhere.6–9
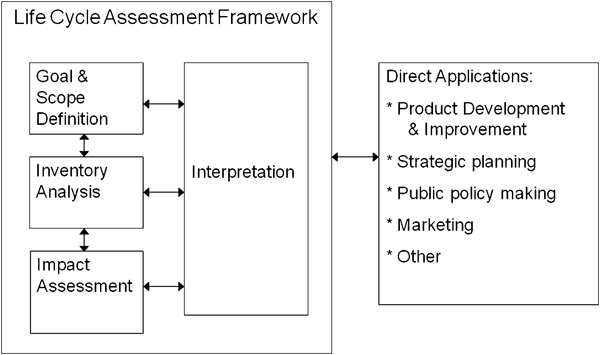
Technical framework of LCA9
Recycled plastics and plastics recycling
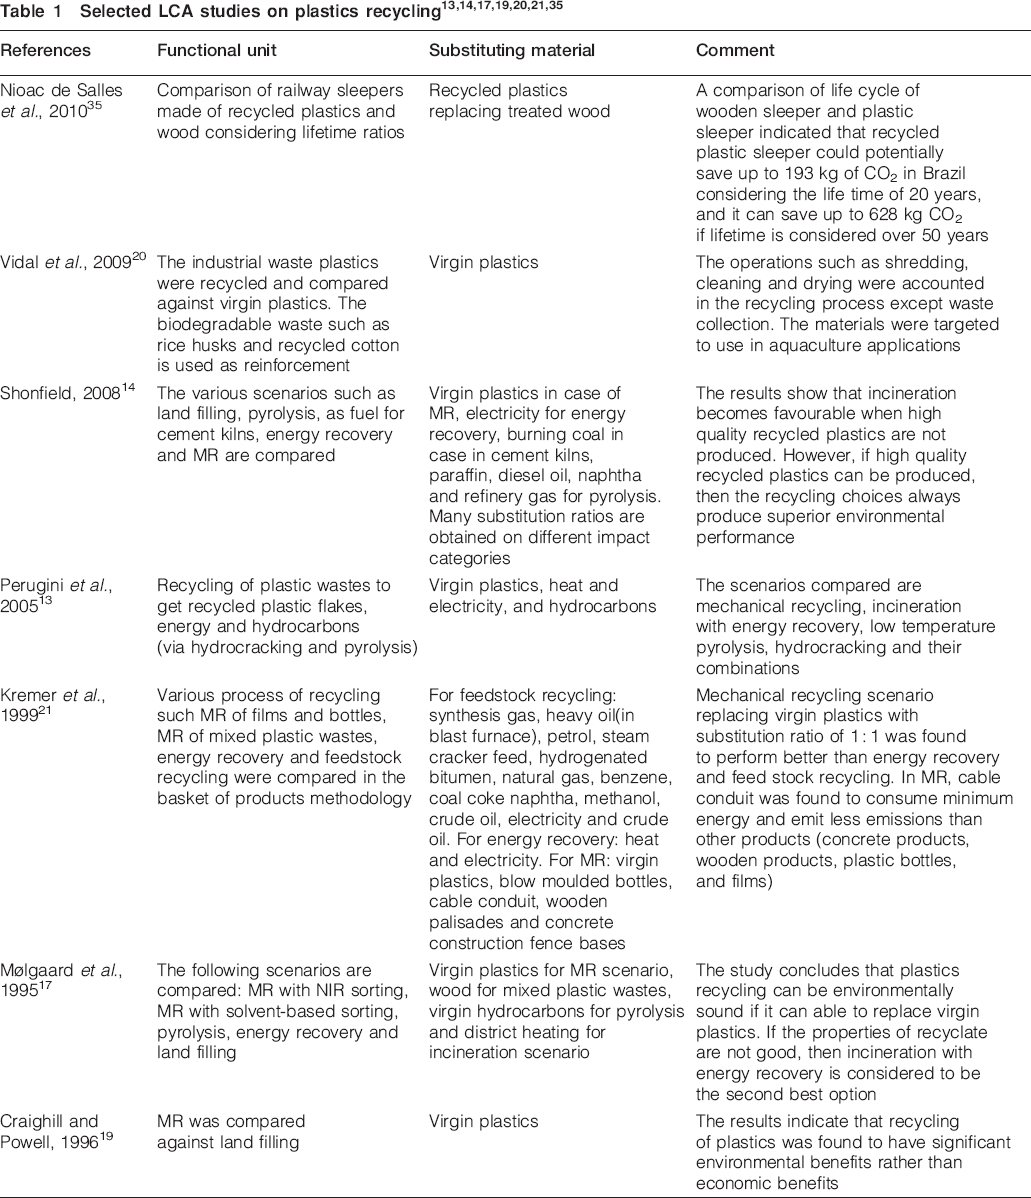
The use of LCA began in the 1960s with concerns over the impact of the growth of world's population on the demand for raw materials and energy resources. The importance of resource conservation was realised in 1973 when the world faced the first global oil crisis, during which the oil prices rose from 20 to 40$/barrel. However, ecological concerns shifted to waste management as interest in environmental analysis faded due to decreased interest in the oil crisis and the 1980s oil glut. Solid waste has become a significant problem in most of the developed countries, and LCA has reemerged as a strong and realistic tool to analyse varieties of sustainable waste management options.10 From 1988, several studies were published10–35 in solid waste management and particularly in ‘plastics waste management’. Some of the selected studies are given in Table 1 and summarised below.
The main objectives of plastics recycling are considered to be a reduction in environmental parameters such as consumption of raw materials, fuel and energy, emissions contributing to air and water pollution and solid waste generation. The level of ‘sustainability’ or ‘greenness’ depends on the application where the recycled plastics are used, energy consumption and emissions involved in recycling operations and waste recovery.
Waste recovery
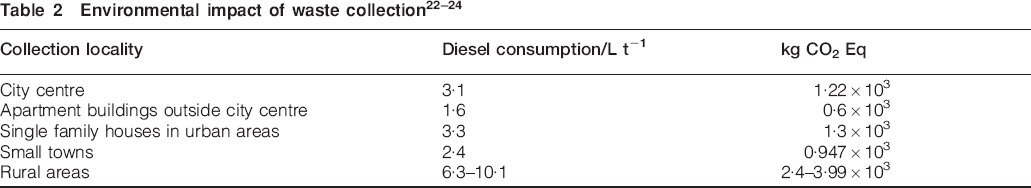
The waste recovery process involves collecting plastic waste from the point of generation, transporting the collected waste and dropping it off to the recycling centre or transfer station. The environmental impact arises from the energy spent to compact and transport the waste. Diesel consumption during transportation is one of the most important environmental burdens in the waste collection process. Astrup and co-workers22–24 measured diesel consumption for a variety of collection schemes; this is tabulated in Table 2. The environmental impact is lowest for locations outside the city centre, and it is closely followed by small towns. The burden is relatively higher for city centres and family houses in urban areas. The rural areas can have a larger impact because of long distances between pick-up points. The data clearly imply that population density plays a vital role in determining the environmental impact of waste collection. Boustead25 concluded from his studies that a high recovery rate will reduce the solid waste accumulation, although energy savings cannot be obtained, as explained in Fig. 3. Apart from population density and recovery rate, the vehicle type used in waste collection also plays a critical role. The impacts were predicted from SimaPro26 LCA modelling software using the Ecoinvent database. The environmental impacts listed in Table 3 arise mainly from diesel combustion accompanied by the impacts of diesel manufacturing, vehicle maintenance, vehicle manufacture, pollutants from tyre erosion and road construction. The data clearly indicate that the higher the capacity of the vehicle, the lower the impact.
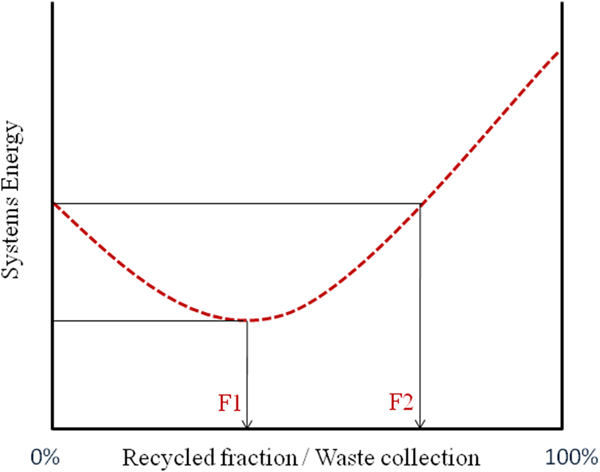
Plastics recovery and energy savings25(F1: recycled fraction for maximum energy savings; F2: minimum solid waste attainable)
Effect of collection vehicle26

Recycling operations
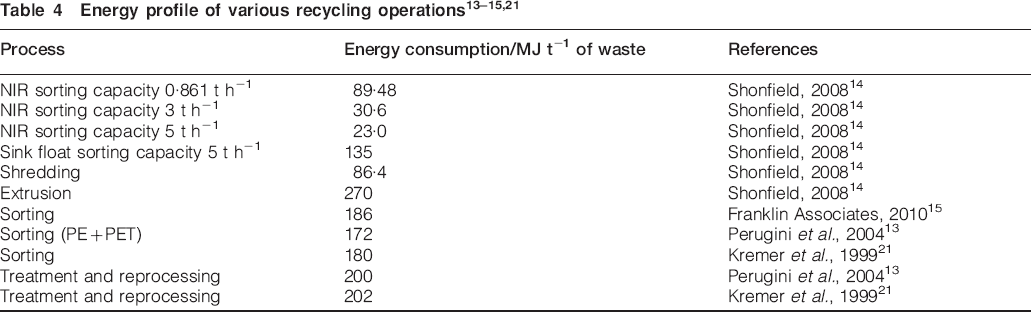
A typical recycling process involves film separation, sorting, shredding, cleaning and extrusion. Film separation involves sorting flexible films from rigid items. Separation of film from rigid packaging is an essential step as the presence of film in downstream technologies will affect their performance.27 Two types of sorting technologies are widely used: sink/float technique by gravity and near infrared technique (NIR). The details and limitations of these techniques can be obtained elsewhere.28 Shonfield14reports that these technologies are able to sort polymer waste with purities of >90%. The energy consumptions of these sorting processes are listed in Table 4. It can be interpreted from the data that the higher the capacity, the lower the environmental impact. The energy consumption was found to vary from 30 to 180 MJ t−1.
Applications of recycled plastics
According to the study of Shonfield,14 ∼3400 kt of plastic waste is generated each year in the UK, of which 2900 kt is packaging waste. Polyolefins constitute roughly 75 wt-% of the packaging waste. It can be inferred from these data that recycled polyolefins, which are the main focus of this review, mainly arise from the domestic sector. This sector presents the greatest recycling difficulties due to the poor quality and high level of contamination.
Recycling for replacing virgin plastics requires plastic waste that has been segregated at disposal or accurate sorting machines for mixed waste. The sorted plastic wastes are readily acquired from industrial waste recyclers, and the main sources of industrial wastes are PP jumbo bags, high density PE (HDPE) pipes, high volume chemical containers, rotational moulded HDPE drums and packaging films. The other category of plastic waste that requires sorting is household waste. Household waste includes HDPE milk bottles, shampoo bottles, film, thermoformed containers as well as paper and food waste. Kremer et al.21 and Perugini et al.13 reported the material loss of 40% in recycling mixed plastic wastes and 30% for the fraction of bottle waste. Astrup et al.22 reported the material loss of <10%.
Recycled plastics have to meet all the functional requirements of an intended application in order to replace virgin plastics. However, it was reported by several researchers that recycled plastics suffer from degradation in mechanical and flow properties, odour and colour.28, 29 The chemical and physical similarities of PE and PP make them completely inseparable even in modernised sorting systems. The presence of a small quantity of PP in HDPE hinders the processing of these waste plastics; PP will remain as a dispersion of lumps in the PE phase and initiate melt fracture in film extrusion.30Polypropylene is also incompatible with HDPE and reduces the impact strength of the mixed plastics, which is attributed to the poor interfacial adhesion between PP and HDPE.31 Some products like pipe materials, waste bins and bottle crates are easy to collect and sort. However, these types of products have long service lives and would have undergone considerable degradation before disposal, so their mechanical properties are not high enough to permit recycling. In each of these cases, the quality of these materials can be improved by blending with virgin resins. However, achieving equivalent properties to those of virgin plastics is difficult. Studies on the blending of virgin with recycled plastics for a variety of applications are reported elsewhere.29One such example for piping applications is shown in Fig. 4, which reveals that attaining properties equivalent to those of virgin plastic by blending with recycled plastics is not always possible, and success varies according to the application and property requirement. However, in certain domestic applications (detergent containers, shampoo bottles and injection moulding applications), virgin plastics were blended with 25–30% of post-consumer plastic wastes. Some special grades were also commercialised by resin manufacturers, including Solvay (Fortiflex) and Lyondell Polymers (Alathon). These ‘recycled tolerant grades’ were produced with enhanced environmental stress cracking resistance to compensate for property deficiencies.32
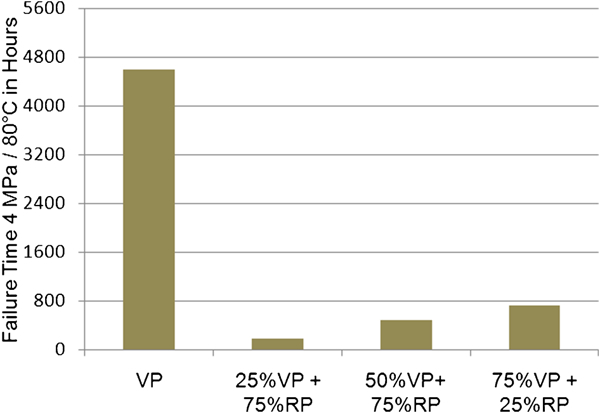
Long term failure test under internal hydrostatic pressure: effect of mixing virgin plastics with recycled plastics29(VP: virgin plastics; RP: recycled plastics)
The quantity of recycled plastics is decreased by losses in handling recycled plastics. In addition, recycled plastics experience a loss in mechanical properties and other functional characteristics, which decreases the quality of recycled plastics in comparison with virgin plastics. One tonne of collected plastics waste can substitute approximately 700–800 kg of virgin plastics. Low quality recycled plastics are also replacing impregnated wood in applications, such as noise barriers, poles and fences. Impregnated wood in lumber applications has been found to consume 580 MJ t−1.33 However, the use of recycled plastics in replacing virgin plastics is considered to be more beneficial than using these materials as a substitute for wood. The environmental efficacy of recycled plastics is examined in Fig. 5, which presents the energy consumption and carbon dioxide emissions associated with waste plastics in different applications. Three scenarios are considered: feedstock recycling, energy recovery and mechanical recycling. Details concerning unit processes and life cycle models can be obtained elsewhere,21 and a short description about the products and substituting material is given in the Appendix.
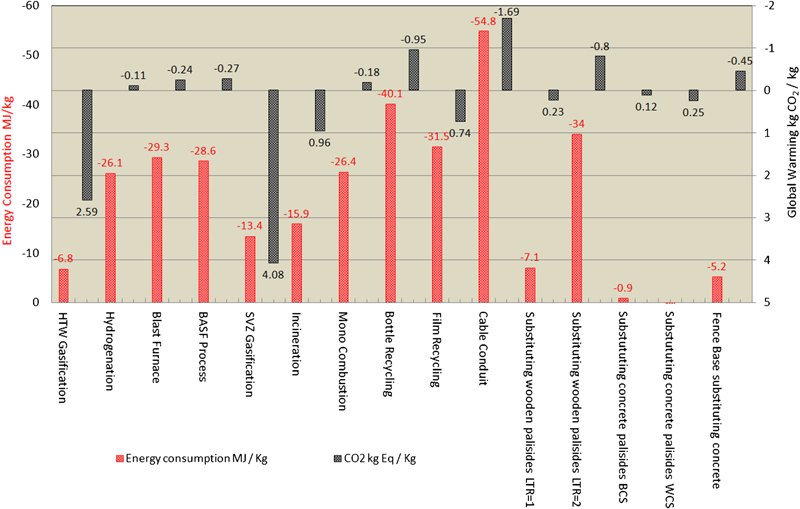
Energy consumption and global warming potential of various recycling options21 (LTR: lifetime ratio)
Different recycling systems produce different products. The recycling system is contrasted with a reference system in order to improve the comparability of the different recycling processes in the same context. The reference system consists of impacts associated with land filling processes and manufacturing of the product from virgin materials by a conventional process, instead of making them from the recycling process. The values for energy consumption and CO2 emissions given in Fig. 5 represent the differences between the recycling and reference systems. A positive value indicates the creation of an environmental burden with respect to the reference system, whereas a negative value indicates that the environmental burden has been mitigated. Additional details can be obtained elsewhere.21, 29The waste incineration and feedstock recycling scenario show a potential energy saving of 25–30 MJ kg−1 with a reduction of ∼0·25 kg of CO2. However, these numbers could increase in other sites if the energy generation from waste incineration replaces the electricity produced by highly inefficient and polluting processes. With regards to replacing virgin plastics with recycled plastics, the scenario of replacement for cable conduits shows that there is a maximum potential in saving energy since the substitution ratio between virgin and recycled plastics is 1∶1. The bottle and film fraction shows a reduced energy savings of 30–40 MJ kg−1, since they suffer with huge material losses. A maximum energy saving of 7·2 MJ kg−1 can be achieved when mixed plastic wastes are used to substitute concrete and wooden products with an equivalent service life. Generally, recycled plastics are free from rotting and bacterial attack and thus benefit from a long service life. In the best case scenario, one plastic palisade can replace four wooden palisades with a resulting energy saving of 34 MJ kg−1. Replacing concrete palisades has not been shown to yield significant energy savings. It can be inferred from the above literature that a recycled plastic product can be a green product only if it is made from an energy efficient process that is free from material losses and can replace an energy intensive product.
Many applications of recycled plastics are mainly focused on low value applications. However, there are few products available in structural and engineering applications. Railway sleepers made from mixed plastic wastes is one such initiative for high value applications. In the case of railway sleepers, recycled plastics replace impregnated wood, and a significant reduction of 198–628 kg CO2 is reported35throughout the lifetime of the product.
Polyolefins and related materials
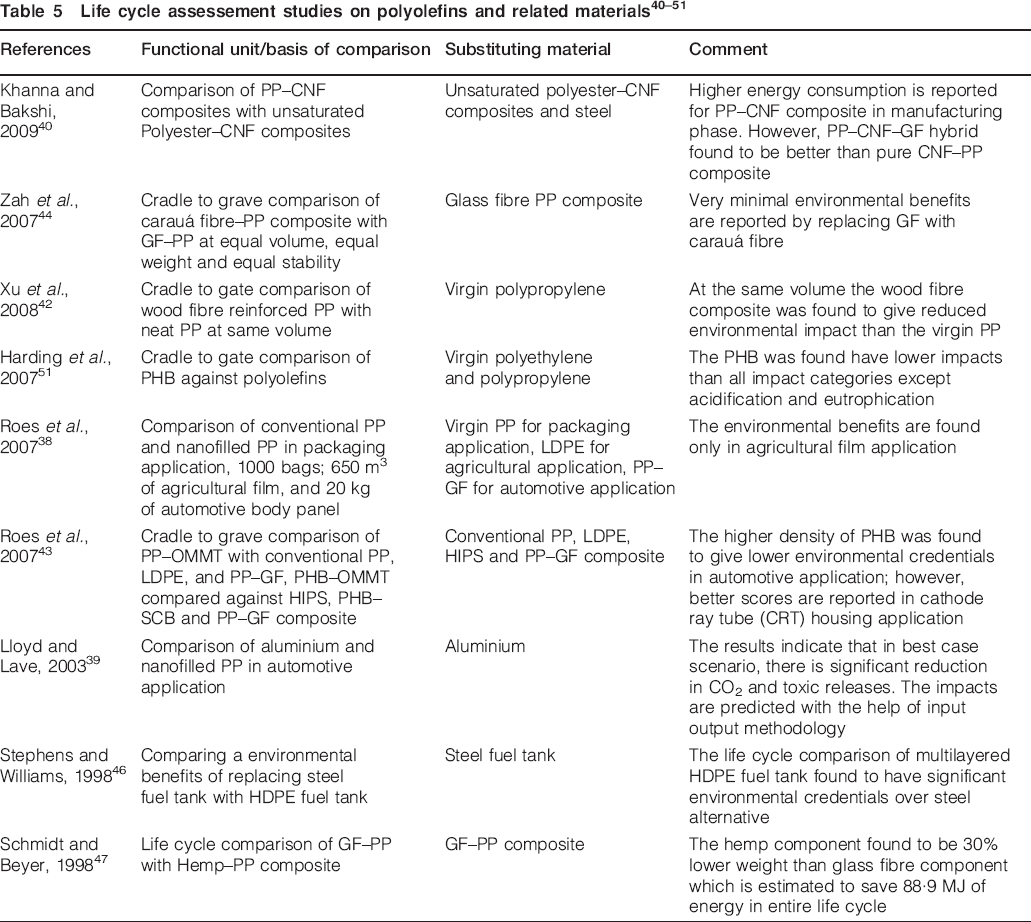
Polyolefins are most commonly used for packaging and automotive applications. Because of the threat to the future availability of fossil resources (crude oil, natural gas, petrol and diesel), many research studies have been undertaken as a matter of urgency by concerned authorities, institutions and private industries. This is being accompanied by the introduction of several bioplastics onto the market. These materials were mainly engineered for use in packaging applications, and high end biopolymeric products are currently under research. Some of the key drivers for the preference of bioplastics over petroleum based products are fossil fuel savings, lower toxicity and biodegradability (in some cases). The use of renewable resources also permits the sequestration of more CO2, which would help to meet Kyoto protocol emission standards for CO2.34 At the moment, there are a large number of green materials performing well in many practical applications. The competitiveness of products from alternative sources such as PEs and PPs may increase relative to those produced from fossil fuels due to efforts by manufacturers to improve the energy efficiency and performance of these materials. Examples of biobased products on the market include Biopol, Nature works, Stanyl, Solanyl and Sorona. In 2003, the average prices of poly(3-hydroxybutyrate) and PLA were around €20/kg and €3/kg respectively. In 2010, the average prices of these materials were down to €3 and €1·5 respectively,36 and the prices are further expected to fall at higher manufacturing volumes. Having spent few years in developing and commercialising these biopolymers on the market, manufacturers are now targeting the range of applications that will widen market opportunities. At this early stage of technological development, these materials are also suffering from drawbacks in functional properties compared with petroleum based materials. Despite the attention given to biomaterials, there are concerns for land availability and the pressure on agriculture that arises from substitution of petroleum based materials. In this study, the discussion will be limited to sustainability rather than focusing on technoeconomic considerations of polyolefins and biobased materials. Several LCA studies were conducted in the last few decades on polyolefins and competing materials. Some of the studies on polyolefins and their composites are listed in Table 5. The energy consumption of polyolefins, competing materials and reinforcements are shown in Table 6.
Energy consumption data on recycling operations
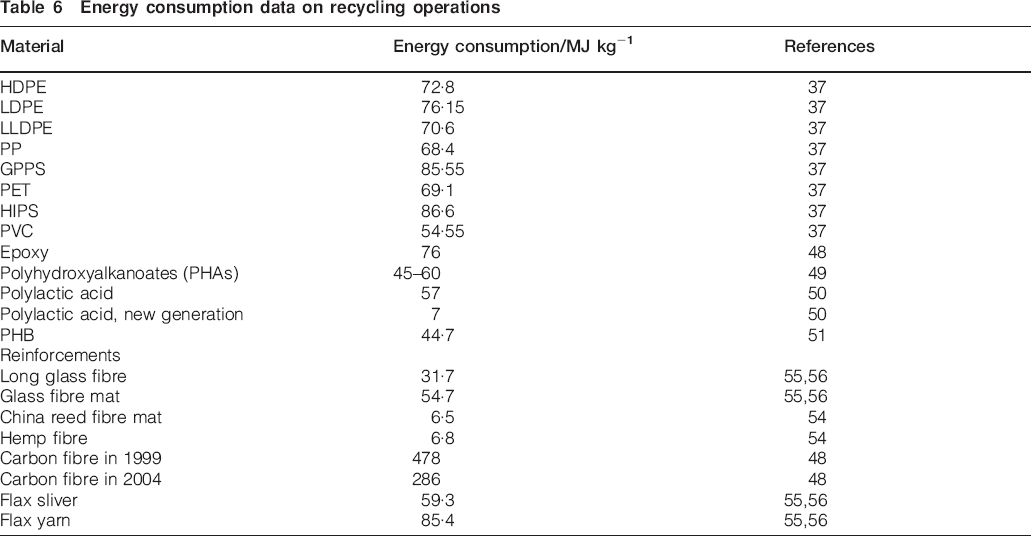
The energy values in Table 6 represent the cumulative energy from cradle to factory gate, comprising precombustion energy (the energy required for the production and processing of energy fuels), feed stock energy (the energy of the fuel bearing materials that are consumed as materials rather than as fuels), transportation energy involved (the energy associated with fuels consumed directly by the transport operations) and process energy (energy used for any/all processes that extract, transform, fabricate or otherwise effect changes in a material or product).37 In these energy values, the contribution to cumulative energy from the process energy varies between 17 and 50%. In contrast to plastics from petroleum, the total energy for biomaterials is equal to the process energy as it does not hold any feedstock energy. Within the commodity plastic category, polystyrene is a highly energy intensive material. There are few LCA studies available on polyolefins, but mostly, they are compared against biobased material for packaging applications.49–54, 57, 58The biobased materials that compete with polyolefins are thermoplastics starch (TPS), polyhydroxybutyrate and polyhydroxyalkanoate (PHA). The key findings when compared with TPS are reported below:57, 58
the cradle to grave analysis of LDPE and thermoplastic starch indicates that TPS is environmentally better in many of the impact categories except eutrophication of water
replacing PE with TPS (and its blend) could potentially save 28–55 GJ ton−1 of energy and 1·1–3·9 tons of CO2
as liners for compost bins, biobased and biodegradable resin Master-Bi (blend of thermoplastic starch and polycaprolactone) is claimed to perform better in comparison with PE liners in environmental impact categories, such as energy resources, greenhouse gas emissions, summer smog, air and water toxicity air and in heavy metal pollution, although it has a greater environmental impact on salination and decomposition waste.
Polyhydroxybutyrate is conventionally used in packaging and biomedical applications, and it is found to give enhanced material properties when filled with additives. The energy consumption of poly(3-hydroxybutyrate) (PHB) production was estimated to be 573 MJ kg−1, and it is expected that optimisation may decrease this to 66·1 MJ kg−1.52 The process simulation model reported by Harding et al.51reveals that PHB manufacturing can be reduced to 44·1 MJ kg−1. Poly(3-hydroxybutyrate) is found to perform well environmentally in electrical applications compared with styrenics. However, environmental credentials were better for PP glass fibre composites in automotive applications,51 which may be attributed to the low modulus and high density of PHB composite. Polyhydroxyalkanoate is an ecofriendly material manufactured through bioprocessing. Polyhydroxyalkanoate has an elastic stiffness of ∼3 GPa with a high melting 1temperature and crystallinity, which is comparable with PP and HDPE.59 It was commercialised in 1990s with a process based on the fermentation of corn sugars.60 However, the process was found to have energy requirement of ∼90 MJ kg−1.61, 62 It is now feasible to obtain PHA as a coproduct in biorefinery processes, and its LCA indicates that the total energy intensity is ∼44 MJ kg−1.
The implied benefits of biodegradability and less energy intensiveness suggest the high potential of bioproducts in replacing existing petroleum based commodity plastics.49 Quoted energy values are to be used with caution since these numbers arise from simulation software that balances mass and energy rather than manufacturing sites. Incineration has been assumed as end of service life scenario in comparing between PHB with styrenics and PP–GF. However, positive environmental credits may alternatively be attained by composting where CO2 would be fixed by the crops and enter the carbon cycle.52
Few LCA studies have reported the effect of nanoreinforcements on polyolefins.38–41 A minor change in impact can be expected by comparing nanofilled and conventional products since a very low filler loading can bring significant changes in functional properties. Lloyd and Lave39 have initially studied the environmental implications of using montmorillonite clay–PP composites in a light duty vehicle using an economic input–output approach. In an upper bound estimation, the results indicate that reinforcement of PP with montmorillonite clay can significantly reduce toxicity and CO2 emissions. However, the study does not use a life cycle inventory obtained through actual manufacturing processes. In a packaging film application, PP was found to meet the required oxygen transmission rate at 3% nanofiller loading. However, the environmental impacts were estimated at a loading of 5% in order to meet the required mechanical properties specification. It has been estimated that there cannot be significant environmental advantages to using nanoscale fillers in packaging and automotive applications. However, a significant reduction in CO2 emission and fossil fuel consumption was reported in agricultural film applications owing to the reduced consumption of polyolefin matrix material when reinforced with nanofillers.
Carbon nanofibres (CNFs) are a new class of reinforcements for plastics with a very high estimated tensile strength of 12 GPa and Young's modulus of 600 GPa.63 These materials are stiffer than steel and are believed to be a potential reinforcement for polyolefins. Significant property improvements were obtained with an increase of 150% in the stiffness of reinforced polyolefins.64, 65 In addition to enhancing mechanical properties, CNFs are highly conductive and may also significantly increase the conductive properties of reinforced polymers. Life cycle impacts were estimated by Khanna and co-workers41 to predict the environmental burden associated with the manufacturing of CNFs. The results indicated that the energy consumption of these materials can vary between 650 and 1807 MJ kg−1. The LCA study of CNF based PP composites revealed that these composites can be 1·2–12 times more energy intensive than steel. However, the inclusion of these materials in the automotive applications could result in an energy saving of 18 GJ over the lifetime of a midsize car, and CNF–GF–PP hybrid composites were expected to save 65 GJ.40 It can be concluded that the use of nanoreinforcements can have clear environmental benefits if a significant material reduction and weight saving can be obtained in the manufacturing and use phase respectively, although further research should be undertaken to study the toxicity of nanoparticles.
A few LCA studies42, 44–47, 55, 56that have been reported on polyolefins with natural fibre reinforcements have included China reed, curauá and flax fibres. Most of the LCA studies on natural fibre reinforcements considered automotive applications. The cradle to gate analysis of curauá fibre reinforced automotive components with glass fibre reinforced automotive body components with an equivalent strength indicates that reinforcement with curauá fibres can slightly reduce environmental impacts in comparison with the use of glass fibre reinforcement in automotive applications. However, the use of curauá fibres has a deleterious effect on eutrophication, which arises due to the fibre cultivation operation. Similar results were also obtained by Xu et al.42 Nicollier and co-workers45 conducted LCA on pallets made from glass fibre reinforced PP and China reed fibre reinforced PP with equivalent service lifetimes. The natural fibre reinforced PP pallets weighed 11·8 kg, whereas the glass fibre reinforced PP pallets weighed 15 kg. This difference in mass made a significant difference to a comparison of the use phase of these materials and significantly reduced the overall environmental impacts of natural fibre reinforced pallet. Dissanayake and co-worker55, 56 conducted cradle to gate LCA on flax fibre manufacturing and compared their analysis with findings for glass fibre manufacture. The analysis included fibre growth stages such as crop production, water retting, scutching, hackling and spinning. The study concluded that the energy intensity of flax fibre (sliver) was 59·3 GJ t−1, comparable with the energy intensity of glass fibre mat (54·7 GJ t−1). The spinning operation of flax is a highly intensive process that increases the total energy intensity to 85·4 GJ t−1, whereas continuous glass fibre has the energy intensity of 26 GJ t−1.
Conclusions
The number of published papers on the LCA of polyolefins is relatively large. Important conclusions that may be drawn from the studies considered in this review are summarised as follows.
Recycled plastics seem to be a highly preferred candidate to replace petroleum based materials. However, better environmental credentials can be obtained if it replaces virgin plastics rather than wooden or concrete. In addition, the level of substitution also plays a vital role in determining its environmental sustainability. Many LCA studies did not include plastic waste collection. The present study indicated that the collection of 1 t of plastics waste could emit 600–4000 kg of CO2. Even though significant environmental benefits could be obtained from recycling, there are serious limitations that may reduce the rate of recycling. These include the difficulty and high cost of recovery, contamination, the low cost of virgin plastics and the poor mechanical properties of recycled materials. Energy recovery by waste incineration is the second best option and may yield significant benefits, where energy is imported rather than generated.
Polyolefin manufacturing has attained a high level of technological optimisation, which has resulted in low energy consumption processes. In addition to better polymer properties, these factors pose a tough challenge to biobased materials. The existing LCA studies have demonstrated that biobased materials are a suitable and sustainable alternative to polyolefins. The cost of biobased materials also plays an important role in replacing polyolefins on the market. The biobased materials have been found environmentally attractive since they are found to reduce many of the environmental impact categories, though not all. Some researchers66 have also proposed the inclusion of impact categories such as land occupation, land transformation and loss of soil quality in order to make realistic comparisons with petroleum based products. However, large scale manufacturing and optimised unit processes combined with a deeper understanding of the physics of these materials are expected to pave the way to commercial success.52
The PE/PP nanocomposites are an emerging technology, though the nanoreinforcements are more highly energy intensive materials than currently existing reinforcements. The nanoproducts have been found to have slight environmental advantages over conventional materials. However, there is a significant degree of huge uncertainty in the analysed data since information for the energy consumption was obtained from a pilot plant. Large capacity manufacturing plant and process optimisation may reduce the energy consumption, which could make nanoadditives more environmentally friendly.
Natural fibre composites have rapidly become promising materials for automotive applications. The lightweight of natural fibre reinforced composites is a favourable property that may promote these materials as ecofriendly. It can be concluded from these studies that around 80–90% of all environmental impacts arise during the transport phase of an automobile, specifically through fuel extraction and combustion. Ecoinvent indicates67that combustion of 1 kg of diesel could emit 3·12 kg of CO2 in direct process emissions and 0·4 kg CO2 from upstream processes. This makes the ‘transport phase’ a critical and sensitive phase in automotive LCA and outweighs both manufacturing and end of life phases.
Specific stiffness, strength, calorific value of natural fibres, carbon storage potential during the fibre growth phase and impact of eutrophication and energy use during fibre cultivation determine the environmental suitability of natural fibres over conventional fibre reinforcements.
Footnotes
Acknowledgements
The authors would like to thank Qatar Science and Technology Park (QSTP) for providing funding for this project.
Appendix
This paper is part of a special issue on Deformation and fracture of polymers and their composites