
Abstract
Processing parameters such as temperature, rotor speed and time of melt blending have been optimised using design of experiments as per the Taguchi methodology at a blend ratio of low density polyethylene (LDPE)/polydimethyl siloxane (PDMS) of 50∶50. Mechanical properties such as tensile strength, impact strength, hardness and phase morphology of the blends have been evaluated at different temperatures, rotor speeds and times for assessing the optimisation of the processing parameters. The formation of a finer dispersed phase morphology in case of the LD 508 and LD 509 blend mix is an indication of good dispersion and narrow size distribution of the PDMS rubber in the LDPE matrix. It has been found that the LD 509 mix gives a better dispersion of silicone rubber as the dispersed phase in the continuous LDPE matrix. Analysis of variance on the performance characteristic has been analysed using signal to noise ratios and mean response data.
Introduction
Polymer blending is an efficient and economical route for developing new polymeric materials to meet specific end use properties. Thermoplastic elastomers obtained by melt processing thermoplastics with rubbers offer a unique combination of properties, which are not obtained from a single polymer either plastic or rubber. The ease in processing combined with the flexibility in compound design results in novel polymeric materials at less expense of energy and time, which are quite often referred to as ‘cost effective product mixes’.1 The plastic and rubber are blended to improve the physical, thermal and mechanical properties of the product by developing a finer morphology specific to the processing conditions adapted.2–4 Design of experiments (DOE) is an important tool for modelling and analysing multidimensional experiments in order to reduce the number of such trials to achieve optimum properties with minimum expense of time and energy. This has been very well achieved by applying an innovative standard orthogonal array for different factors and levels in the form of designated tables, as developed by Taguchi. Taguchi's method of analysis provides an orthogonal array strategy that signifies special matrixes used for fractional factorial designs that allow the effects of several parameters to be determined efficiently. This is called orthogonal array testing strategy discovered by Bendell.5 This is a systematic, statistical way of testing pairwise interactions. Using these orthogonal arrays, the numbers of experiments to be studied are drastically reduced. Above all, the conclusions drawn from small scale experiments are valid over the entire experimental range spanned by the control factors and their settings.6, 7 By adopting this technique, the noise factor, i.e. the product, and the process variations are reduced. Since orthogonal array and their experiments are designed deterministically, it can suit any process or product manufacturing steps. However, Taguchi simplified its use by providing tabulated sets of orthogonal arrays in the form of tables, such as L9, L16, etc.8 Taguchi has devised a simple solution to overcome this problem by mathematically modelling the experiments and filtering the factors and levels to minimise the number of experiments that may be carried out for optimising the process conditions and product variations. Incidentally, after the introduction of this method in the USA in 1980, the phrase Taguchi methodology was upheld by the American Supplier Institute. This term encompasses all work due to Taguchi, including quality engineering, such as parameter design, tolerance design, online quality control, loss function and signal to noise S/N ratio. Taguchi proposed this technique for product design, but for all practical purposes, it was made applicable to all the other systems, including polymer blends and composites.9, 10 In the orthogonal array, the columns are mutually orthogonal, and for any pair of columns, all combinations of factors as well as levels occur in equal numbers. This directly provides the number of experiments to be carried out with the designated parameters. Subsequently, factors are represented by the columns in the array and give the maximum number of variables that can be handled in this array. Table 1 provides four parameters A, B, C and D, each at three levels with nine different combinations. This is called L9 orthogonal array, with nine rows indicating the prototypes of experiments. Specific test characteristics for each experimental evaluation are identified in the associated rows of the table. Thus, L9 means nine experiments to be carried out to study four variables at three different levels. Ultimately, this design reduces 81 (34) experimental evaluations to only nine. Similarly, with L27 array, 13 parameters can be studied at three different levels by running only 27 experiments instead of 1 594 323 (i.e. 313). Before the orthogonal array, system design is framed under an initial set of nominal conditions for the experiment to be carried out. After designing the system, parameter design is carried out by selecting the optimum levels for controllable system parameters.
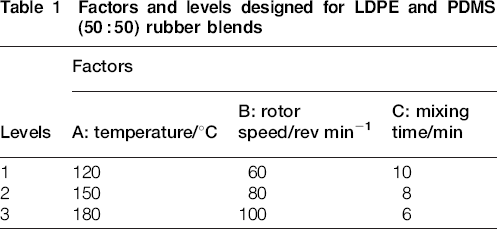
Factors and levels designed for LDPE and PDMS (50∶50) rubber blends
A number of researchers have earlier used the Taguchi methodology as an effective tool for optimising the process parameters with minimum number of experiments.11–19 This paper describes a systematic approach towards establishing a set of optimised blending conditions for the low density polyethylene (LDPE) and polydimethyl siloxane (PDMS) rubber system through physicomechanical property evaluation and dispersed phase morphology by applying the Taguchi approach. For convenience, a 50∶50 (LDPE/PDMS) rubber blend has been chosen, thus reducing the number of experiments to nine only. The schematic representation of the analysis of variance (ANOVA) model is presented in Fig. 1. Tensile strength, impact strength and hardness of the blends under different processing conditions obtained as per the experiments based on the L9 table as well as the S/N ratio are presented. Ultimately, ANOVA was used to identify the most influential process parameters for the LDPE and PDMS rubber blend in the proportions of 50∶50. X-ray diffraction (XRD) study and phase morphology of the blends prepared as per L9 table are evaluated in order to investigate the variation of processing conditions on the blend characteristics. This epitomises the processing parameters for blending LDPE and PDMS rubber as optimum in order to achieve the best balance in tensile strength and tensile impact strength properties representative of all the other mechanical properties.
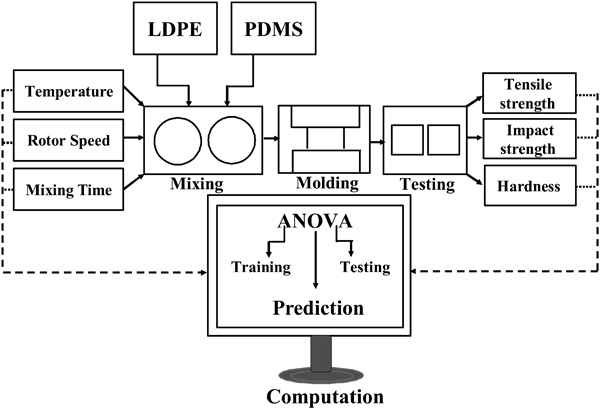
Schematic representation of work
Experimental
Materials used
Low density polyethylene (Indothene 1020 FA 20, having a density of 0·920 g cm−3 and melt flow index of 2·0 g/10 min supplied by Reliance Industries Ltd, Gujarat, India) and PDMS rubber (Silastic WC-50, having a specific gravity of 1·15 procured from Dow Corning Inc., USA) were used in this study. The solvent toluene was used as procured from Merck Specialities Private Ltd, India.
Preparation of blends
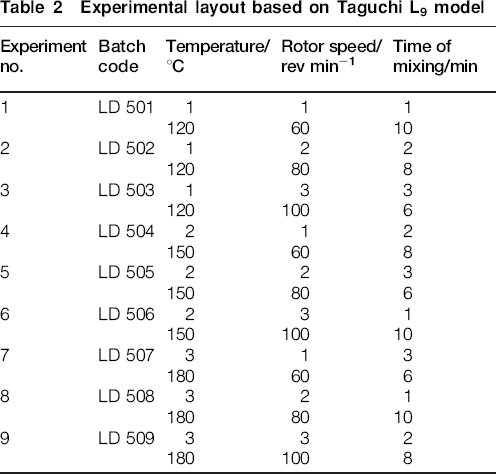
The LDPE and PDMS rubber were melt blended in an internal mixer (model PLE-330; Brabender Plasticorder) fitted with cam type rotors under different processing conditions, as exemplified in Table 2 on the basis of Taguchi's L9 table. The chamber capacity of the mixer was 350 cm3, and the batch volume was calculated by selecting the fill factor as 0·8 LDPE was first loaded into the chamber and allowed to melt in the mixer for 2 min, and then PDMS rubber was added and melt blended for the time and the temperature as well as rotor speed specified in Table 2. After blending, the molten mass was quenched on a cold two-roll mixing mill at a nip gap of 1–2 mm and sheeted out.
Experimental layout based on Taguchi L9 model
Preparation of samples
The sheet obtained from the two-roll mill was compression moulded in a hydraulic press (Moore Presses, George E. Moore & Sons Birmingham Ltd, UK) at their respective temperature of mixing for 2 min, under a pressure of 5 MPa, to form tensile sheets of ∼2 mm thick. The mould was allowed to cool under pressure to the ambient temperature before ejecting the sheets from the mould cavity. Dumb bell specimens were punched out of the sheets using standard cutting die.
Mechanical properties
The tensile properties of the blends were determined as per ASTM D 412 using a Hounsfield H25KS universal testing machine at a crosshead speed of 50 mm min−1. The hardness of the samples was determined using a Shore A Durometer hardness tester, as per ASTM D 2240. The impact strength was determined by a tensile impact tester, CEAST type 6545/000, using a hammer of 7·5 kg as per DIN 53448. Testing of all the samples was carried out at ambient temperature.
Design of experiments and S/N ratio
The experiments have been designed by varying the process parameters, such as temperature, rotor speed and mixing time, using the L9 orthogonal array and S/N ratio of DOE for the blend of LDPE/PDMS rubber (50∶50). The results derived from the statistical analysis of experimental data have been analysed using the orthogonal array testing strategy. Three factors and three levels have been chosen. The factors that control the blend characteristics and their levels are presented in Table 1. The three levels for each factor are designated as 1, 2 and 3. The blends have been designated as LD 50, indicating the 50∶50 blend ratios of LDPE/PDMS rubber, and the number of experiments has been indicated as LD 501 to LD 509 for all the nine experiments.
Two major tools are used in this robust design:20, 21
signal to noise ratio, which assesses the quality by emphasising the variations
orthogonal arrays, which accommodate several design factors simultaneously.
Depending on the number of factors, the levels used and the interactions present between them, one can choose the particular array to suit the system.
The S/N ratio may be divided into three categories, as given below:21
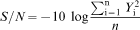
nominal (the best characteristic), which can be calculated from equation (1)
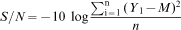
smaller (the better characteristics), which can be calculated using equation (2)
larger (the better characteristics), which can be calculated using equation (3)
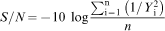
where M is the average of the observed data, n is the number of observations and Y is the observed data. The higher the S/N ratio, the better the results. One of the methods for analysing data in the process of optimisation is to use the ANOVA table data21 for quick results. The ANOVA data generated are suitable for engineers and industrial practitioners as these are utilised even with a little information. During the data analysis, the S/N ratio is used to control the response as well as to reduce the variability of response. The use of ANOVA gives a clear evidence of degree of variations and statistical quality control associated with the parameters and their levels. Accordingly, it may so happen that the dispersed morphology is finer, and in order to achieve this, the best fit S/N equation will be used.
Fourier transform IR attenuated total reflectance spectroscopy
Thin sheets (0·5 mm) of the blends were prepared in a compression moulding press between two aluminium foils for Fourier transform IR attenuated total reflectance spectroscopy analysis using Nicolet Nexus, Madison, WI, USA. Spectra were recorded at room temperature and collected over the range of 4000–400 cm−1.
Wide angle XRD
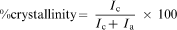
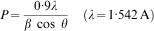
A Philips (PW-1710) X-ray diffractometer was used to investigate the crystalline structure of the blends. Wide angle XRD studies were carried out with monochromatised Cu Kα radiation at a wavelength of λ = 1·542 Å, and the diffraction patterns were recorded in the angular range of goniometer angle (2θ = ) 7–60° at a scanning rate of 3° min−1. The area under the crystalline and amorphous regions was determined in arbitrary units and converted into respective intensities after normalisation. Per cent crystallinity22 was calculated from the amorphous and crystalline intensities using the following equation


Morphological studies
The morphology of the blends was studied by examining the etched surface of the 50∶50 (LDPE/PDMS) blends under a scanning electron microscope (SEM; JEOL JSM-5800). The samples are broken under liquid N2, and the broken surfaces were subjected to solvent etching in toluene for 48 h at 35°C to drive out the PDMS rubber phase. The solvent extracted samples were dried in a desiccator for 24 h, and subsequently, the etched surfaces were sputter coated with gold for examination under the SEM at 0° tilt angle. The microphotographs were taken within a magnification of ×5000. The photomicrographs were analysed using image processing software to measure the number average diameter Dn, weight average diameter Dw, volume average diameter Dv, polydispersity of the dispersed domains (PD) and interdomain distance (ID) in the matrix dispersed morphology using equations (8)–(12) respectively14–20


Results and discussion
Mechanical properties
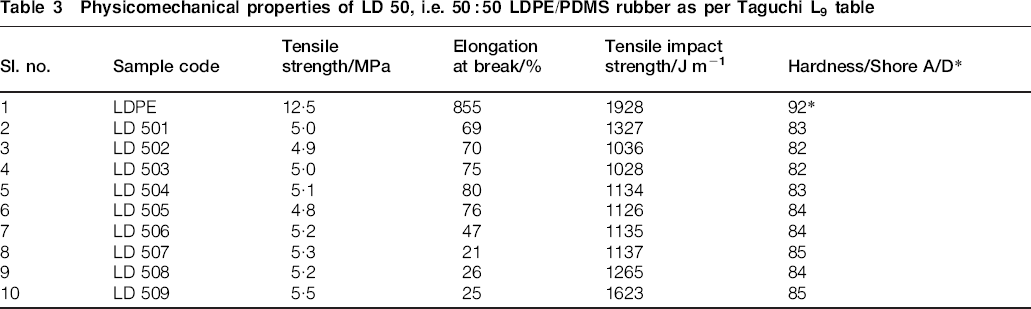
The physicomechanical properties of the blends are shown in Table 3. The LDPE exhibits a tensile strength of 12·5 MPa. As soon as PDMS rubber is introduced into LDPE, the tensile strength is reduced and reached a minimum of 5·0 MPa for 50∶50 LDPE/PDMS rubber. Nine blends were designed by varying the mixing parameters, i.e. temperature, time and rotor speed, at three levels each. These blends are designated from LD 501 to LD 509. It is interesting to observe that, as the mixing temperature rises, an increase in tensile strength is observed for (50∶50) LDPE and PDMS rubber blends. In the case of blends LD 507, LD 508 and LD 509, where the mixing temperature is maintained at 180°C, relatively higher tensile strength is observed. LD 509 is found to exhibit the highest tensile strength of 5·5 MPa among all the blends studied. Since there is a very good relation between the structure and the properties, and the structure predominantly depends on the processing parameters, it is not redundant at this stage to study the effect of processing parameters on the structure, hence on the physicomechanical properties, of the blends. The tensile impact strength of the blends decreases with the incorporation of PDMS rubber into LDPE, as expected due to the lower modulus of PDMS rubber. However, the tensile impact strengths of the LDPE and PDMS rubber blends (50∶50) marginally increase with an increase in the temperature of blending and rotor speed, as shown in Table 3. A maximum impact strength of 1923 J m−1 is observed for LD 509. The decreases in tensile strength and tensile impact strength of the LDPE–PDMS blend have been explained as due to the gross immiscibility between the two blend components and also due to the lower modulus of PDMS rubber. In addition, a marginal increase in tensile strength and tensile impact strength at higher mixing temperatures may be presumed to be due to the possible interaction between LDPE and PDMS rubber through the tertiary carbon atom of LDPE and vinyl silicone groups of PDMS rubber, as established earlier.23, 24 This has been further confirmed from the increase in tensile strength and tensile impact strength of LD 509 blend, where the mixing temperature was 180°C and the rotor speed was 100 rev min−1. The increase in temperature and shear is expected to lead to better dispersion homogenisation of PDMS in the LDPE matrix, facilitating finer phase morphology and smaller domain size of PDMS rubber. These results in a matrix dispersed type of morphology25 as compared to those mixed at lower temperatures. At this high temperature and high shear rate, LDPE and PDMS rubber blends, in spite of their wide difference in surface energies and dissimilarity in structures, are able to achieve microdispersibility due to the locked in morphology. The elongation at break of the blends is found to reduce drastically from 425% for neat LDPE to a minimum of 25% in case of LD 509. This drastic reduction may be due to the introduction of silicone rubber into the LDPE matrix, which severs the continuity. It is also possible that at higher temperature and under higher shear rate, silicone rubber may be grafted onto the LDPE chains through the mechanochemical reaction observed in case of EMA–silicone rubber blend earlier and subsequently reported for LDPE–PDMS blend.24, 25 This results in the formation of direct C–C bonds between the two polymers at the interface. To confirm these, IR spectral measurements have been carried out for the blends and reported in the subsequent section. Thus, LD 507, LD 508 and LD 509 exhibit still very low values of elongation at break as compared to those mixed at lower temperatures. The hardness of the blends mixed under different processing conditions does not show any significant variation, as depicted in Table 3. From the tensile strength and tensile impact strength results, it can be inferred that LD 509 exhibits the best combination of physicomechanical properties.
Physicomechanical properties of LD 50, i.e. 50∶50 LDPE/PDMS rubber as per Taguchi L9 table
Signal to noise ratio
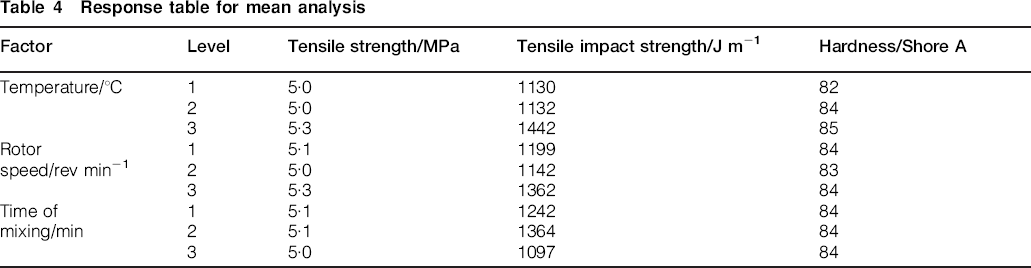
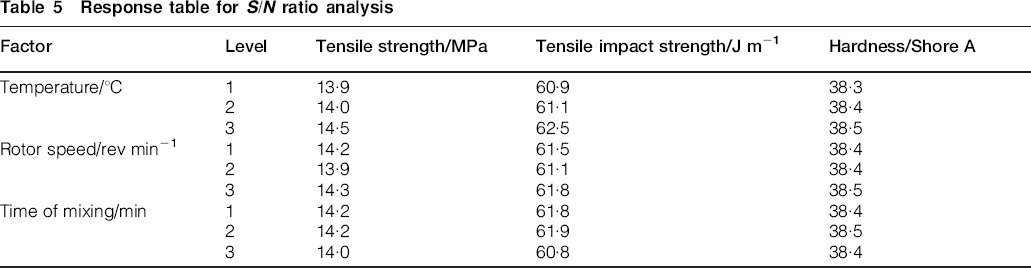
Equation (3) for S/N ratio has been chosen for quantifying the tensile strength (MPa), tensile impact strength (J m−1) and hardness (Shore A) of the blends processed under different processing conditions as per L9 table of the Taguchi methodology. Table 4 represents the response table for mean analysis, whereas Table 5 provides the response for the S/N ratio at different levels for the controlled factors. The response for the S/N ratios at three control factors and at each level is shown in Fig. 2, from where the levels corresponding to the highest S/N ratio are chosen for each parameter representing one optimum condition. Here, the optimum conditions corresponding to the highest tensile strength (MPa), tensile impact strength (J m−1) and hardness are chosen. It is clear from Fig. 2 that the optimum levels for temperature, rotor speed and time are 180°C, 100 rev min−1 and 8 min.
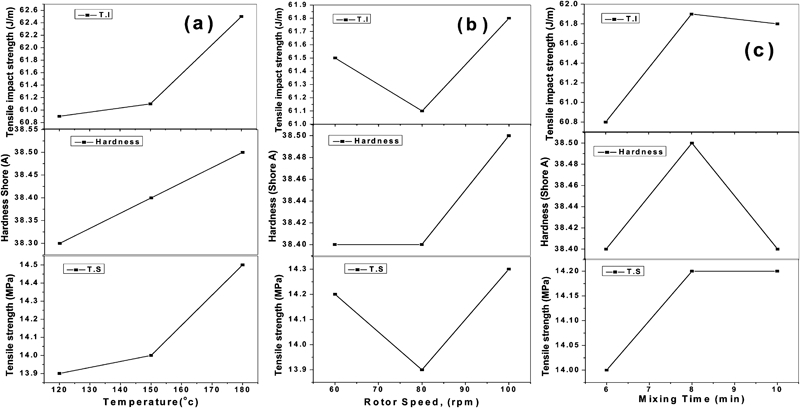
Level average response parameters for a temperature, b rotor speed and c mixing time by S/N ratios
Response table for mean analysis
Response table for S/N ratio analysis
ANOVA results
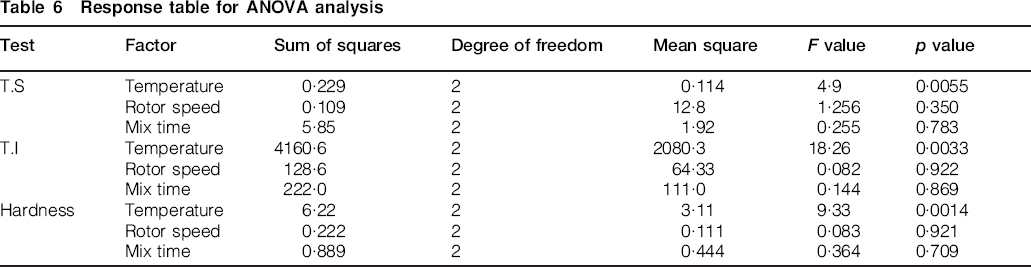
It is found that the result presented in Table 4 has error to the extent of ±1 in all the tests. Hence, the next step in the analysis data is to estimate the optimum level of each control factor (S/N ratio) and to perform ANOVA. The ANOVA is conducted, and the results are shown in Table 6. In the table, DF is the number of degrees of freedom, SS is the sum of squares of source, V is the variance of source, F is the variance ratio and P is the per cent contribution of source. The F value is calculated from the mean square divided by a residual mean square. This test compares the model variance with the residual variance. If the variances are close to each other, then the ratio will be close to 1, and it is less likely that any of the factors have a significant effect on the response. As for the ‘p value’, if the p value is very small (<0·05), then the terms in the model will have a significant effect on the response.26 Similarly, the ‘F value’ on any individual factor term is calculated from the mean square divided by the residual mean square. It is a test that compares the term variance with the residual variance. If the variances are close to each other, then the ratio will be close to 1, and it is less likely that the term has a significant effect on the response. Furthermore, if the p value of any term is very small (<0·05), then the individual term has a significant effect on the response. Table 6 shows the ANOVA results of the response table for ANOVA analysis. It shows that the F value of 4·9 with a p value of 0·0055 implies that the selected tensile strength is significant, and there is only 0·55% chance that the F value could occur due to noise. The p value for tensile impact strength is 0·0033, which is <0·05, indicating that the tensile strength and tensile impact strength are both significant.
Response table for ANOVA analysis
Fourier transform IR attenuated total reflectance spectroscopy
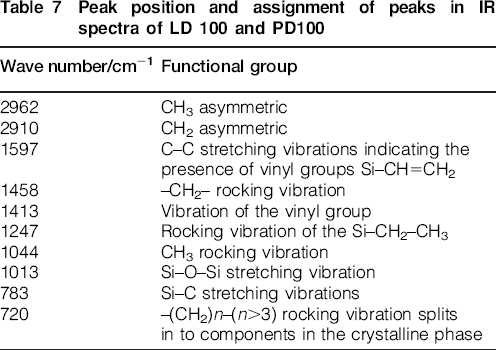
Figure 3 shows the IR spectra of neat LDPE and neat PDMS rubber. Neat LDPE shows –CH2– rocking vibration at 1458 cm−1 and CH3 rocking vibration at 1044 cm−1 as evidence for the minor chain branching of LDPE. The IR spectrum of PDMS rubber shows peaks at 1247 and 1013 cm−1 considered to be due to the rocking vibration of the Si–CH2–CH3 and Si–O–Si stretching vibrations respectively. The peak at 1597 cm−1 is due to C–C stretching vibrations, indicating the presence of vinyl groups Si–CH = CH2 attached to the silicone atom, and the peak at 1413 cm−1 is due to the in-plane vibration of the vinyl group. The multiple bands observed around 860–760 cm−1 are due to the methyl rocking and Si–C stretching vibrations of silicone rubber.26 The peak positions and their assignment are depicted in Table 7. Figure 4 shows the IR spectra of the blends of LDPE and PDMS rubber (50∶50) at different temperatures of 120, 150 and 180°C by varying rotor speeds from 60 to 80 to 100 rev min−1, as per Taguchi's L9 table. Figure 4 shows that the spectra do not exhibit any extra peak except those of LDPE and PDMS rubber itself, implying that there is no specific interaction or chemical reaction between the blend constituents. Similarly, the IR spectra of Fig. 4c and g show a sharp peak at 1010 cm−1 due to Si–O–Si stretching vibration, and the peak at 795 cm−1 is due to the Si–C stretching vibrations of silicone rubber at higher rotor speed and higher processing temperature. It is obvious from these two traces that there is no change in chemical structure of the individual components during processing under high shear and temperature conditions. Finally, the IR spectra at higher temperature and rotor speed do not exhibit any additional peak expect those for LDPE and PDMS shown in Fig. 3. This provides sample evidence for the absence of any specific interaction or chemical reaction between the two. In addition, there are no characteristic peaks indicating the degradation of LDPE at higher processing temperature and shear.
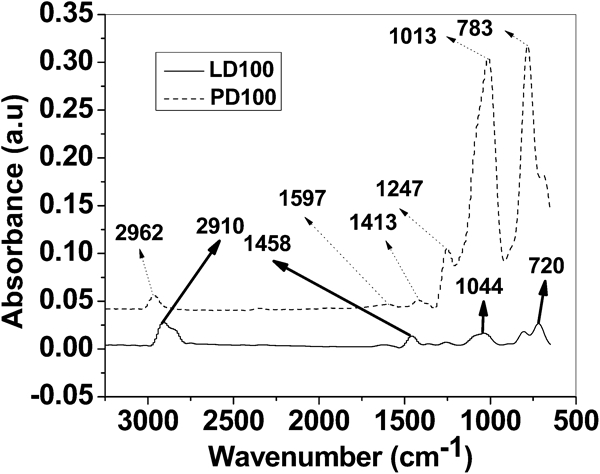
Infrared spectrogram of neat LDPE and PDMS
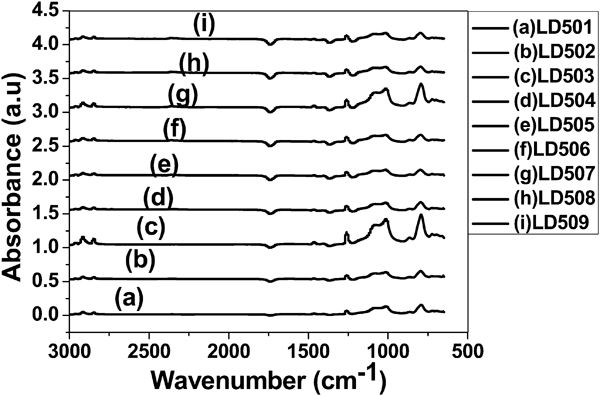
Infrared spectrogram of (a) LD 501, (b) LD 502, (c) LD 503, (d) LD 504, (e) LD 505, (f) LD 506, (g) LD 507, (h) LD 508 and (i) LD 509
Peak position and assignment of peaks in IR spectra of LD 100 and PD100
Wide angle XRD study
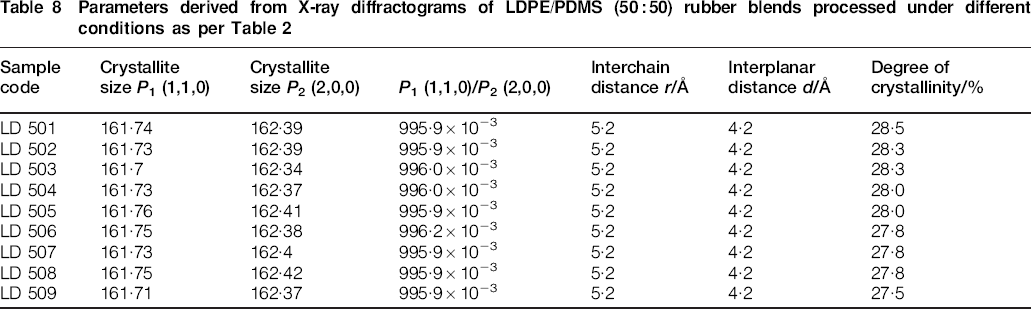
X-ray diffractograms of LDPE–PDMS (50∶50) rubber blends processed at different temperatures, rotor speeds and mixing times as per Taguchi's L9 table are shown in Fig. 5. The parameters calculated from the diffractograms are presented in Table 8. It is observed that the degree of crystallinity reduces marginally on increasing the mixing temperature and also on increasing the rotor speed from 28·5% for LD 501 to 27·5% for LD 509. This may attributed to the complete homogeneous dispersion of PDMS rubber in the LDPE matrix because of the higher mechanical shear forces under the influence of higher temperature and high shear. This further supports the increase in mechanical strength properties due to the mechanical interlocking of finer domains of PDMS in the LDPE matrix, leading to pseudocompatibility between LDPE and PDMS rubber blends at higher temperature. The sharp peaks at 21·4 2θ and 23·7 2θ represent the two prominent (1,1,0) and (2,0,0) planes of LDPE. The crystal sizes along the planes P1 (1,1,0) and P2 (2,0,0) do not change as one more from LD 501 to LD 509. Similarly, the size anisotropy remains the same. However, the degree of crystallinity XC reduces marginally from LD 501 to LD 509, as explained above. It is an evidence of greater dispersibility of the matrixes at higher temperatures and higher rotor speeds. In addition, the interplanar distance and interchain distance does not change. The size anisotropy P110/P200 is almost unaffected, with little variations, at higher temperature and rotor speeds. This may be attributed to fact that crystallite sizes or lamellar thickness remains nearly same with an increase in temperature and rotor speed in the blend.
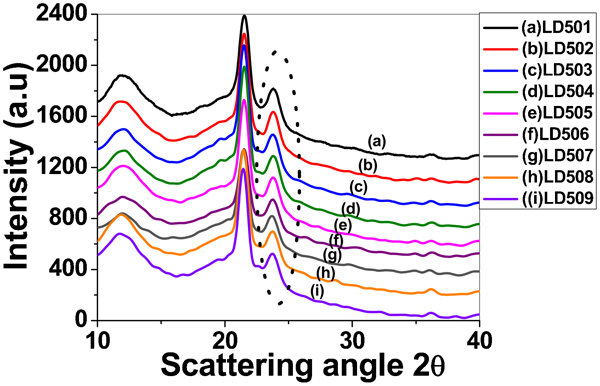
X-ray diffractogram scans of (a) LD 501, (b) LD 502, (c) LD 503, (d) LD 504, (e) LD 505, (f) LD 506, (g) LD 507, (h) LD 508 and (i) LD 509
Parameters derived from X-ray diffractograms of LDPE/PDMS (50∶50) rubber blends processed under different conditions as per Table 2
Phase morphology
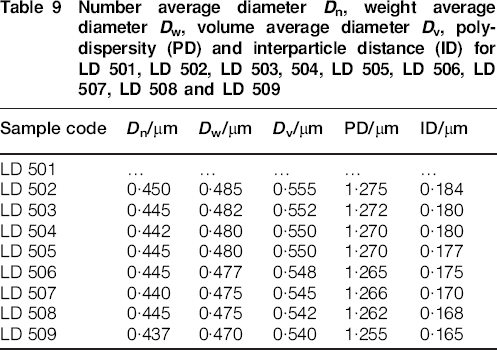
In order to understand the effect of processing conditions on the dispersion of one phase in the other in the blends of LDPE and PDMS rubber (50∶50), the phase morphology was undertaken in an SEM. Figure 6 shows the SEM images of the nine blend systems prepared under various processing conditions as per Taguchi's L9 table. The number average diameter, weight average diameter, volume average diameter, polydispersity and interparticle distance of the dispersed particles in the blend matrix are shown in Table 9. It is evident from the SEM images that the blends of 50∶50 LDPE/PDMS rubber processed under different temperatures, rotor speeds and mixing times exhibit a two-phase morphology because it is an immiscible system. Figure 6a and b shows a co-continuous matrix with PDMS domains scattered in the LDPE matrix that co-exist with PDMS rubber domains. Figure 6c shows significant improvement in dispersion of PDMS rubber in the LDPE matrix due to increased rotor speed from 80 to 100 rev min−1. It is also observed that the distribution of the PDMS domains is uniform, and the matrix has a spongy appearance because of the removal of PDMS domains. In addition, there is no continuity observed in the dispersed phase. This development may be due to the intensive shearing action leading to the breakage of the elongated domains and the relaxation of the dispersed elastic phase. Figure 6d shows a significant improvement in co-continuity leading to a semicontinuous matrix due to an increase in temperature from 120 to 150°C. Similarly, Fig. 6e and f shows the homogeneous matrix with regular domains of LDPE, and there is no change in average diameter Dn, weight average diameter Dw and volume average diameter Dv. It is evident from Fig. 6g that increasing the temperature from 150 to 180°C, the number average diameter Dn and weight average diameter Dw decreases as compared with that observed for lower temperature. Similarly, Fig. 6h shows the elongated structures, and the frequency of occurrence in the matrix show a semicontinuous matrix. The dispersed PDMS rubber phase gets elongated during mixing due to the extensional flow occurring due to the higher shear force imposed on it. Finally, Fig. 6i shows spherical domains from macro- to micrometre size of the etched PDMS rubber in the LDPE matrix. This higher dispersion and mechanical interlocking are possible due to the viscosities of both blend components coming close to each other (η1 = η2) at a higher temperature of 180°C and a shear rate of 100 rev min−1. Increasing the temperature from 120 to 180°C decreases the average diameter of the dispersed PDMS domains from 0·45 to 0·43 μm, as shown in Fig. 6.
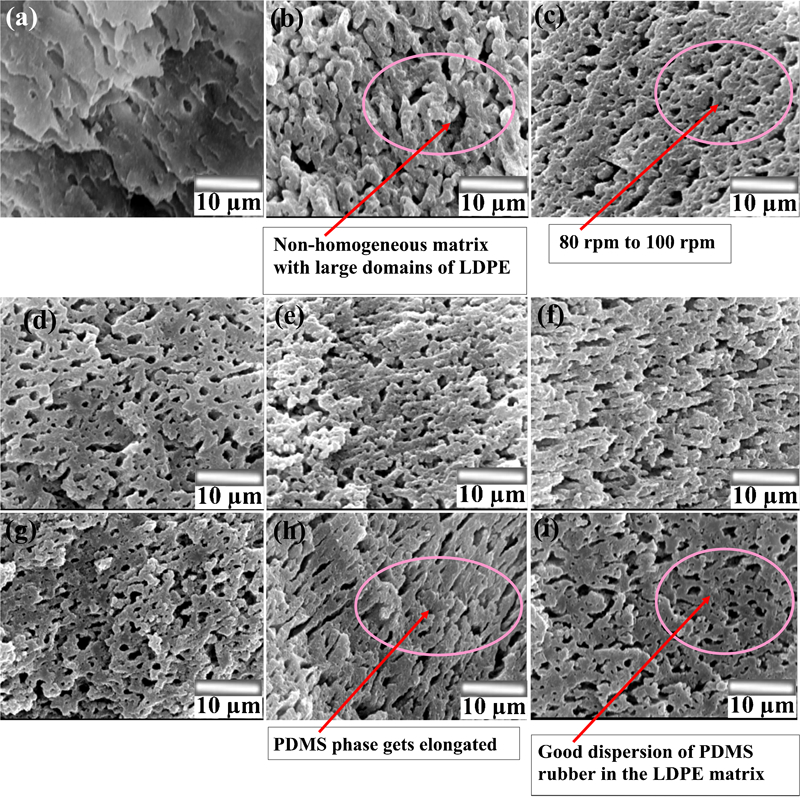
Photomicrographs of (a) LD 501, (b) LD 502, (c) LD 503, (d) LD 504, (e) LD 505, (f) LD 506, (g) LD 507, (h) LD 508 and (i) LD 509
Number average diameter Dn, weight average diameter Dw, volume average diameter Dv, polydispersity (PD) and interparticle distance (ID) for LD 501, LD 502, LD 503, 504, LD 505, LD 506, LD 507, LD 508 and LD 509
Conclusions
The Taguchi method was used as an effective tool for optimising the process conditions of blending LDPE and PDMS. The orthogonal array technique was utilised successfully to set individual parameters with minimum number of experiments using Taguchi's L9 table. The optimum processing condition for carrying out the melt blending of LDPE–PDMS rubber is set at 180°C, 100 rev min−1 and 8 min for a fixed blend ratio of 50∶50. The mechanical strength properties, morphology and crystal structure were considered for optimising the process parameter levels and factors. The LD 509 blend has been considered as the optimum for a blend of (50∶50) LDPE/PDMS rubber.
Footnotes
Acknowledgements
The authors would like to thank the Department of Atomic Energy–Broad of Research in Nuclear Studies (DAE-BRNS), Bhaba Atomic Research Centre (BARC) Government of India, Mumbai, India, for funding the project.