
Abstract
The multifunctional behaviour of microcrystalline cellulose (MCC) was tested in emulsion styrene butadiene rubber-silica compounds by studying it as potential reinforcing filler and processing aid. The MCC has been used as silica replacer, and its loading was optimised on the basis of various physicomechanical properties of the experimental compounds. The results show that best performance was achieved at 10% silica substitution. Similar MCC loading was extended to recipes with even higher silica content. At higher silica content, the presence of MCC in mixes had shown reduction in Mooney viscosity, which was favourably used to eliminate one mixing stage but without sacrificing the Mooney viscosity. Peak power consumption during mixing was reduced due to a similar reason. Owing to enhanced plasticity, it was further possible to reduce the aromatic oil content by 3 phr (10·8% as compared to the original oil amount) in the experimental compound to get a Mooney viscosity value equal to control using equal number of mixing stages. Unaged and aged physical properties of the experimental compounds were evaluated and found comparable with the control compound.
Introduction
Cellulose is abundant in nature. Chemically, it is a linear chain polymer with a large number of hydroxyl groups. The chemical structure of cellulose is shown in Fig. 1. The structural unit, anhydroglucopyranose (AGU), contains three hydroxyl groups except its terminal ends.1 The repeating unit is cellobiose having two adjacent AGUs, rotated 180° along the chain axis. One end of the chain has a reducing aldehyde group called the reducing end, and the other end does not contain any reducible group and is called non-reducing end. The degree of polymerisation (DP) is the number of AGUs per cellulose chain and varies with the origin and treatment of its sources. Usually, DP ranges from 300 to 1700 for wood cellulose, from 800 to 10 000 for cotton and bacterial celluloses and from 250 to 500 for regenerated cellulose.2–4
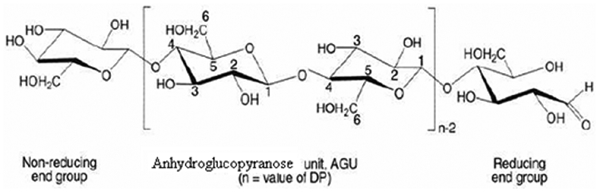
Molecular structure of cellulose
Because of compact structures and strong inter- and intramolecular hydrogen bonding, cellulose is insoluble in water and other commonly used organic solvents. In dry state, it can be used in a wide range of applications, such as composites, netting, coatings, packing, paper, etc., because of its easy biodegradability and natural abundance.1, 5 Native cellulose is semicrystalline; acid hydrolysis removes amorphous regions, yielding crystalline cellulose.6–10 Crystalline cellulose including microcrystalline cellulose (MCC) and nanocrystalline cellulose can thus be derived from native cellulose fibres. Because of high strength and stiffness, its potential was explored by many workers as a reinforcing material in the thermoplastic or rubber matrix.11–13
The MCC has DP <400. Acid hydrolysis breaks the β (1–>4) glycoside bonds and reduce the DP. The MCC is available in two physical forms: powder and colloidal dispersion. Aqueous suspension is spray dried to get MCC powder of average size 20–90 μm. Aqueous dispersion has the colloidal size <0·2 μm.14, 15
The MCC as a reinforcing filler in polymer composites offers several advantages over glass fibres and other inorganic fillers regarding renewability, low energy requirement for production, low cost, low density and high specific strength and modulus.16 There have been some studies on MCC as reinforcing filler in plastic composites and biopolymers17–19 and in rubbers20–23 in the last few years. Haghighat et al., Joseph et al. and Nunes et al. reported the work on cellulose fibre–rubber composites used in hose, ropes, insulation, etc.22–24 Bai had investigated the use of crystalline cellulose as reinforcing filler in SBR-BR based compound.25 However, no work has been reported so far excavating the multifunctional characteristics of MCC in rubber compounds.
The concept of multifunctional additive (MFA) in rubber compounding is extremely important since it reduces raw material cost and sometimes can improve the product performance as well. Our group is actively engaged in the identification and use of various MFAs from naturally occurring green resources. Very recently, we have isolated a resinous mass from the latex of Euphorbia caducifolia Haines of southeast Asia behaving as MFA in natural and halo butyl rubber compounds.
High silica recipes are difficult to mix due to its extremely high viscosity. But replacement of silica causes property deterioration. The aim of this article is to use MCC as silica replacer conceding its multifunctional activity in high silica based emulsion styrene butadiene rubber (E-SBR) compounds without affecting the key physicomechanical properties.
Experimental
Raw materials
SBR1502 and 1712 (37·5% aromatic oil extended) were procured from Kumho Petrochemical Ltd, Korea. The other compounding ingredients used were Silica-VN3 [Insilco India Pvt. Ltd (Evonik Industries), Gajraula, India], powdered MCC (Accel 101, Accent Microcel Industries, Ahmedabad, India), zinc oxide (Zinc-O-India, India), stearic acid (Godrej Soap Limited, India), N339 carbon black (Hi-Tech Carbon, India), silane coupling agent containing 50% carbon black (X50 S, Evonik Degussa GmbH, Wesseling, Germany), PN60 (mixture of fatty acid soaps with carrier, Pukhraj Engg. and Chemicals Pvt. Ltd, India), N-phenyl-N′(1,3-dimethyl-butyl)p-phenylene-diamine (6PPD; National Organic Chem. India Ltd, India), diaryl para-phenylene diamine mixture (DPPD, National Organic Chem. India Ltd, India), microcrystalline wax (MC wax, Gujarat Paraffins Pvt. Ltd, India), aromatic oil (Elasto710, HPCL, Mumbai, India), soluble sulphur (Jain Chemicals Ltd, India), N-cyclohexyl benzothiazol sulphenamide (CBS, National Organic Chem. India Ltd, India), diphenyl guanidine (DPG, National Organic Chem. India Ltd, India) and N-cyclohexyl thio phthalimide (CTP, National Organic Chem. India Ltd, India).
Characterisation of MCC
As received MCC is a white coloured free flowing odorless powder having pH between 5 and 7. Its density and surface area are 1·42 g cc−1 and 1·3 m2 g−1 respectively. The MCC has a purity of 97–99·80%, and volatile loss on drying was 4% (maximum). The surface area was determined following ASTM D6556. Heat loss was measured by ASTM D1509. The rest of the characteristic features was taken from certificate of analysis (COA) of the supplier. Thermogravimetric analysis of MCC was carried out using a Pyris-1 TG analyser from Perkin Elmer, Shelton, USA. The heating rate employed was (10°C min−1). Initially, heating was carried under nitrogen up to 580°C and then switched over to oxygen and further heated up to 850°C. Fourier transform infrared (FTIR) spectroscopy analysis of MCC was performed by mixing it with potassium bromide (KBr) powder of spectroscopy grade. FTIR 2000 from Perkin-Elmer, Norwalk, USA, was used for this purpose. The equipment has a scan range of 400–4000 cm−1 with a resolution of 4 cm−1.
Preparation of rubber compounds
Compound mixing for MCC dose optimisation
The basic formulations used are given in Table 1.
Formulations and cure characteristics
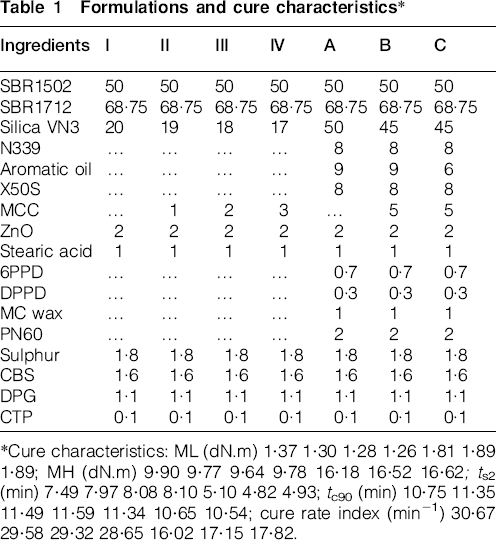
Cure characteristics: ML (dN.m) 1·37 1·30 1·28 1·26 1·81 1·89 1·89; MH (dN.m) 9·90 9·77 9·64 9·78 16·18 16·52 16·62; ts2 (min) 7·49 7·97 8·08 8·10 5·10 4·82 4·93; tc90 (min) 10·75 11·35 11·49 11·59 11·34 10·65 10·54; cure rate index (min−1) 30·67 29·58 29·32 28·65 16·02 17·15 17·82.
The compounds (I–IV) were mixed in two steps using a Brabender Plasticorder PL 2000 of 80 cc capacity (Brabender OHG, Duisburg, Germany). First step mixing was carried out at a constant rotor speed of 60 rev min−1 after setting the temperature control unit (TCU) at 90°C. The mixing chamber was filled with raw rubber and all ingredients at zero seconds and mixing started by lowering the plunger. Sweeping was carried out after 150 s and mixing continued up to 360 s. The batches were discharged at a temperature of 125–130°C.
Step two was carried out by adding the master batch and curatives initially at a constant rotor speed of 30 rev min−1 setting TCU at 70°C. Sweeping was performed after 90 s, and the batch was mixed for 180 s. The batches were discharged at a temperature of 95–105°C.
Compound mixing with higher silica dosage
Compound A in Table 1 is the control compound, and compounds B and C are the modulated ones. All of them contain a higher amount of silica. High silica to carbon black ratio was always maintained to prevent static charge accumulation, which may arise during dynamic applications.26
Mixing was carried out using a two-wing rotor laboratory Banbury mixer from Stewart Bolling, UK, of 1·5 L capacity. Compound B was mixed in three steps, whereas four mixing steps were adopted for compounds A and C. The mixing procedure for the first two steps is given in Table 2. Mixing of step one was performed using a variable rotor speed starting from 60 rev min−1 with TCU set at 90°C. Important conditions for getting good silanisation with surface silanol groups are mix temperature, time and removal of ethanol.27–29 The rotor rev min−1 and mixing time were adjusted accordingly to obtain a discharge temperature of 145–150°C, ideal for a good silanisation reaction.
Mixing procedure for different steps
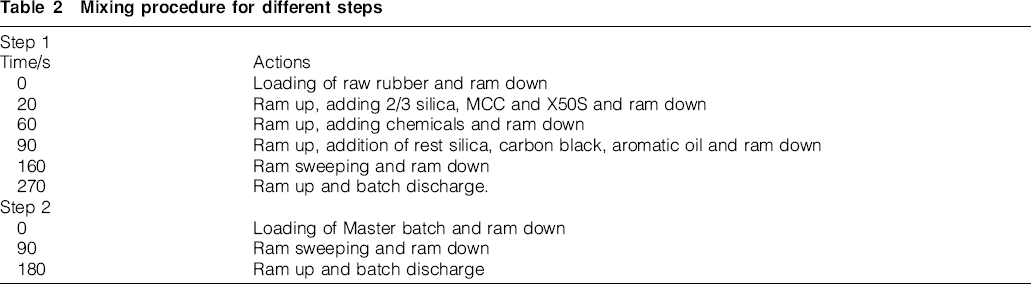
Mixing in step two was carried out by feeding the rubber compound mixed in step one inside the Banbury chamber. A constant rotor speed of 30 rev min−1 was maintained throughout the step. The TCU was set at 70°C, and mixing was performed for 180 s by introducing a ram bump after 90 s. The discharge temperature of the batches was found in the range of 125–130°C.
Mixing step three for compound B was carried out by feeding the master compound from step two along with curatives inside the Banbury chamber. The mixing was accomplished using 30 rev min−1 rotor speed together with TCU set at 70°C. The compound was mixed for 180 s, and a ram bump was given in between after 90 s. The discharge temperature was observed as 105°C (maximum).
An additional step three mixing for compounds A and C was carried out with the master compound from step two inside the Banbury chamber at 30 rev min−1 with TCU set at 70°C. A ram bump was introduced after 60 s, and the batches were discharged after 90 s of mixing. The dump temperature was noticed in the range of 100–105°C.
Sulphur and accelerators were added along with the rubber in the fourth and final mixing step for compounds A and C. Mixing was carried out at a constant rotor speed of 30 rev min−1 and TCU set at 70°C. The discharge temperature obtained was 98–105°C. The power consumption during mixing in Step one was recorded and is shown in Fig. 2.
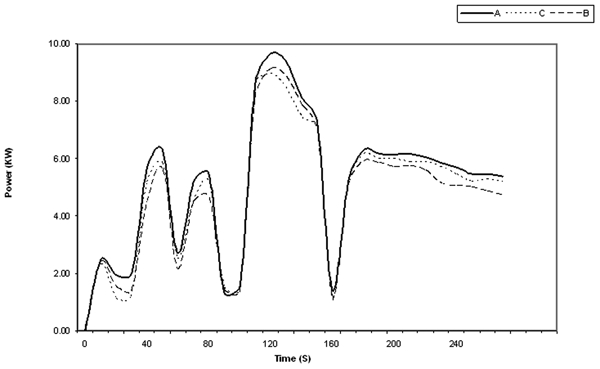
Power curves of A–C during step one mixing
Characterisation of rubber compounds
Rheometric measurements
The cure characteristics of the compounds were measured at 160°C for 30 min using 0·5° arc in MDR 2000 E from Alpha technologies, USA, following ASTM D 5289. The cure rate index was calculated according to equation (1)

Measurement of Mooney viscosity
Mooney viscosity, ML (1+4) at 100°C, using the large rotor was determined in a Mooney viscometer, MV 2000E, from Alpha Technologies, USA, in accordance with ASTM D1646.
Physical testing
The green rubber compounds were cured as per ASTM D3182 in an electrically heated hydraulic press from Hind Hydraulics, New Delhi, India, using compression moulding technique under 150 kg cm−2 moulding pressure. Tensile slabs were cured at 160°C for 2×tc90 minutes, and the rest of the samples were moulded at 141°C for 60 min.
The tensile properties were determined using dumb bell shaped specimens punched from vulcanised sheets according to ASTM D412 using Zwick UTM 1445 from Germany.
The tear properties were determined according to ASTM D624 using Zwick UTM 1445, Germany.
The hardness (Shore A) of the samples was measured with Shore A Durometer, M/s Gibitre Instruments SRL, Italy, in accordance with ASTM D 2240.
The tensile and tear specimens were air aged according to ASTM D573 in Multicell Aging Oven, Tempo Industries, New Delhi, India, at 105°C for 3 days. Further, the samples were conditioned for 24 h at ambient and finally tested for various physical properties. Retention of properties after aging was calculated using equation (2)

Relative cross-link density measurement
The volume fraction of rubber Vr in the deswollen network was calculated by the method given by Ellis and Welding30, 31 from equation (3) stated below

Mechanical testing
The abrasion resistances of the cured samples were determined according to ASTM D5963. The abrader used was from Zwick, Germany.
Dynamic mechanical testing
Rebound resilience (RR) is the ratio of recovered energy to the energy applied to produce the deformation. It is expressed as a percentage and measured using a vertical RR tester (Zwick, Germany, as per ISO 4662). A plunger was dropped from a height of 40 cm at an angle of 90°, and the rebound angle was measured. The equation used for the measurement of RR is stated in equation (4)

The strain sweep experiment was carried out at 30°C using Viscoanalyser VA 4000, Metravib, R.D.S. France. A double sandwiched shear sample having thickness of 2 mm and diameter of 10 mm was used in the experiment. The frequency used was 10 Hz, and sweeping was performed for 1–50% strain range.
Silica dispersion study using SEM energy dispersive spectroscopy
Dispersion of silica was studied for compounds I and III using SEM (JEOL, JSM-6390, Tokyo, Japan). Backscatter electron imaging without sample coating at low vacuum (40 Pa) was employed for the study. X-ray dot mapping of the images captured in SEM was performed by employing energy dispersive spectroscopy having model number Quantax 200 from Bruker, Germany.
Results and discussion
Optimisation of MCC dosage
The thermogravimetry (TG) and derivative thermogravimetry (DTG) profiles of the as received MCC are shown in Fig. 3. The MCC was not found to emit any volatile matter within 80–180°C. It is significant from an industrial standpoint since during mixing and subsequent processing there should not be any product defects created due to its volatile content. The peak degradation temperature is 380°C, which reflects its high thermal stability.

Profiles (TG and DTG) of MCC
The FTIR spectrum of MCC shows a broad band at 3349 cm−1 due to abundant O–H stretches (Fig. 4). Transmittance at 2900 cm−1 represents C–H stretches. The prominent transmission at 1642 cm−1 is due to C = O stretching of aldehyde units present at the reducing chain end. Transmittance near 1400 and 1000 cm−1 confirms complementary C–O stretching and O–H deformations (coupled).32 Abundant hydroxyl groups on MCC are very likely to participate in silanisation in the presence of X50S.33 Characterisation of silanised compounds is described in Section 3.2.
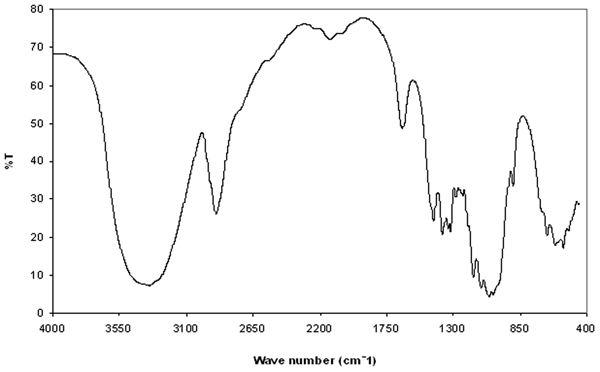
Fourier transformed infrared spectrum of MCC
The compositions of the mixes I–IV are given in Table 1. No X50S was used in these recipes as the purpose of the study was to investigate the effect of MCC loading on the rheometric and tensile properties of MCC-silica composites without any interference.
The rheometric properties of compounds I–IV are compared in Table 1. Compound I is the control compound. Gradual substitution of silica with MCC has marginally declined with respect to ML and MH values. It is reasonable since silica, which always results in high viscosity compounds owing to its self-attractive nature, has been replaced in portion with a softer grade compound like MCC. The low hardness of the mix further reduced the frictional heat generated on shearing, and thus, scorch safety is also increased on MCC addition. However, the presence of a large number of OH groups in MCC possibly induced weak acidity, which was also responsible for the increased scorch safety. Higher tc90 and lower cure rate index (CRI) of these compounds excellently corroborate these observations as well.
The tensile properties of compounds I–IV are compared in Table 3. The impact of MCC on the tensile properties is conspicuous. Tensile modulus at 300% strain gradually increased upon silica substitution. The tensile strength also exhibited a prominent increasing trend (a rise of 24% from I to III) but decreased considerably beyond 10% substitution (compound IV). Net elongation virtually remained comparable up to 10% substitution and thereafter showed a significant drop (compound IV). This is also reflected in the work at fracture calculated from the area under the stress–strain curves. It has been reported earlier that MCC has less tendency to reaggregate as compared to silica.34 During mixing, it was quite probable that few MCC particles, driven by the silanol–hydroxy interaction, may occupy free space in between silica aggregates, and once that happened, dispersion of silica in the rubber has hugely improved, raising both tensile modulus and strength. Representative compounds I and III are investigated under SEM for imminence. The SEM images are displayed in Fig. 5a and b. Control compound (I) in Fig. 5a shows prominent white patches, which probably are the signs of excess electron density at these domains. We confirm this as silica domains from EDX silicon mapping in Fig. 5c. Conversely, compound III, where 10% silica has been substituted with MCC, is devoid of such patches and shows better silica dispersion. The optically visible lumps present in compound I, given the scale of 50 μm, represent typical silica agglomerates. The absence of such lumps in compound III following the same mixing condition and sequence indicates that MCC has undoubtedly facilitated dispersion of silica in the rubber matrix. Beyond 10% substitution, the presence of more non-reinforcing MCC in the system produced adverse effect, and thus, a drop in tensile strength and elongation at break was observed.
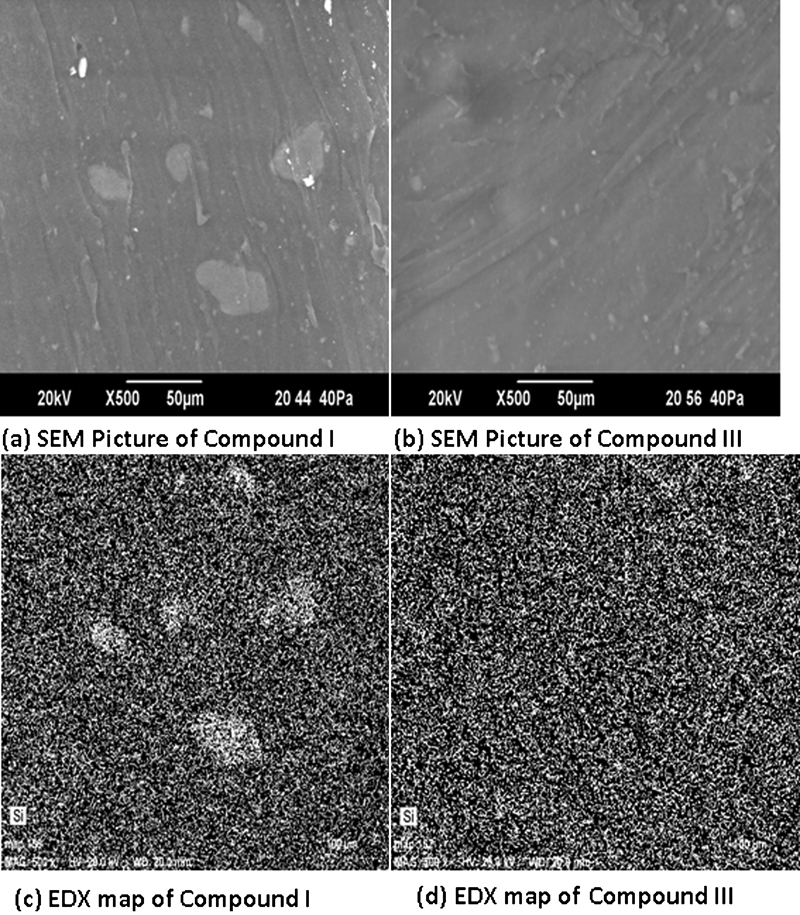
Images (SEM) and EDX map of compounds I and III for MCC dose optimisation
Tensile properties of compounds for MCC dose optimisation
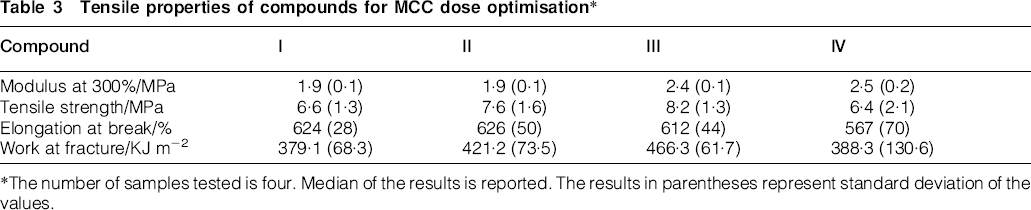
The number of samples tested is four. Median of the results is reported. The results in parentheses represent standard deviation of the values.
Results so far designate 10% silica substitution by MCC as the optimum, and this proportion is extended to higher silica filled recipe for further investigations.
Characterisation of compounds with higher silica loading
Compound A contained 50 parts silica, while in B and C that has been replaced by 10%. The rheological properties of these compounds are given in Table 1. Experimental compounds B and C have ML and MH values although close but still slightly higher than control. It is contrasting too from those observed for compounds I and III in the preceding section. Accordingly, the ts2 and tc90 values of B and C are slightly less, while the CRIs are higher than compound A. Contrary to compounds I–IV, compounds A–C contain silane coupling agent that enhances the interaction between silica, MCC and SBR. In addition, MCC aids silica dispersion. Homogenisation of silica reduces its viscosity, but the additional interaction provided by MCC with SBR slightly raises the reaction torque. The coupling agent blocks some free OH groups of MCC and reduces the acidity of the compounds. This accelerates the curing reaction, which is manifested by low ts2 and tc90 values and high cure rate index than the control. An interesting observation with compound C is that, despite reducing three parts of aromatic oil in the recipe, its rheological properties are truly at par with compound B. This peeps with a possibility of gaining serious processing advantage as described in the following section.
Figure 6 compares the Mooney viscosities of control and other experimental compounds after each mixing stages. In experimental compound B, the Mooney viscosity dropped by 7 units after step one and 5 units after step two as compared to the control (A). Viscosity reduction was achieved through silica homogenisation mutually aided by the coupling agent and MCC. Owing to the much lower viscosity than usual, one mixing stage was eliminated in compound B, yet the final viscosity was found comparable with the control. Owing to this, aromatic oil proportion was further reduced from C and formulated with 3 phr less oil than B, keeping the MCC concentration unchanged. After equal number of mixing stages, the Mooney viscosity of C was found comparable with A. In terms of power consumption, compound A was always the highest consumer as compared to both B and C (illustrated from the power curve from stage I mixing in Fig. 2). At all major peaks of the power curve, A assumes higher values than both B and C. These evidently project MCC as an efficient process aid in high silica compounds.
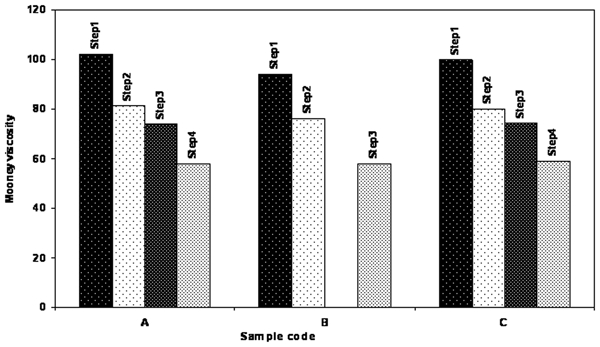
Mooney viscosities of A, B and C after each mixing stages
Figure 7 shows the unaged physical properties, while retention of the same after aging is shown in Fig. 8. Other technical properties are reported in Table 4. Tensile modulus (300% elongation), tensile strength and net elongation of compounds B and C are comparable with control, but tear strength has marginally reduced. The minor loss in tear strength was due to fall in anisotropy in the stress field owing to the reduction in filler aggregates on silica substitution. However, retention of tensile properties after aging is quite close to the control compound (Fig. 8).
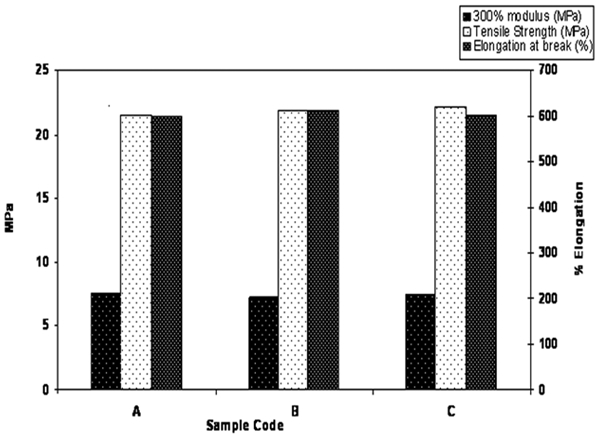
Unaged tensile properties of A, B and C
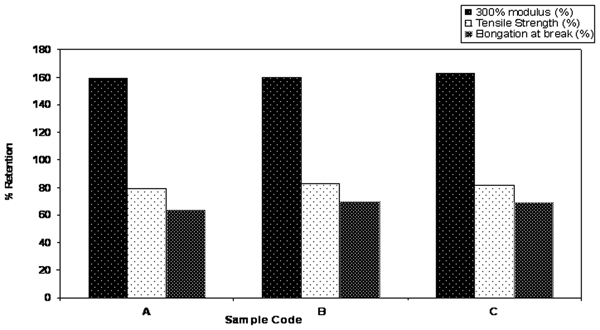
Percentage retention of tensile properties of A, B and C after aging
Technical properties of compounds A, B and C
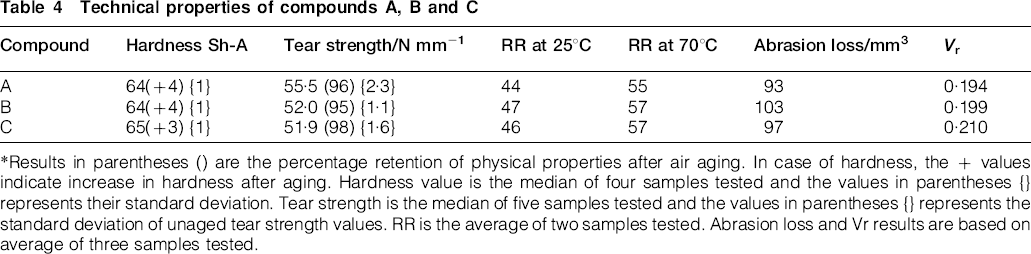
Results in parentheses () are the percentage retention of physical properties after air aging. In case of hardness, the + values indicate increase in hardness after aging. Hardness value is the median of four samples tested and the values in parentheses {} represents their standard deviation. Tear strength is the median of five samples tested and the values in parentheses {} represents the standard deviation of unaged tear strength values. RR is the average of two samples tested. Abrasion loss and Vr results are based on average of three samples tested.
The RR is a dynamic property and designates the damping behaviour of the compounds. The RR values of B and C are found slightly higher than A, which indicates reduced damping behaviour of the former largely due to the poor surface area of MCC than silica. The poor abrasion resistance of B than A is another evidence of similar characteristics. Nevertheless, the abrasion resistance of C is higher than B. It was due to the higher hardness of C (Table 4) since it contained 3 phr less oil than B. The resistance is nearly equal to that of A even though C underwent equal number of mixing stages. These are further supported by the gel fraction data Vr, which shows nearly equal values for both A and B but rose slightly for C.
Figure 9 demonstrates the variation in storage and loss moduli (log scale) under variable strain (30°C). In dynamic mechanical measurements, reinforced rubber compound usually shows a decrease in modulus with increasing strain amplitude, commonly known as the Payne effect, fundamentally due to the progressive failure of filler–filler networks.35–36 Several contributions to the elastic modulus are commonly defined for filled rubber compounds, such as contribution from the crosslinked polymer network, contribution from filler–polymer interaction and finally contribution from filler–filler interaction. At small deformations of reinforced rubber, the filler–filler interactions most distinguishably contribute to the physical properties of filled compound, in particular the modulus. Consequently, it is quite common practice these days to use storage modulus at low strain amplitude as a measure for filler–filler interactions of silica in rubber compound.37–38 In the present study, the difference in storage modulus G′ measured at 1% strain and 50% strain in the vulcanised state has been considered to represent the Payne effect.
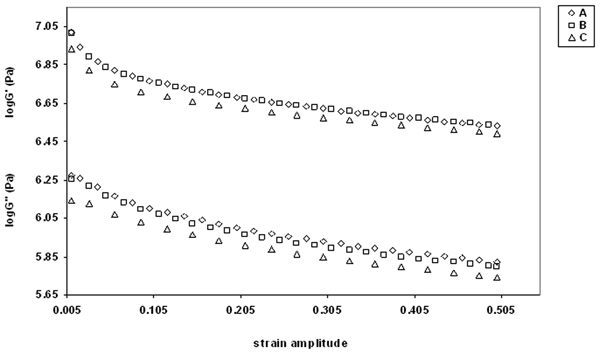
Variation of storage modulus (upper panel) and loss modulus (lower panel) in strain sweep of A–C
The plot log G′/log G″ versus strain amplitude shows nearly superimposed profiles for A and B, whereas the G′ values for compound C is slightly lower all across the strain range. It is important to note that despite one mixing stage less, compound B had exhibited a similar Payne effect with compound A. When the number of mixing stages was made exactly same, compound C had shown slightly weaker Payne effect than A. This is indicative of lower reagglomeration tendency of silica in the presence of MCC due to its bulkier features.25
Conclusions
The study unveils the great potential of MCC as an MFA in emulsion styrene butadiene rubber based high silica compound, although all properties are not exactly equivalent and need to be addressed further. As silica substituent, MCC excellently reduces Mooney viscosity, triggers aromatic oil reduction and eliminates one mixing stage of the mix. A reduced Mooney viscosity endures low power consumption at major power peaks during mixing. Aromatic oil reduction is an important issue since it makes the rubber compound more ecofriendly. Introduction of MCC results in a slightly higher abrasion loss in experimental compound when compared against control compound prepared with higher number of mixing stages. However, the loss could be made comparable if the oil reduction and number of mixing stages are applied together.
Footnotes
Acknowledgements
The authors would like to thank HASETRI and JK Tyre management for their kind permission to publish this work.