
Abstract
Rheological behaviour of suspensions of straw fibre in low density polyethylene (LDPE) melts was investigated at a certain temperature over a wide range of frequencies using a plate rheometer operated in dynamic mode. The viscoelastic of composite melt changed gradually with the straw fibre content increasing, for example at the low frequency region the slope of the G′ decreased from 1.67 of the plain LDPE to 0.889 of 50 wt-% straw fibre plastic composite. The addition of compatibiliser doubled the tensile strength, and the relaxation time reduced from 405 to 214 s. It was observed that the presence of compatibiliser may be attributed to improve interaction between the polymer and filler, which reduces the resistance of the agglomeration of straw fibres, lessening the relaxation time. Consequently, the straw fibre plastic composite is easier to produce.
Introduction
Natural fibre (for example wood flour, flax fibre, coconut fibre and so on) polymer composites are environmentally biodegradable, less abrasive when processing equipments and lighter in weight compared to mineral filled composites. There has been a very large amount of increment in the development and commercial use of natural fibre filled composites mainly in automotive industry and construction.1, 2 The straw is the waste of plant rice, and the output is in large quantities; it was almost abandoned or burnt in the past, which not only wasted the resources but also polluted the environment. A new environment friendly composite material could consist of the straw fibre and the plastic. This material is also conductive to reducing the waste. However, there have been few studies on straw fibre/polymer composites (SPCs), and most published reports are limited to the composite consisting of two or more natural fibres because of the poor mechanical properties of pure fibre composite. 3 Straw fibre has very irregular surfaces, with a complex internal composition as well as polar hydroxyl groups; they usually interact with themselves rather than connect with the polymer matrix. 4 A compatibiliser is always chosen to enhance the interfacial adhesion between straw fibre and polymer matrix. In the present work, the compatibility of the interface was always analysed through the mechanical properties and scanning electron microscope (SEM) at the fracture surface, these characterisation methods were restricted and affected by the complex structure of the straw fibre. However, the macroscopic physical properties of the resulting composite cannot accurately reflect the effect of the compatibiliser on the composite structure.5, 6
Previous researches have shown that the matrix and fillers interact thermodynamically according to their surface potentials and hydrodynamically through flow field interaction, and the fillers can also make the composite present many non-linear rheological features. 7 Zhou et al. characterised the properties and degrees of branching of the long chain branching polypropylene by rheological method. 8 Hirstov studied the effect of particle size, shape of natural fibre, concentration of compatibiliser on the rheological behaviour of wood plastic composite by dynamic rheological experiments, and their results showed that the rod-like fibre is more inclined to entangle among themselves. 9 Azizi and Ghasemi investigated the dynamic melt rheological properties of wood plastic composites. They found that the addition of compatibiliser increased the storage modulus and complex viscosity, and results indicated that the compatibiliser formed strong bonds with both wood fibre and polymer matrix leading the increasing. 10 However, rheology plays a vital role in analysing composites melt, and it is still less studied in straw fibre plastic composites.
In this paper, the dynamic oscillation mode of a rheometer has been selected to investigate the viscoelstic behaviour of the composites melts, and many analytical methods were employed to characterise the relaxation time(s), which could reveal the effects of the compatibiliser on the internal structure and the fibre/low density polyethylene (LDPE) interfaces of the composite. This rheological date analysis is of significance for applying of straw fibre composites.
Experimental
Materials
Low density polyethylene, with a melt flow index of 7 g per 10 min and a density of 0.9195 g cm− 3, was supplied by Beijing Yanshan Petrochemical Co., Ltd, China Petroleum & Chemical Corporation. Straw fibre was harvested in Tianmen, in Wuhan province in China. Maleic anhydride grafted polyethylene (PE-g-MAH), as coupling agent, was provided by Shanghai Sunny New Technology Development Co. Ltd, China.
Sample preparation
The straw fibre was cut into 40 mesh and dried at 80°C in an oven for 8 h. Then, LDPE and straw fibre with or without compatibiliser were compounded using an open mill at 130°C, when the mixture was uniform transited into a thermocompressor to press a panel with thickness of 4 or 5 mm at 140°C. The concentration of straw fibre was from 10 to 50 wt-%, and the level of PE-g-MAH was 0 and 5 wt-%, the various samples were indicated in Table 1.
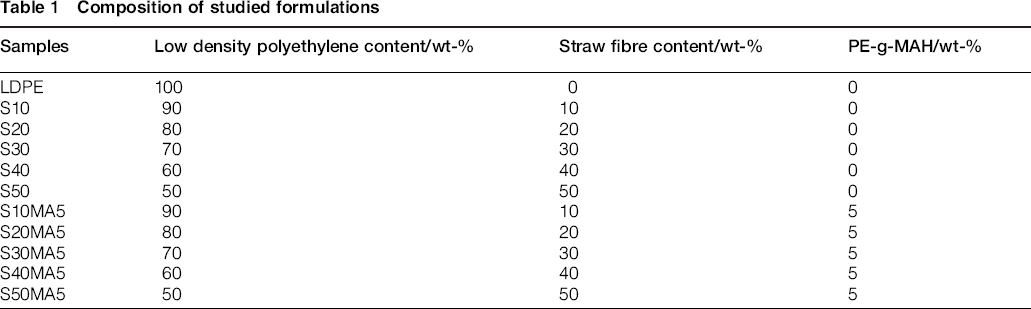
Composition of studied formulations
Measurements
Mechanical properties measurements. Tensile strength was tested according to the standard GB/T1040.2-2006 through a material testing machine. The value of impact strength could be given through a Charpy impact tester according to the standard GB/T1043-93.
Rheological measurements. A rotational rheometer, DHR-2 (TA instruments. USA), with a parallel plate geometry (diameter is 25 mm), was used for rheological measurements. The measurements were performed in the oscillatory mode with gap setting of ∼3 mm. The stress was kept constant at 50 Pa over the whole frequency range to ensure linearity. This stress was selected from an oscillate amplitude stress sweep test, in which, within 10–1500 Pa, at a frequency of 1 Hz, the deviation stress from linearity was tracked. Then, frequency sweep test was carried out at a certain temperature. The temperature was 135°C and the frequency ω varied between 0.01 and 100 rad s− 1.
Results and discussion
Mechanical properties
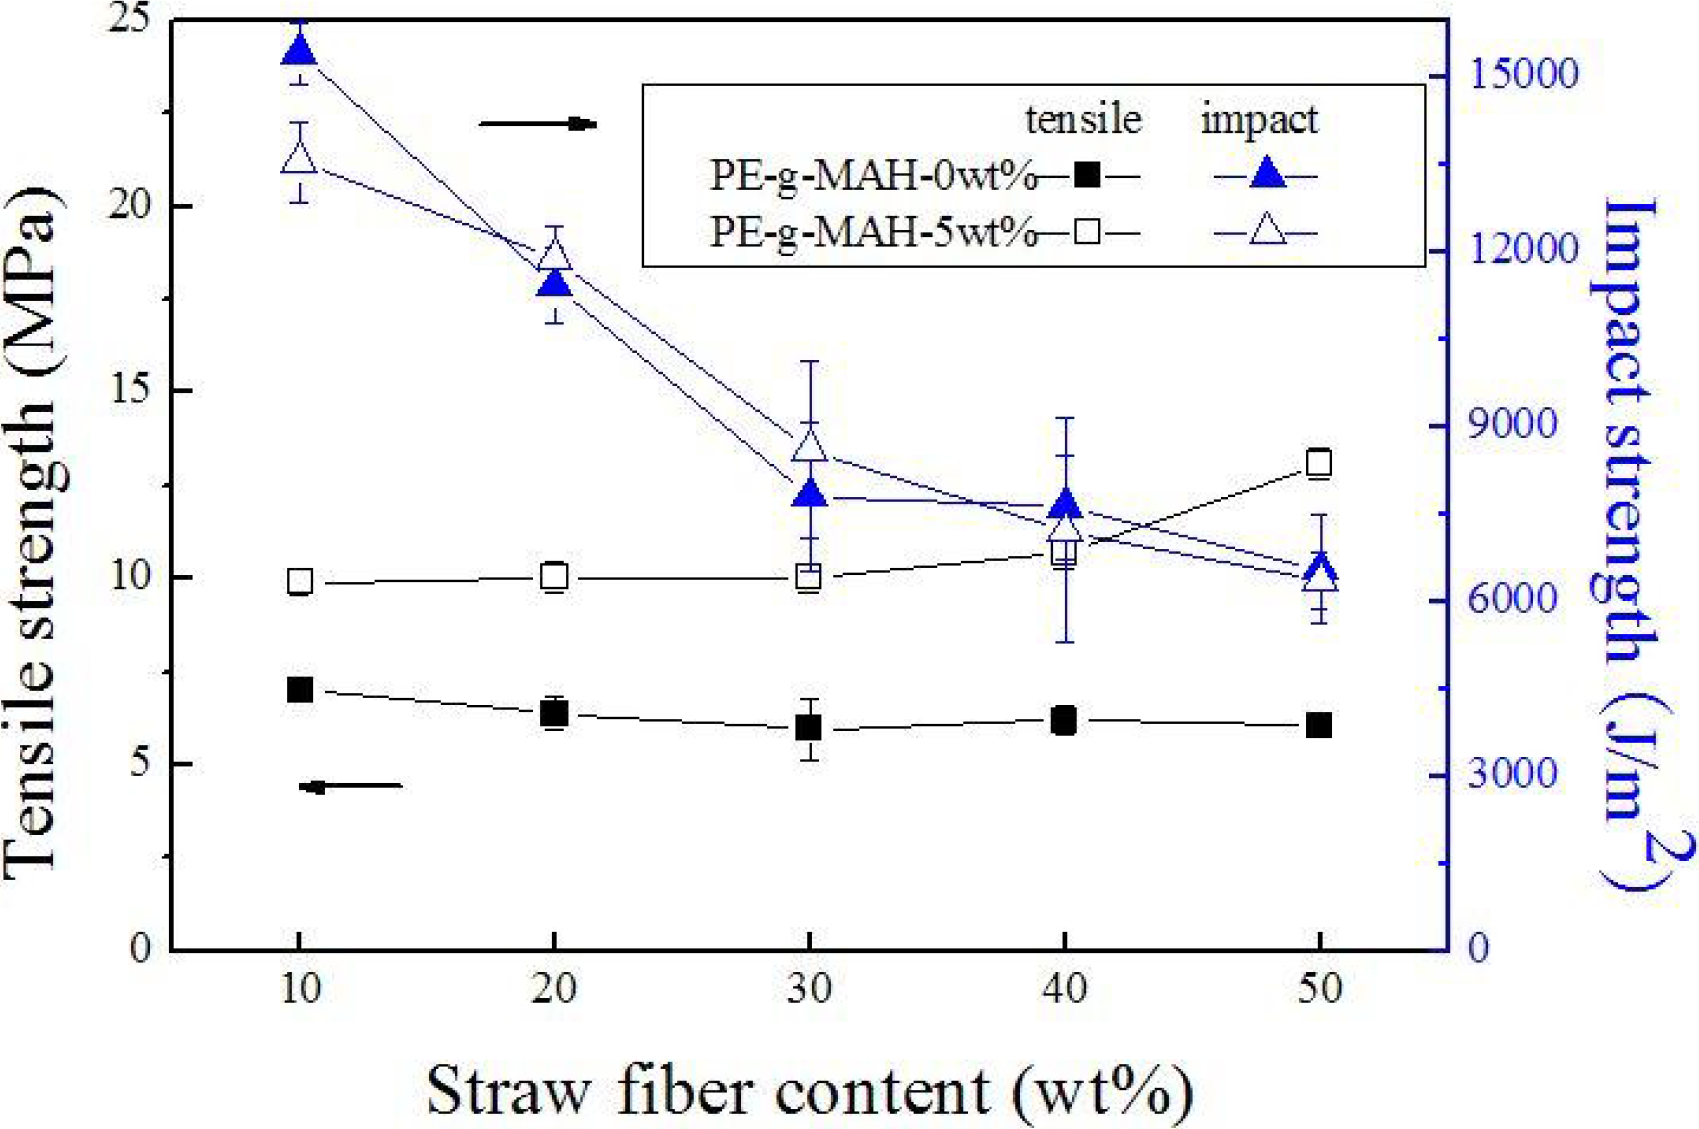
Fig. 1 shows that the addition of compatibiliser in SPC samples has doubled the tensile strength. The improved tensile strength was attributed to increased polymer–filler interaction that was formed by the compatibiliser that was like a bridge connecting the polymer matrix and filler. This ‘bridge’ is beneficial to the stress transfer and reduces the stress concentration. However, the interfacial adhesion between the LDPE and straw fibre is rigid 11 ; when the sample suffers an instantaneous force, it could be easily broken at the rigid interface. That is why there is no obvious difference in the impact strength in Fig. 1.
Impact strengths and tensile strengths of SPC samples
Figure 2 shows that impact section photos of SEM. Figure 2a is an SPC sample without compatibiliser; Fig. 2b is a composite with the compatibiliser. From Fig. 2a, the straw fibre could be observed clearly, and the fibres were separated from the matrix. Thus, after adding the compatibiliser, the interface could not be observed clearly. The image shows that the polar straw fibre and the non-polar LDPE matrix cannot be linked tightly; there are some interspaces between them. The compatibiliser could improve the situation, and the image shows a better adhesion between straw fibre and matrix.
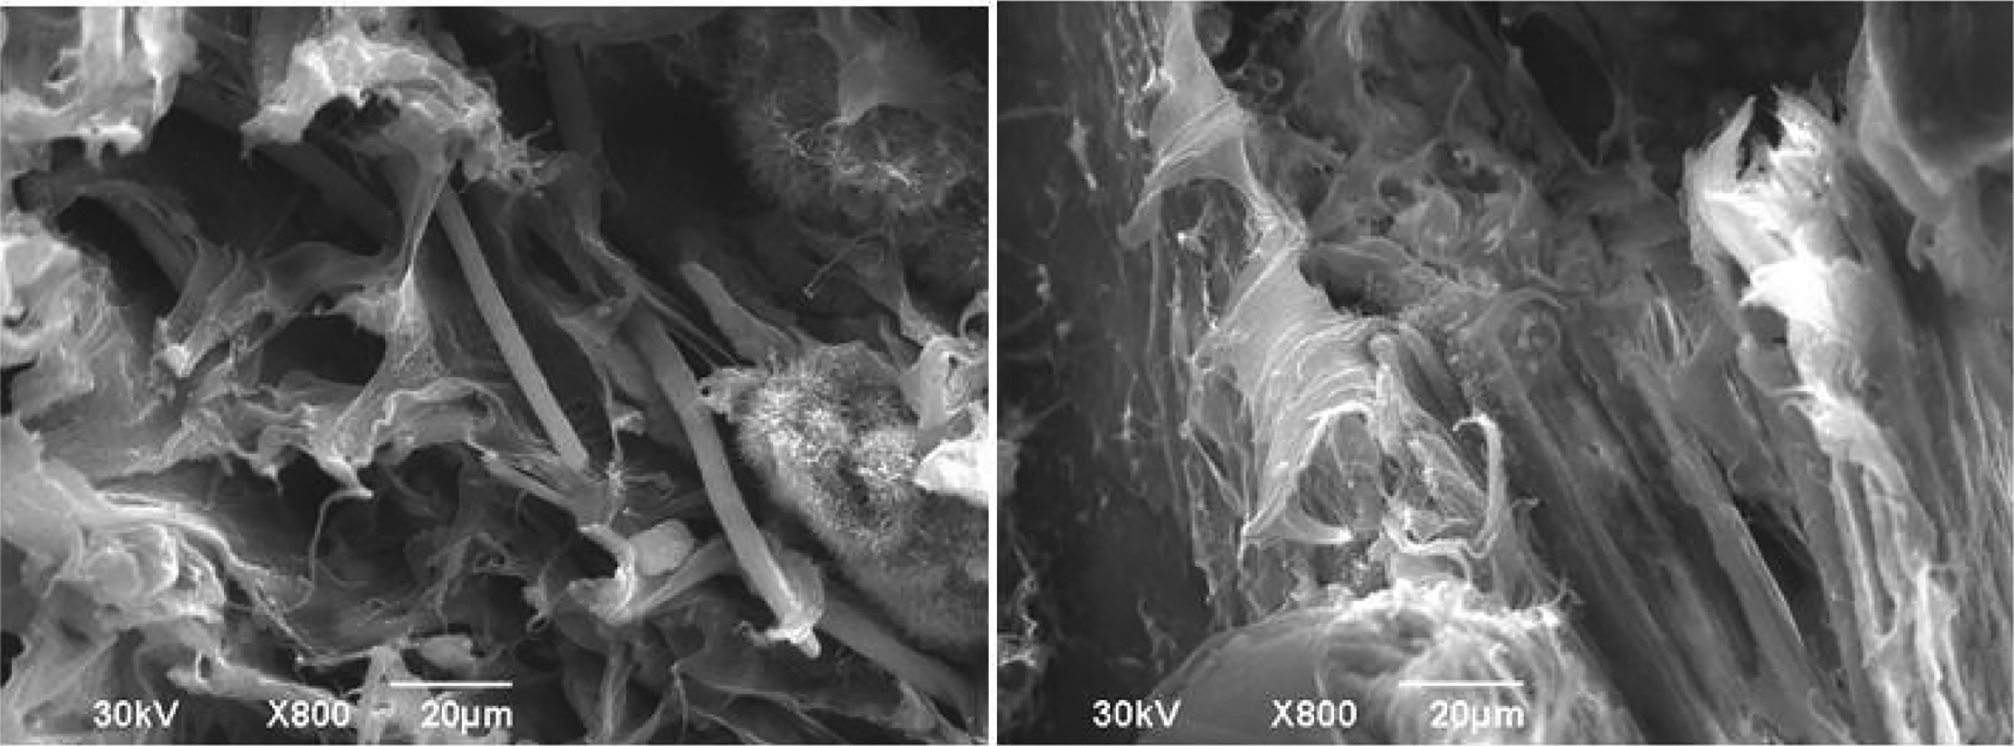
a straw fibre/polymer composite sample without compatibiliser; b SPC sample with compatibiliser
Zero shear rate viscosity and entanglement of raw materials
In order to study the entanglement between matrix LDPE and compatibiliser PE-g-MAH, the weight average molecular weight
 have to be calculated. According to the Cox–Merz law, the complex viscosity η* at lower frequency can be transformed to zero shear rate viscosity η0. The zero shear rate viscosity of LDPE and PE-g-MAH could be obtained from the frequency sweep results, and they were 5296.1 and 4.56e6 Pa s respectively.
For LDPE, the
 can be calculated as follows
12
can be calculated as follows
12


Then, the values of
 of LDPE and PE-g-MAH were 1.12e5 and 8.16e5 g mol− 1 by equation (1) respectively. From the literature, we can know the Mc of LDPE is 4000 g mol− 1. In conclusion, raw materials could be entangling with each other when they are mixed together.
Stress sweep to determine the linear area
The modulus versus stress for the LDPE/straw fibre composites with different filler content and compatibiliser in the dynamic amplitude sweep test are shown in Fig. 3. It can be seen that the non-linear viscoelastic region was shifted to the lower stress side as the straw fibre content increased. Besides that, at less fibre content, loss modulus was higher than storage modulus, but highly filled sample showed an opposite result. This showed that the presence of rigid straw fibre made the structure of composite complicated, smaller stress can damage the structure of the melt with the filler content increasing. Moreover, the rheological behaviour of this composite showed the similar properties to solid, which revealed that the rigid particles could strengthen the matrix. After adding the compatibiliser, the linear region extended relatively to the previous one. The reason is that the entanglement of straw fibre particles could cause the stress concentration to lead to the destruction of structure at lower stress, and the compatibiliser connected LDPE and straw fibre, which made the system more stable.
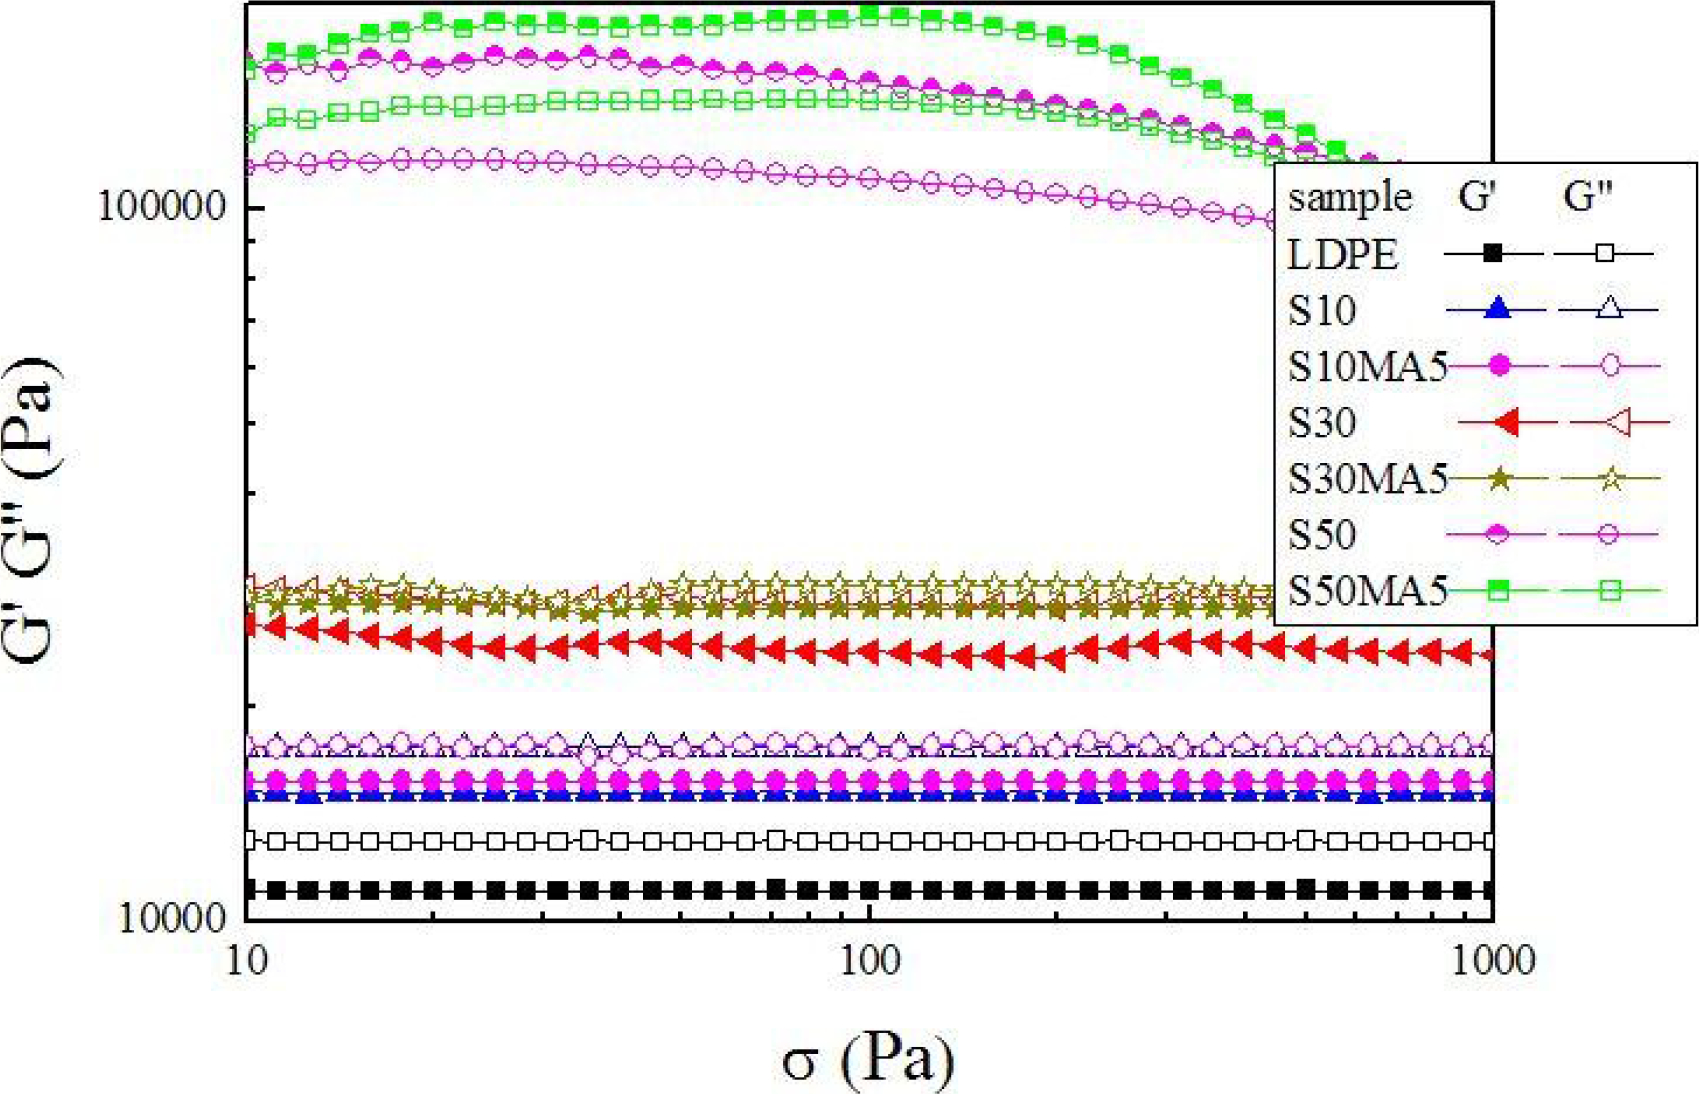
Storage and loss modulus versus shear stress for LDPE and SPC samples
Analysis of frequency sweep
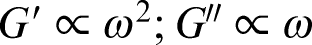
In the linear region, a slight oscillation frequency sweep could reveal the dependence of G′ and G″ to frequency. According to the linear viscoelastic plot, the relationship between G′ and G″ of homogeneous system and the angular frequency ω in the lower frequency zone is given as follows
Here Je0 is the steady shear compliance. From the equation, the relationship between G′ and G″ of linear system and the angular frequency ω could also be described as
 . For heterogeneous system, G′ and G″ are sensitive to the internal structure. The dynamic modulus could be deviated from the linear terminal behaviour. It is often thought that the phenomenon is associated with interfacial relaxation, the shape of the dispersed phase and internal structure. For this situation, the relationship between G′ and G″ and the angular frequency ω could be expressed as follows

The variations of G′ and G″ with frequency for different SPC samples are illustrated in Fig. 4. It can be seen that the composite with higher straw fibre content exhibited more solid attribute, for example the storage modulus was higher and the gel point appears earlier. At the lower frequency region, the G′ and G″ of LDPE met the equations (4) and (5), but those of the SPC samples were not. In addition, G′ and G″ of SPC samples were deviated from the linear viscoelastic plot at lower frequency area. In the terminal zone, with the increase in straw fibre content, the slope of G′ of the plain LDPE and 50 wt-% SPC decreased from 1.67 to 0.889. Under the same straw fibre concentration, the addition of PE-g-MAH also caused the decline of the slope of G′. The non-terminal behaviour of S10–S50 suggests that there is a longer relaxation mechanism, which can be ascribed to the agglomeration and entanglement of straw fibre. This entanglement makes the system heterogeneous. Although the compatibiliser may enhance the dispersion of straw fibre in LDPE matrix,the content of straw fibre is too large that the inner structure is still heterogeneous.
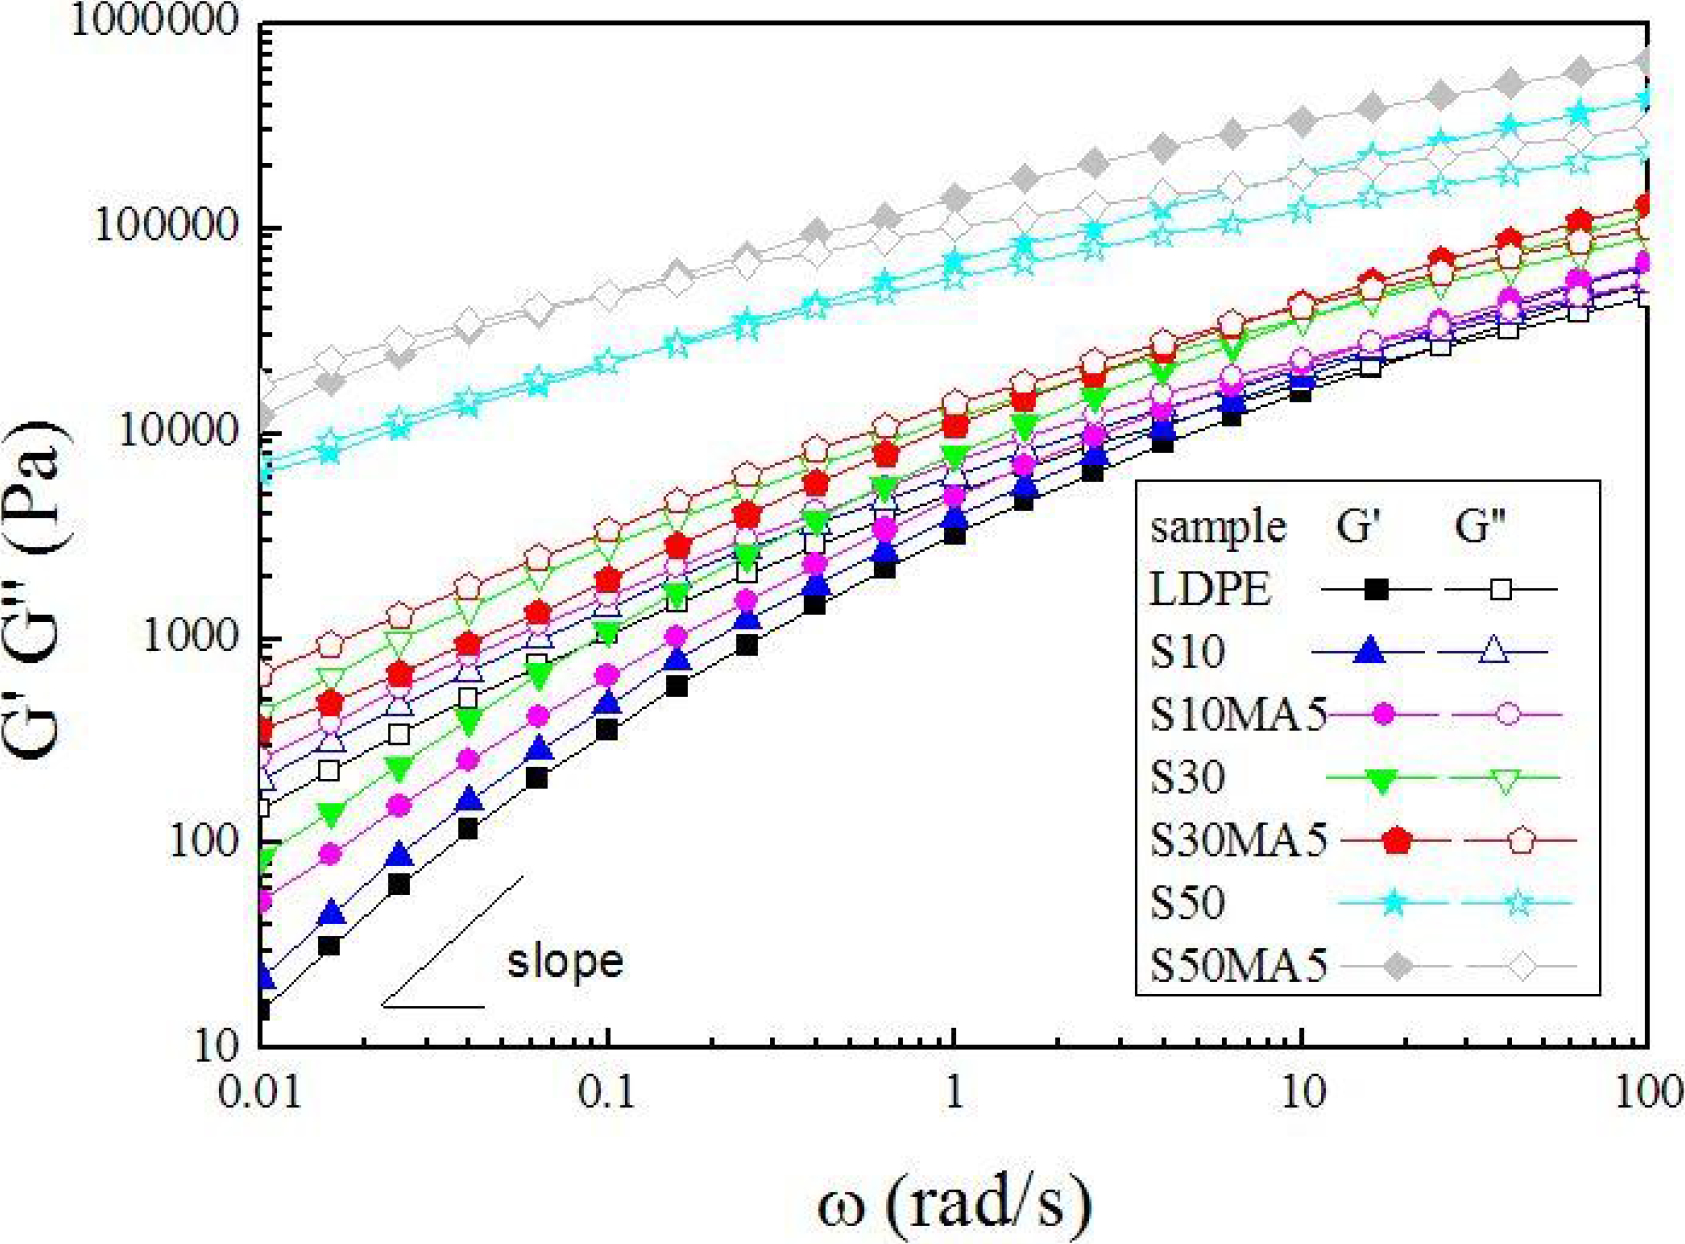
Frequency sweep results of LDPE and SPC samples in linear viecoelastic region
Similar results could be seen in Fig. 5. The increase in straw fibre content and the addition of compatibiliser made the complex viscosity η* increase substantially. The great influence of straw fibre on viscosity was observed at low shear rates. Since the complex viscosity represents the viscoelastic resistance of the polymer melt during flow, a high viscosity implies a higher inner resistance and more complicated internal structure. It can be thought that with higher straw fibre loadings, the filler–filler interaction is enhanced, which includes the agglomeration and entanglement of straw fibre particles. Moreover, the compatibiliser strengthens the interaction between matrix polymer and filler. Both of the agglomeration network and the filler–matrix interaction could drag the LDPE chains to lead the viscosity increase.
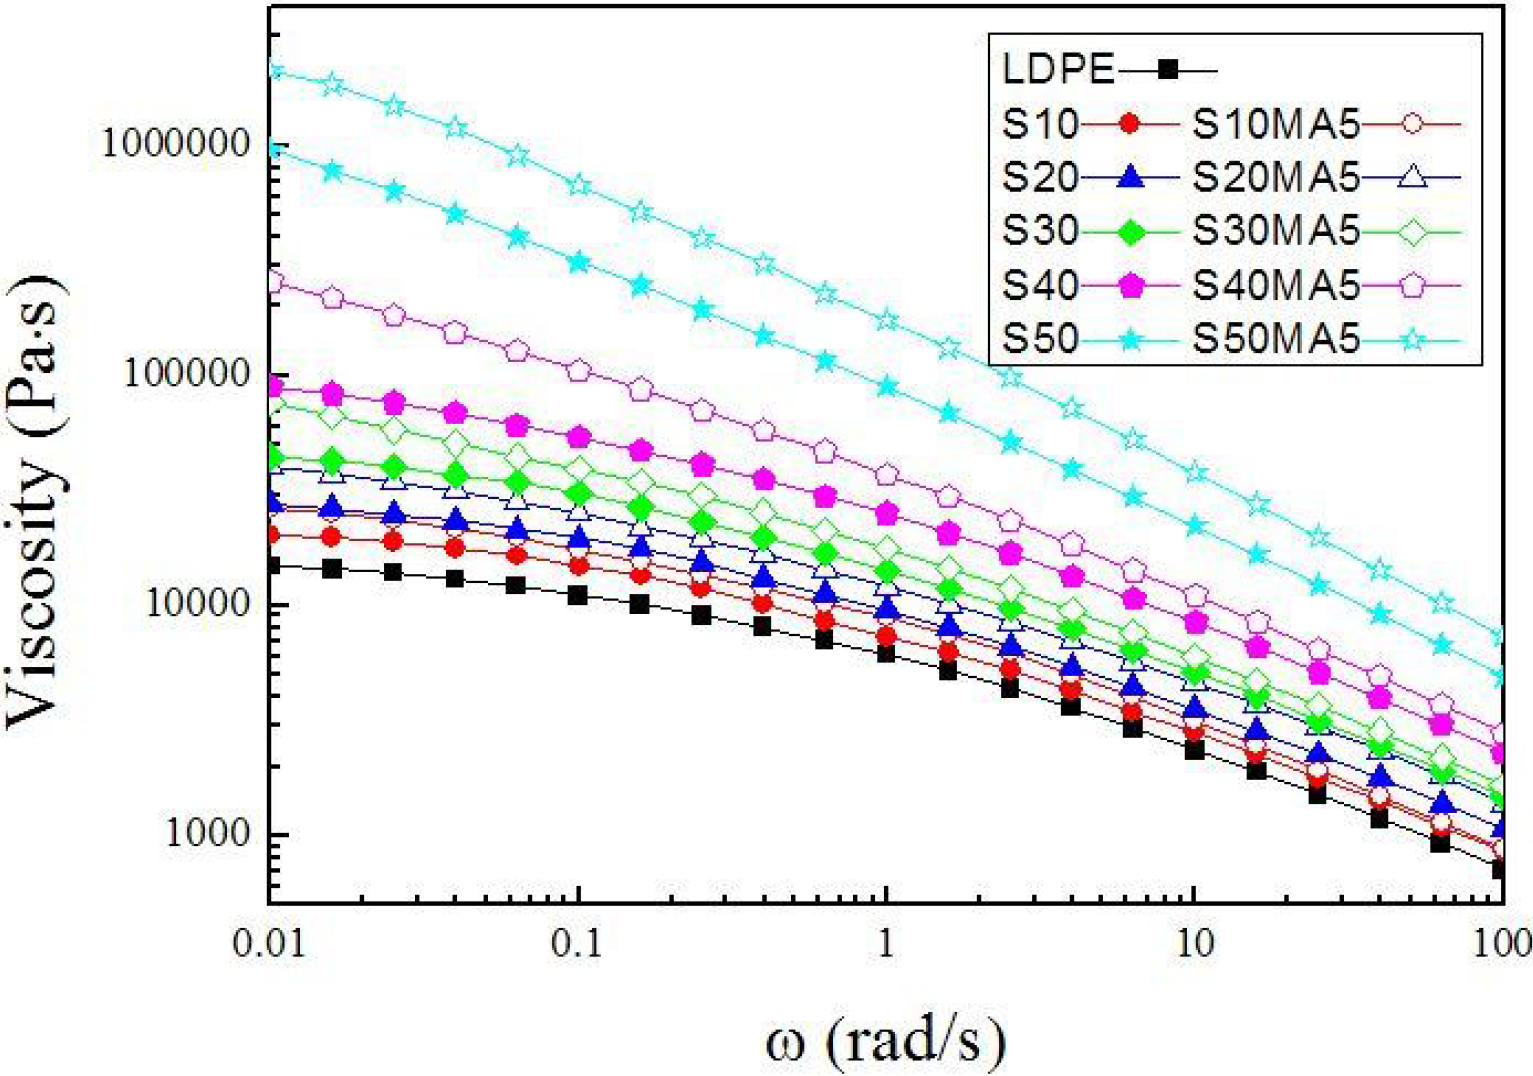
Complex viscosity versus frequency of LDPE and SPC samples
Cole–Cole plot
The Cole–Cole plot, which decribes the relationship between the dynamic viscosity η′ and loss viscosity η″, reflects the existence of various groups with different relaxation times and gives detailed information about the relaxation processes in the filled polymer melts. 13 Fig. 6 summarises the Cole–Cole plot of LDPE, SPC samples and the calcium carbonate filling LDPE system. The relaxation diagram of virgin LDPE was nearly a semicircle. With the straw fibre content increasing, the arc radius increased gradually. Even at 50 wt-% straw fibre content, the diagram was nearly a straight line, which cannot to be seen in the centre of a circle, which shows that the relaxation time of the S50 sample would be longer. What's more, when the straw fibre content was >20 or 30 wt-% with compatibiliser, the Cole–Cole diagram changed to an irregular shape; and a tail was also observed in samples containing higher straw fibre and compatibiliser, which indicated a new mechanism of relaxation by agglomeration and entanglement. 14 This phenomenon has also been found in other multicomponent polymer systems in which there existed phase separation or the network type structure formed by aggregation of filled particles. 15 Particularly, the tail is related to the formation heterogeneous structure. Therefore, the aggregation of straw fibre and the complex network in the polymer matrix are believed to be the main reason for the changes of the Cole–Cole plot. The compatibiliser contributes to the formation of network that makes the relaxation processes different. It is clear that the longer relaxation process is related to rigid particles; internal interaction and network structure results from the addition of straw fibre particles and compatibiliser. It was suggested that there were three networks in SPC:filler–filler agglomeration network, filler–matrix network and LDPE chains network. The two complicated networks contributed to the different relaxation time(s) and processes. Figure 6f is a Cole–Cole diagram about calcium carbonate filling LDPE system, which was in contrast to the SPC samples. The trends of all the samples were the same that indicated there was only one simple structure in this system, and the structure of calcium carbonate filling LDPE system is homogeneous. The addition of calcium carbonate only lengthened the radius of the semicircle so that it did not change the relaxation process of this composite.
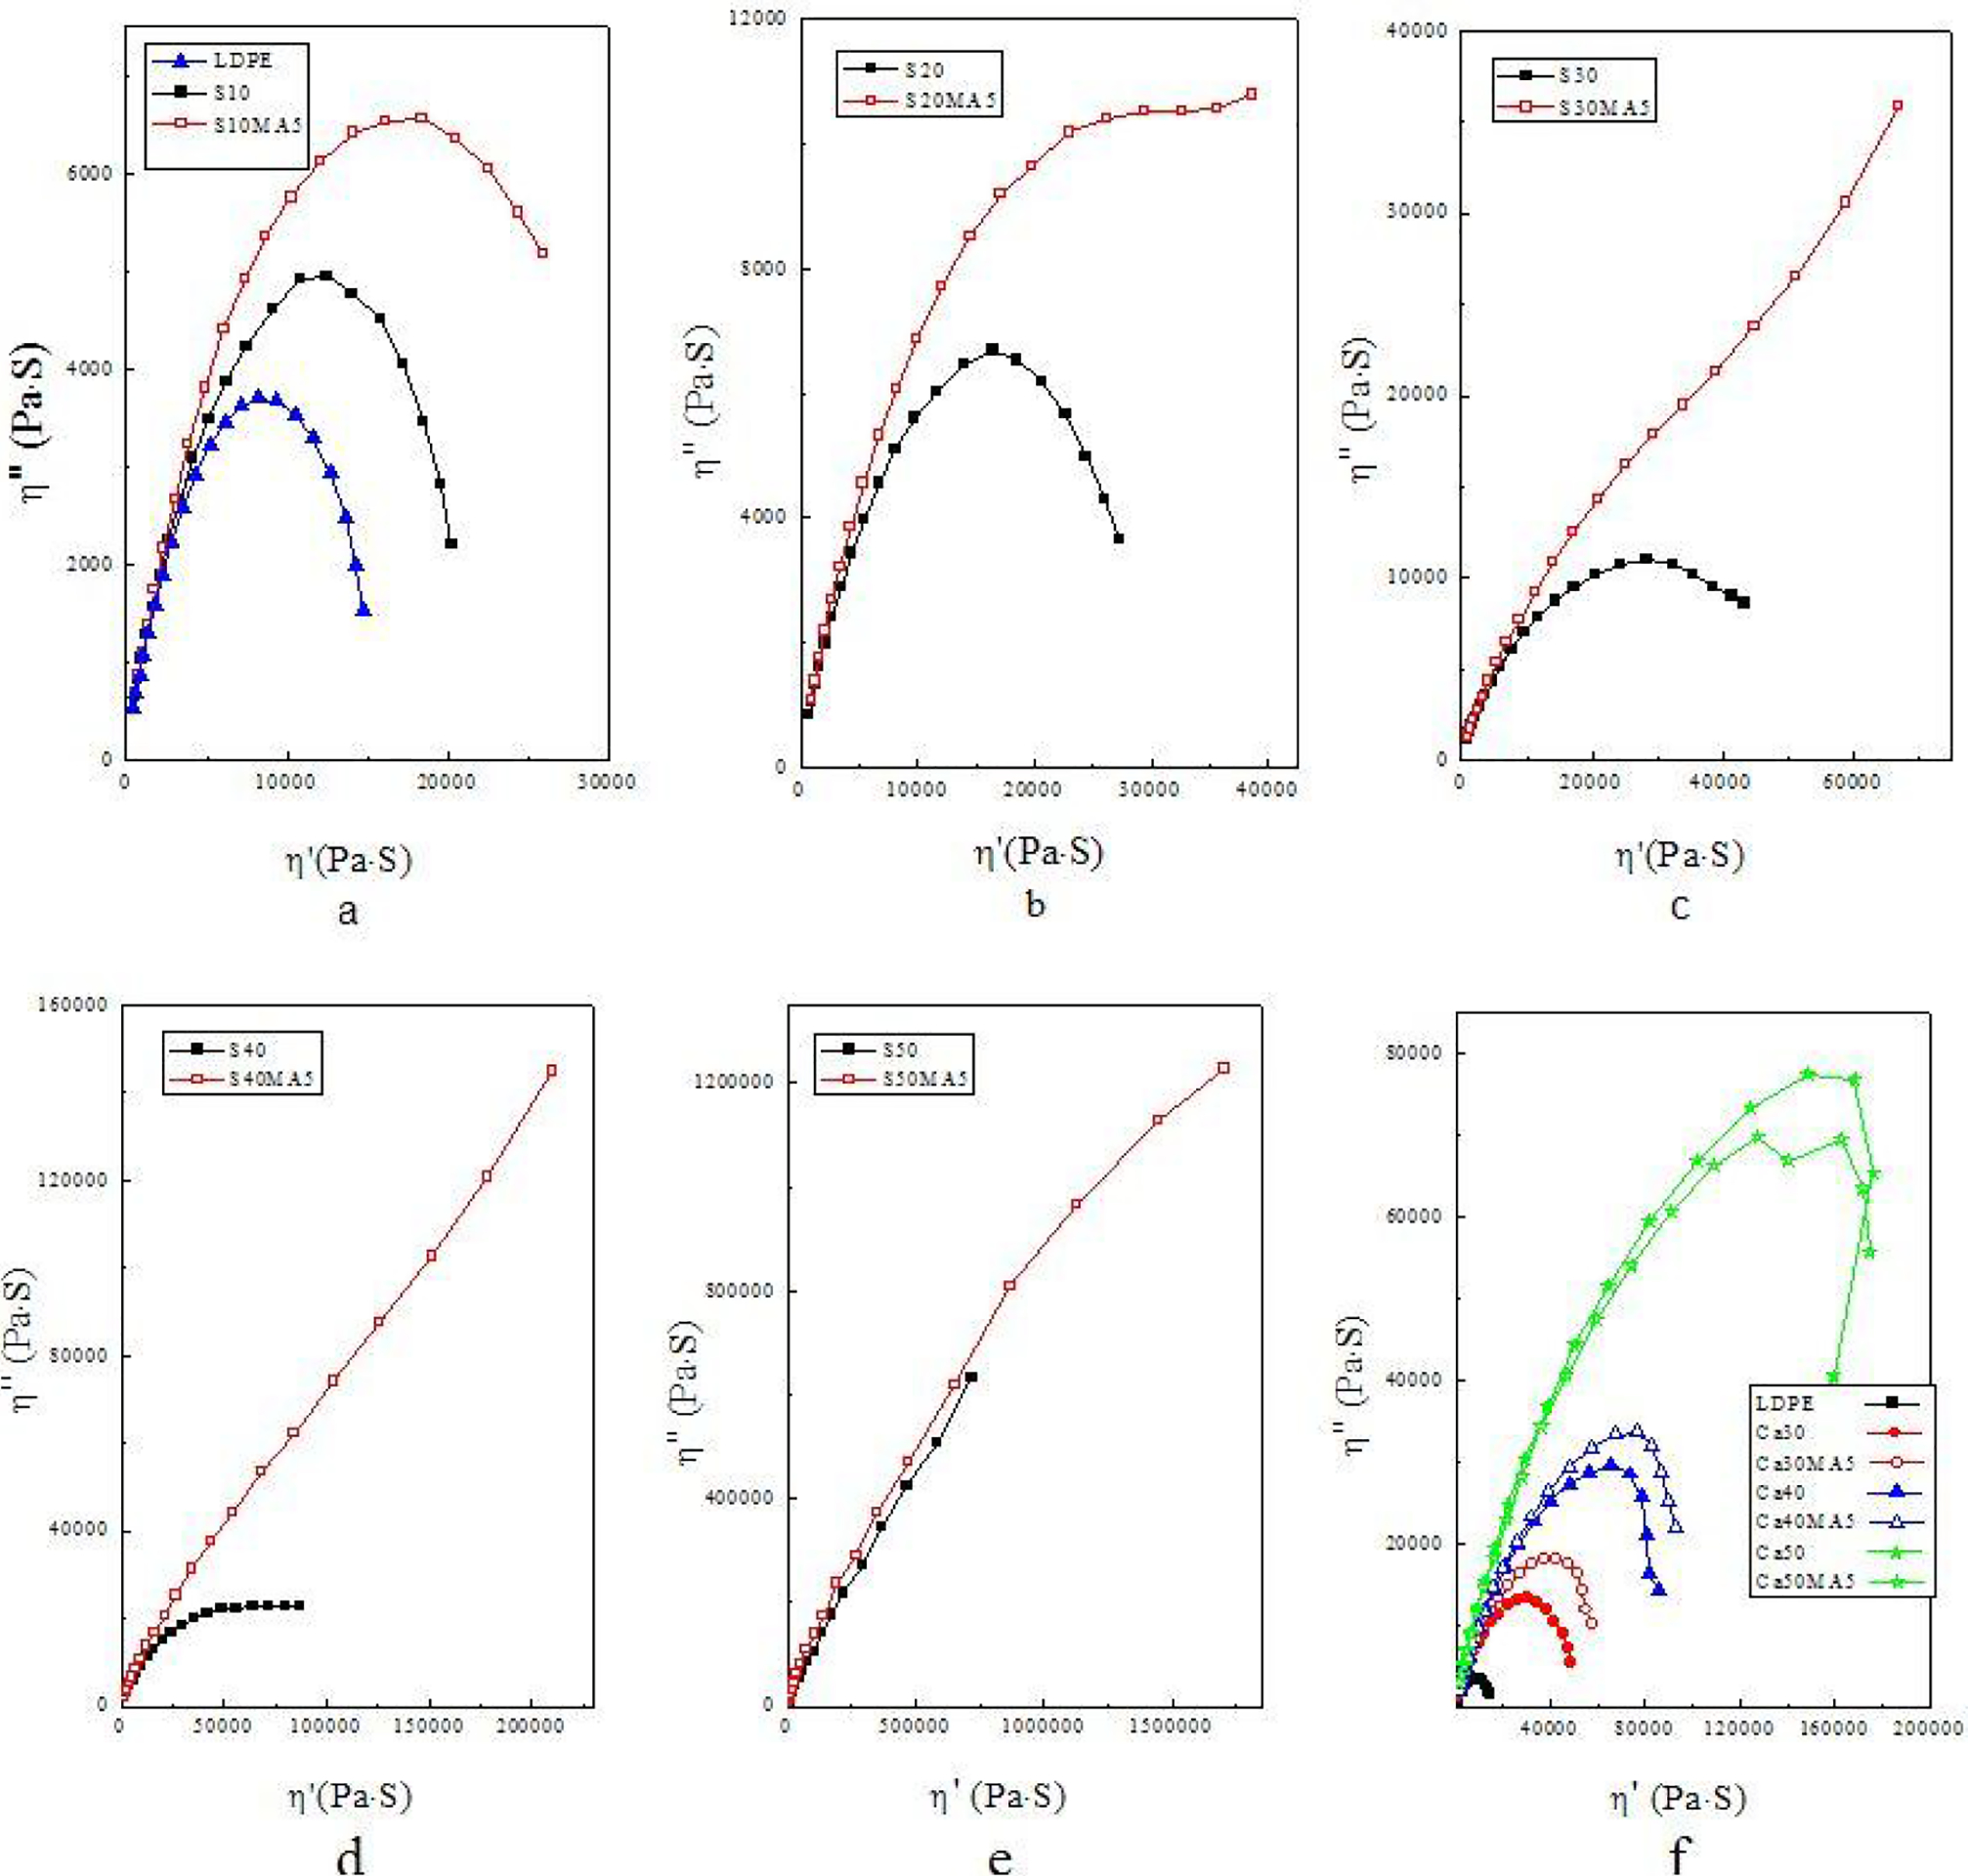
a–f Cole–Cole diagrams of different SPC samples and f of calcium carbonate filling LDPE system
Analysis of relaxation time based on cross model
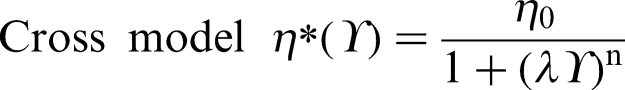
The dynamic viscosity versus frequency was reported, the shape of the curve is similar to the shape of a viscosity versus shear rate curve, which was known as the Cox–Merz. Then, Cross model (equation (3)) was utilised to fit the experimental points. In particular, the fit was very good, as shown in Fig. 7. The values of parameters could be given, which is listed in Table.2.
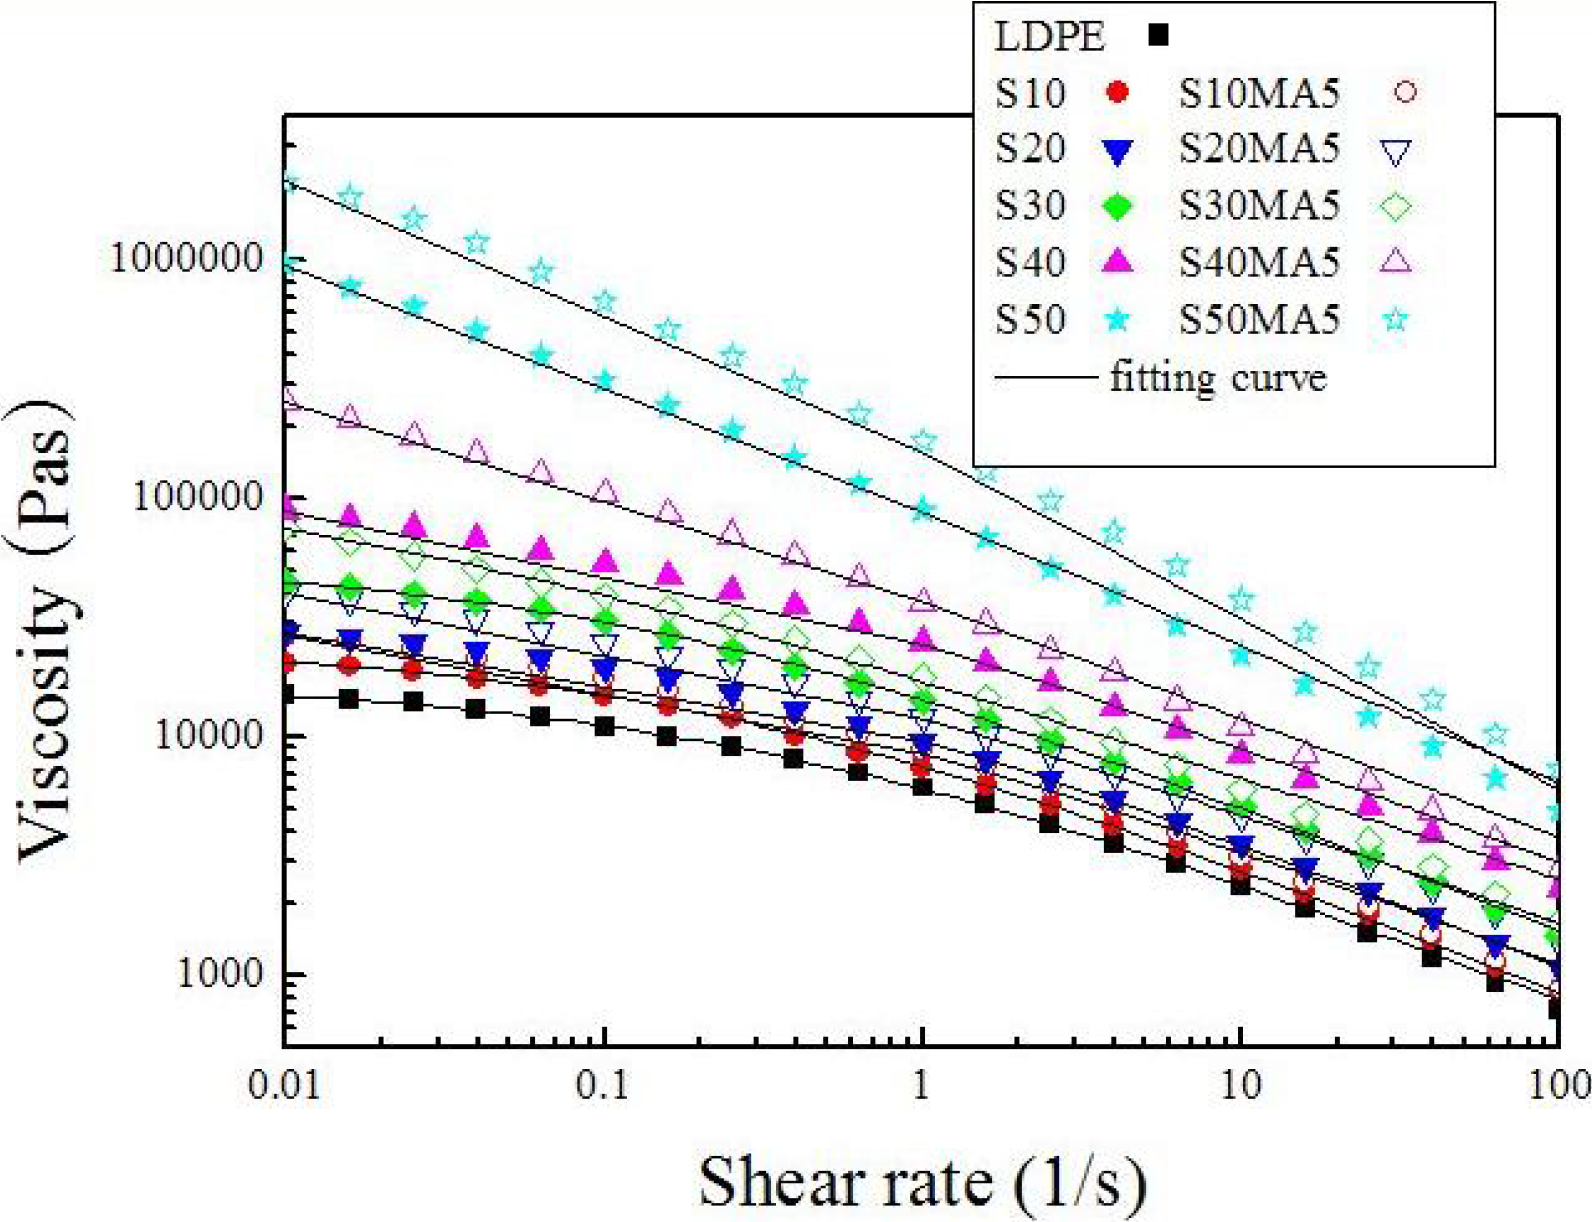
Viscosity as function of shear rate of transformation of frequency sweep in linear region for LDPE and SPC samples; continuous lines correspond to Cross model fitting
Values of parameters fitting to Cross model
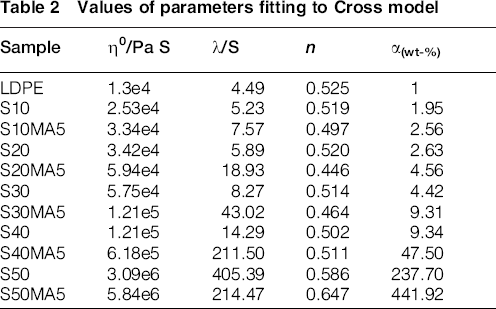
α(wt-%) is the frequency translation factor, which can show the degree of deviation of filled composites to matrix polymer, the relationship can be written as
There is a conversion relationship of linear viscoelastic of solid particle filled polymer system in different filler content or different matrix. In this straw fibre filled with polyethylene, the α(wt-%) can present the deviation of relaxation processes of straw fibre composites to the matrix LDPE. The value could show the degree of difference. From the table, with straw fibre content increase, the rheological parameters changed regularly, i.e. η0, λ and α(wt-%) increased gradually. The effect of straw fibre content was that when the fillers were numerous in matrix, the interaction between filler to filler and between filler to polymer forms two kinds of networks to drag the polymer chains not to fully stretch and relax. Moreover, with straw fibre concentration increasing, the sterically hindered, which was made of the polar hydroxyl groups for polymer chain increased. Namely, after the straw fibre filled system, matrix polymer chain needs more time to be stabilised. The samples with compatibiliser λ increased with the straw fibre content except 50 wt-%. The reason may be when the concentration of straw fibre is too high, the interaction between filler to filler could be too strong to prevent the matrix polymer chain returns to the steady state, at this time, the PE-g-MAH weakens the agglomeration of straw fibres, which means that the resistance decreases so that the relaxation time decreases. Thus, at a higher filler content ( ≥ 50%) system, the compatibiliser could improve the polymer matrix chains to relax.
Figure 8 shows the shifted aster curves of the scaled dynamic modulus and tangent of the phase angle for LDPE with different SPC samples. Figure 8 shows us that at high α(wt-%)ω area, the modulus and tangent of different samples overlap together and form a smooth curve, and at the lower α(wt-%)ω area, the SPC diagram shows the specific relaxation behaviour of the end, which are not the same with LDPE. Moreover, the tangents of the SPC samples with compatibiliser are smaller than those of LDPE. It means that the inner structures of these samples are not so easy to relax. The addition of straw fibre and compatibiliser makes the system more complicated, which correspond with the results above.
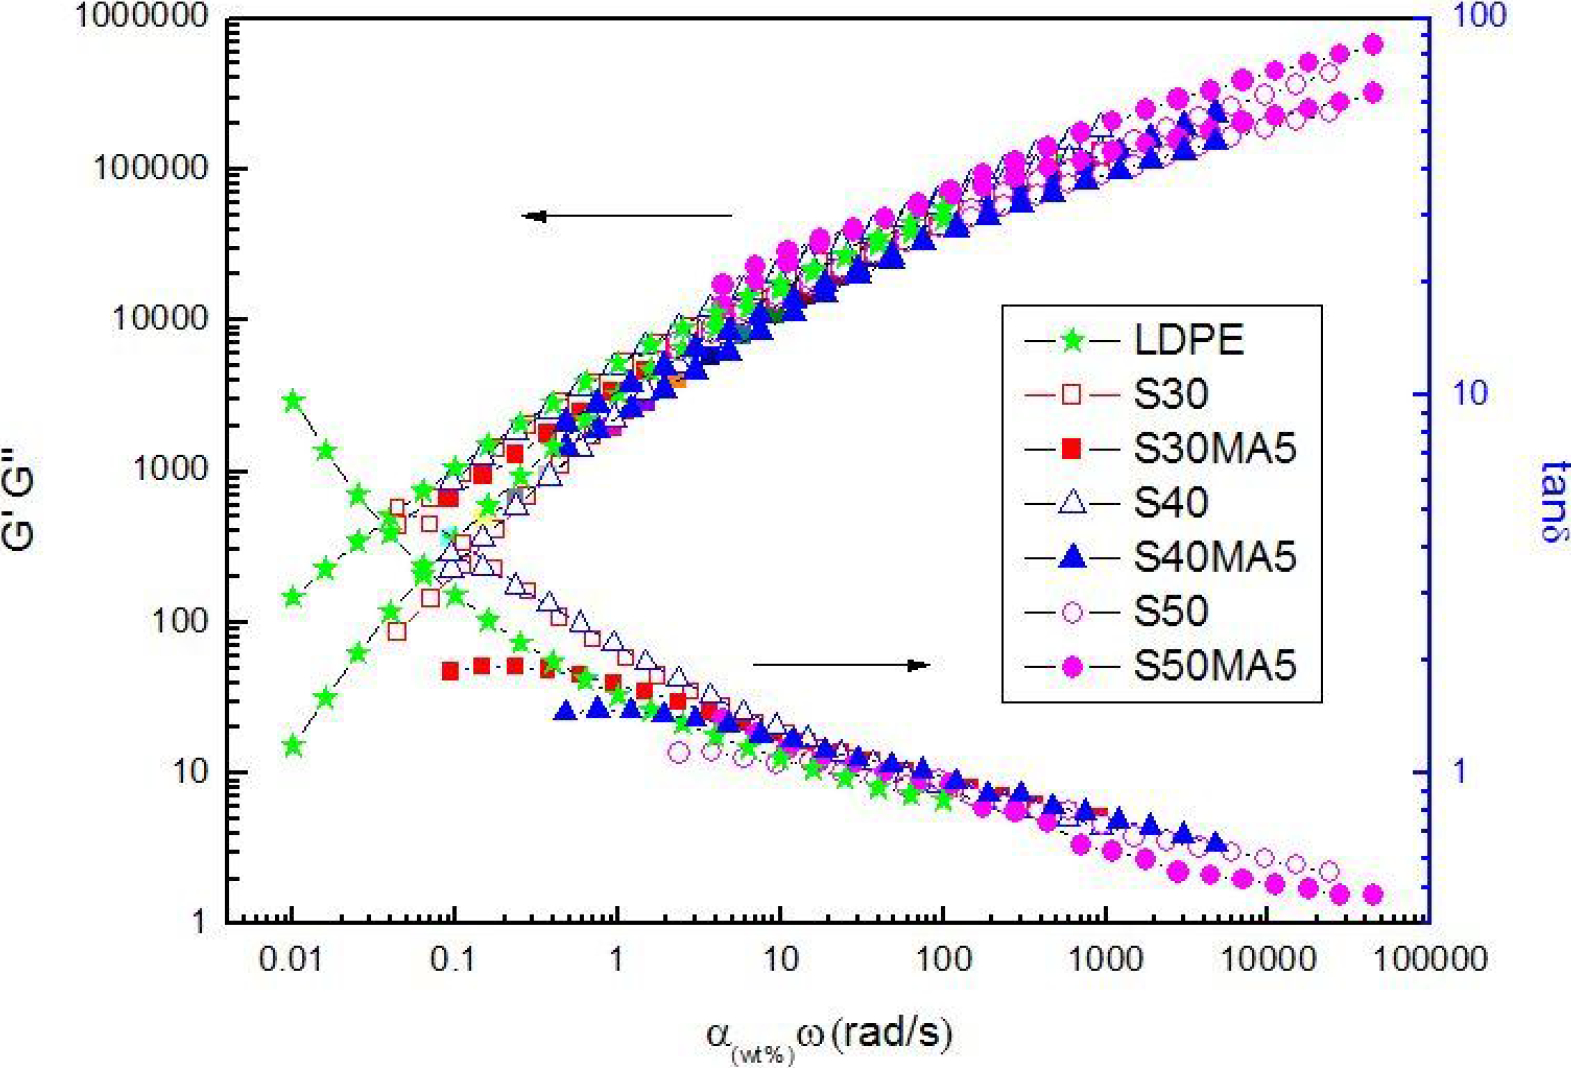
Shifted aster curves of scaled dynamic modulus and tangent of phase angle for LDPE with different SPC samples
Multiscale relaxation spectrum analysis
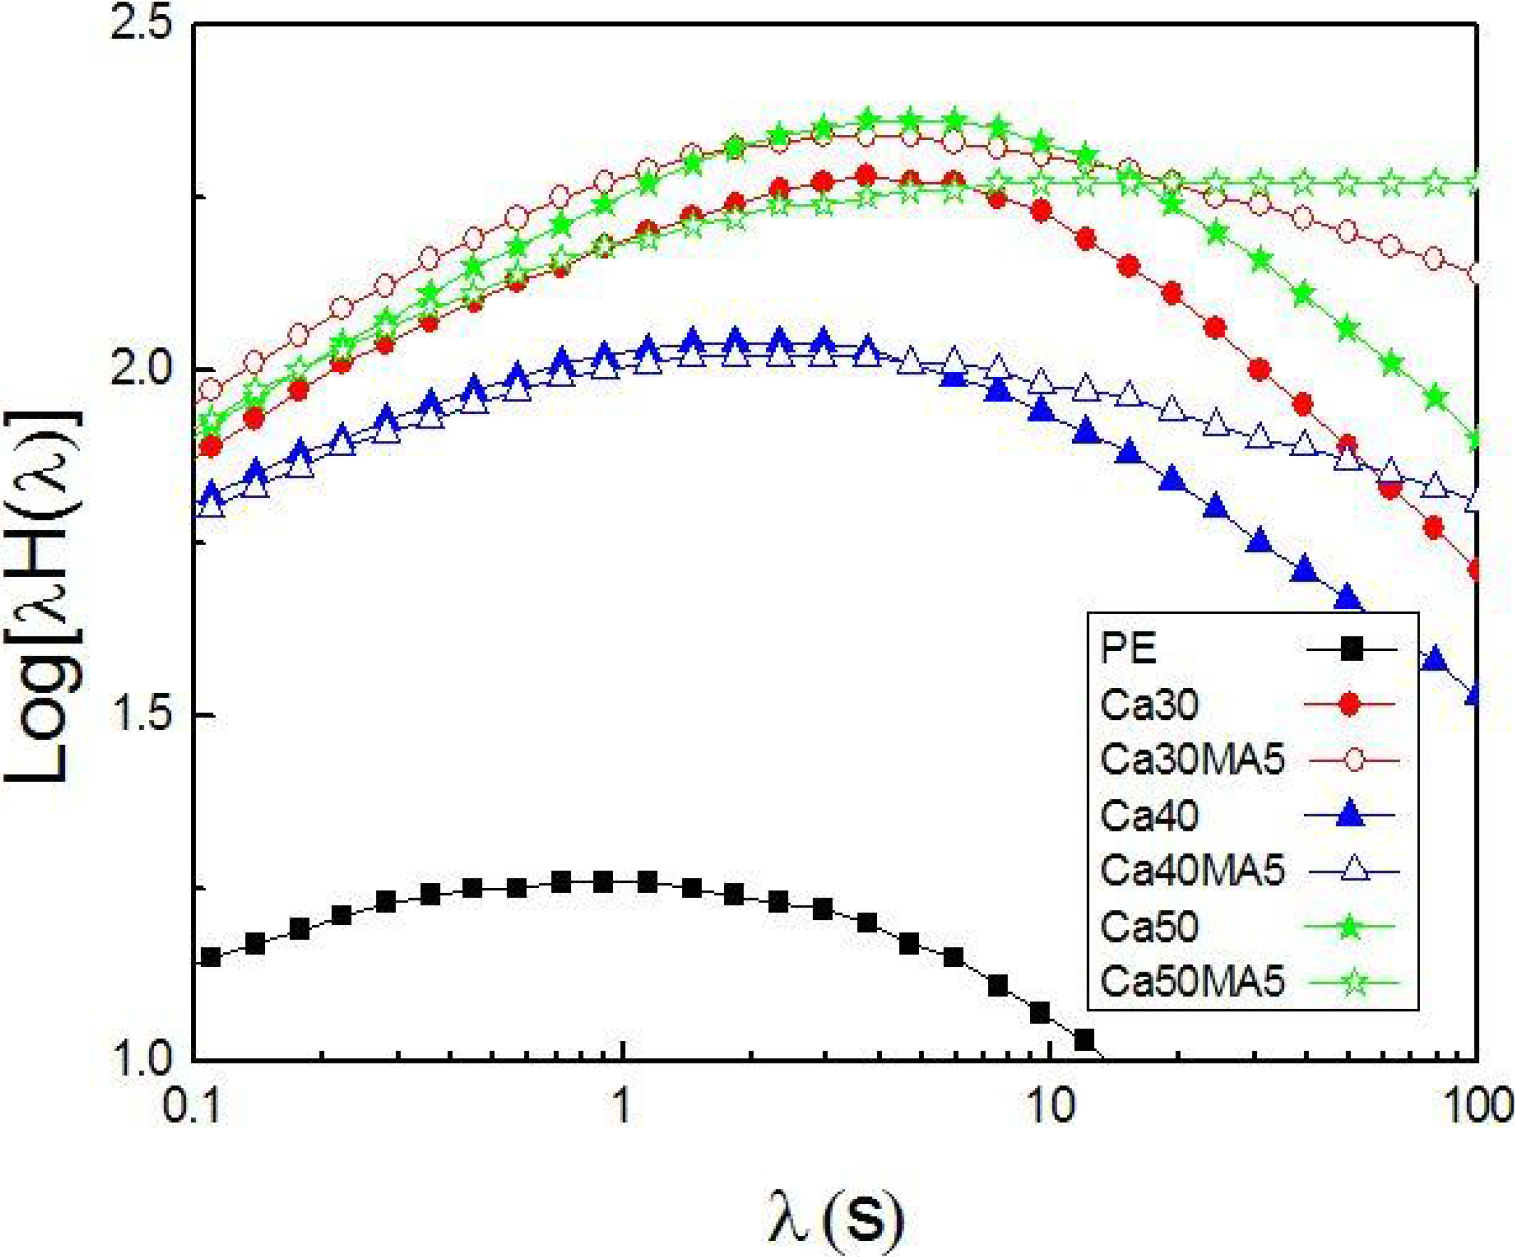
From the Cross model fitting results, we can see the whole system in the relaxation behaviour of observation time, and the SPC sample was a mixture of linear molecules and complicated straw fibre. A new method was applied here to study the multiscale relaxation processes of the internal structure of SPC. This assumption can be validated by the relaxation spectrum of all samples show in Fig. 9. The relaxation spectrum was calculated from dynamic modulus data by the GENEREG programme. 16 The weighted relaxation spectrum shows that the LDPE only had one characteristic relaxation time, which was related to the relaxation process of linear LDPE chains. For the SPC samples, they exhibited an additional longer characteristic relaxation time besides the linear one. Moreover, the SPC sample had two complete relaxation peaks: the relaxation time of the first peak was in the same order of LDPE, which means that this relaxation time corresponds to the time of the matrix in composite; the second peak might express the relaxation behaviour of the internal agglomeration network, which confirms that there were multiple relaxation processes in SPC, as the Cole–Cole plot shows. What's more, the tails of the curves turned up, which also ascribed to the relaxation of the internal complicated network. S10 and S20 samples show that they had only one characteristic time and the time were a little longer than the time of LDPE matrix. After adding compatibiliser, there were two complete relaxation peaks. This is because when the concentration of filler is small, the entanglement and interaction of filler–filler and filler–matrix are both weak so that fillers could not form complicated network and the samples show the relaxation process similar to the linear matrix. The formation of strong network of LDPE–straw fibres in the presence of compatibiliser due to enhanced interaction between LDPE matrix and straw fibre, and the relaxation spectrum shows different and more complicated results. Especially when the concentration of straw fibre was 50 wt%, the two relaxation peaks combined together. It is supposed that when the concentration of filler is too high, the entanglement and agglomeration between filler to filler are aggravation, and at this time, this would be the strong resistance to prevent molecular chains of the matrix to return to the stable conformation. After adding the compatibiliser, a part of the fillers was dispersed to connect with the LDPE, which reduces the resistance so that the relaxation time reduced. This phenomenon was only observed at the 50 wt% content of fillers, and the reason may be that when the straw fibres are below a certain concentration, the entanglement of the filler to filler is a little weak so that the resistance is very small. The effect of the compatibiliser is mainly to combine fillers and polymer. On the contrary, when the straw fibres reach a certain concentration, the compatibiliser plays a role in reducing the resistance of the agglomeration of filler to filler, as the results show. Figure 10 is a weighted relaxation spectrum about calcium carbonate filling LDPE system, which was in contrast to the SPC sample. From the two relaxation spectra, the differences between them were that the calcium carbonate filling LDPE system only had one characteristic relaxation time, and the trend of the curves was roughly the same. The reason may be that although the concentration of calcium carbonate is very high, calcium carbonate is simple inorganic filler that could not entangle and agglomerate so that it does not cause a network between the filler–filler or filler–matrix. So, there is no change of the relaxation process.
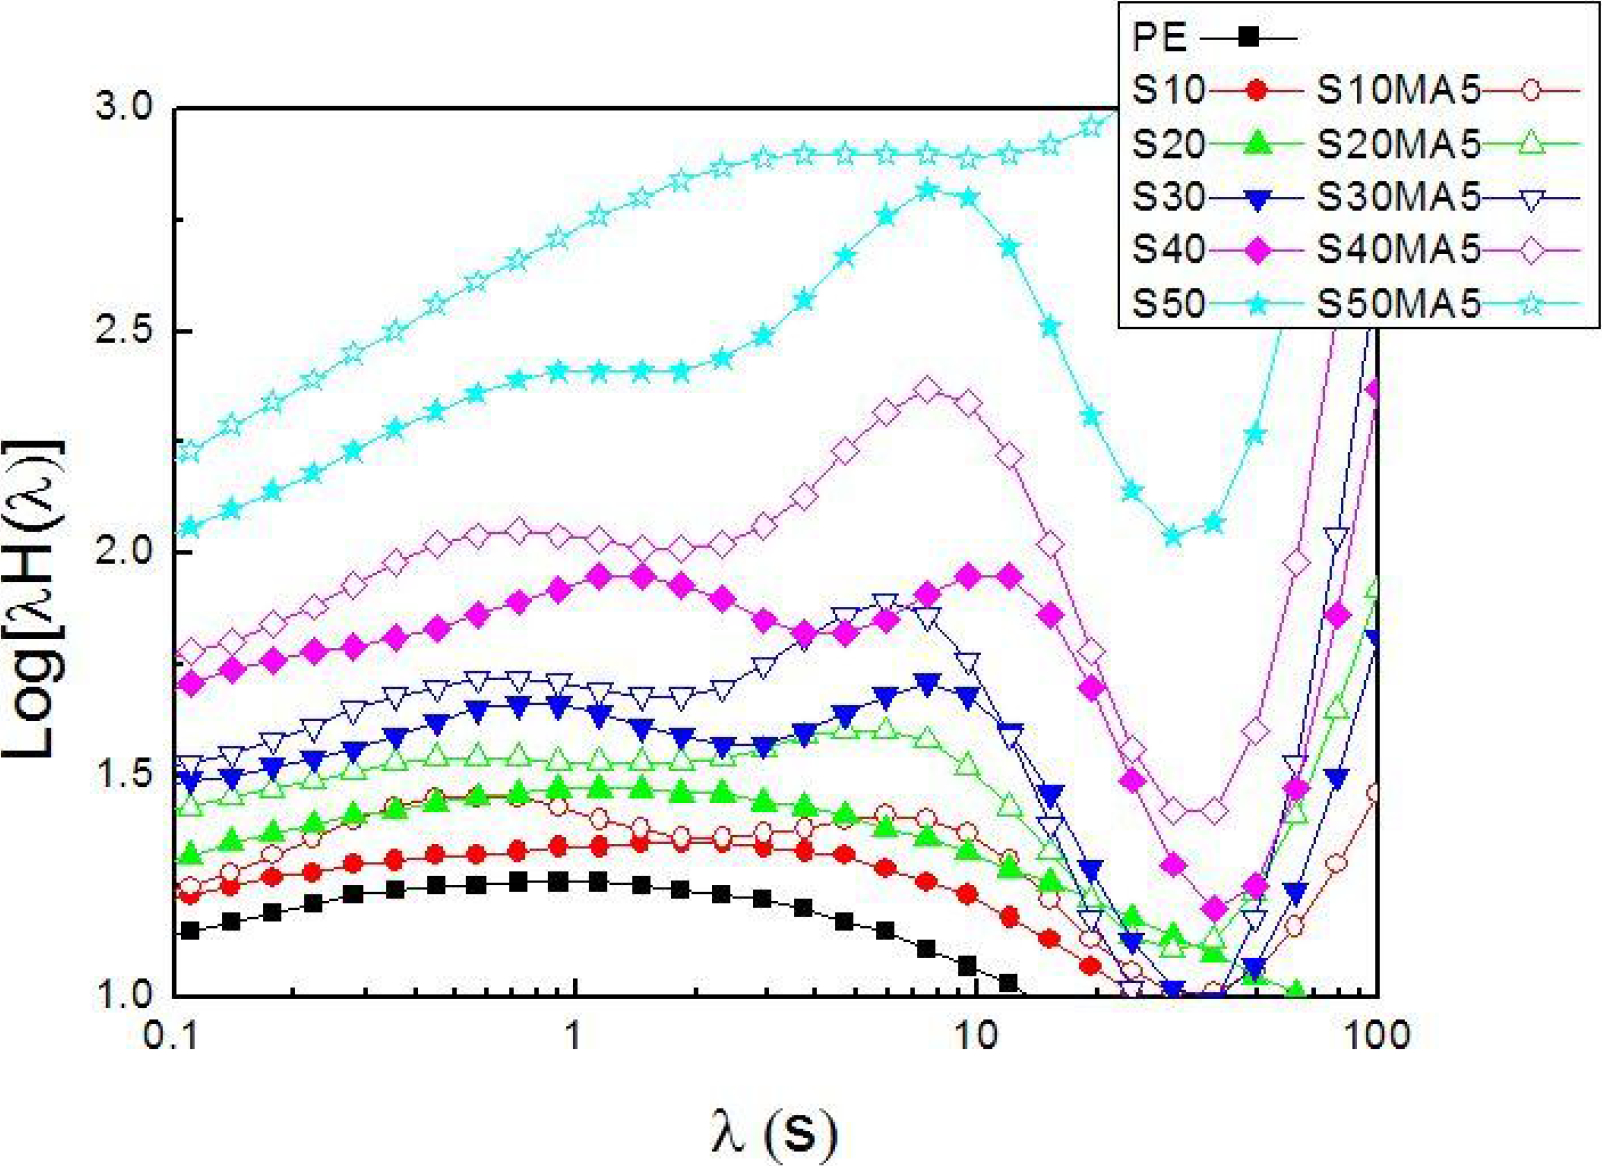
Weighted relaxation spectrum for LDPE and SPC samples
Weighted relaxation spectrum for LDPE and calcium carbonate plastic composites
Conclusions
This study is designed to study the effect of straw fibre content and compatibiliser to the rheological and mechanical properties of straw fibre composites. The addition of compatibiliser improved the tensile strength to twice than the sample without compatibiliser. The dynamic oscillatory results indicated a considerable increase in storage modulus and complex viscosity with increasing straw fibre content, which was also observed after adding the compatibiliser. The rheological behaviour was not the simple linear viscoelastic behaviour anymore. In addition, the compatibiliser promoted the straw fibre dispersion and accelerated the large scale network building at lower filler content, and these were shown in Cole–Cole plot. Furthermore, the weighted relaxation spectrum confirmed the results of Cole–Cole plot. There were two complete relaxation crests, and the tails of curves turned up, which meant that the addition of straw fibre and compatibiliser made the networks form, for example filler–filler and filler–polymer. Especially for the SPC samples of 50 wt-% filler content, adding the compatibiliser combined the two crests to one and the relaxation time decreased gradually. The same consequence with the Cross model fitting results, at 50 wt-% filler content the addition of compatibiliser reduced the relaxation time from 411 to 214 s. Thus, at high filling content of straw fibre composites, the decrease in relaxation time was in the favour of extrusion production of straw fibre composites.
Acknowledgements
The authors acknowledge with gratitude the supports from the National Natural Science Foundation of China (contract no. 51273059) and from the Tribology Science Fund of State Key Laboratory of Tribology of China (Tsinghua University) (contract no. SKLTKF14A09).