
Abstract
This work improves the systematic approach proposed in previous papers, aimed at defining design criteria specific for powder metallurgy (PM) parts subject to wear in application. Dry rolling–sliding tests have been performed on PM steels obtained under different process conditions, and the results have been used as a knowledge base in the proposed design procedure to evaluate the effect of the material variables (porosity and microhardness) and geometrical parameters (contact length) on wear resistance. The failure criterion considered here to ensure the functionality provides to compare the wear thickness with a value deriving from the dimensional tolerances. If the failure criterion is not matched, then a change in the material variables and/or geometrical parameters is proposed. The occurrence of plastic deformation and/or brittle contact at the surface region is also considered. Examples of application show that the most significant improvement is obtained by modifying both material variables and geometrical parameters.
Keywords
Introduction
Many powder metallurgy (PM) steel parts are exposed to wear in application. While the occurrence of failure due to the mechanical stresses is systematically approached in the design step, the damage due to wear is often referred to qualitative and empirical design methods, coming from the experience acquired with wrought steel. These methods do not properly consider the peculiar characteristics of PM steels, which means the porosity and the heterogeneous microstructure resulting from the use of diffusion bonded powders. Therefore, the availability of a guideline for either designing against wear or verifying wear resistance, based on the knowledge of wear behaviour of PM steels, has a practical interest.
A wide literature on wear mechanisms and wear resistance of PM parts exists, first considering the paper published on 1981 by Eyre.1 Porosity affects the wear behaviour by reducing the load bearing surface, by enhancing local plastic deformation and subsequent debris generation and by entrapping wear debris.2– 7 The strain localisation caused by pores is influenced by the microhardness of the metallic matrix.5,7– 9 Heat treatments aimed at obtaining a fully martensitic microstructure increase wear resistance in both diffusion bonded3 and prealloyed8 steels, although the opposite was observed in a Mo steel.10 On the other hand, in the diffusion bonded steels, the poor microhardness of the Fe–Ni areas may decrease the wear resistance.11– 13
The wide amount of knowledge in the literature, however, rarely shows a coherent organisation of the data, which are not systematically used in the design step.
The classical approach of the functional design includes four steps:
In the first step, load, type of relative motion and environment are defined, aiming at individualising the possible damage mechanisms. Based on this analysis, the tolerated amount of wear and the failure criterion are established.
In the second step, the damage mechanisms are described by one or more selected equations, and the values of the design parameters, ensuring that the amount of wear is maintained below the tolerated threshold, are fixed. The empirical coefficients to be used in the models (step iii) depend on the material and on the environment; data can be either found in the literature or determined by specific experiments. Given the specificity and the complexity of wear processes, an experimental validation is needed. Finally, the consistency of the actual wear in application with the model must be verified (step iv).
In previous works,17– 20 a systematic approach to design against wear for PM parts was proposed, aimed at defining specific design criteria, which could help the designer to take into account the influence of the peculiar characteristics of PM components on the wear resistance.
Different materials and wear conditions were considered as sliding19,20 and dry rolling–sliding.17,18
This work carries on the study of PM steel parts subject to dry rolling–sliding wear. In rolling–sliding wear, two wear mechanisms may be recognised: surface fatigue and adhesive–triboxidative wear. The first one is typical in rolling, while adhesion–triboxidation is frequently identified in dry sliding. Surface fatigue usually occurs under lubrication so that, in the case of dry contact, adhesive or triboxidative wear prevail and the phenomenon controlling the life of the parts is sliding.7 In adhesive and triboxidative wear, equation (1), from the Archard law,21 gives the wear rate
To improve the design criteria proposed in previous works for PM parts subject to dry rolling–sliding, this work considers the influence of the material variables affecting the wear coefficient and the hardness in the previous equation: fractional porosity and microhardness. Porosity of sintered parts depends on composition (particularly with respect to the presence of liquid phase forming elements), particle size and morphology, compaction pressure and mode (cold versus warm compaction), sintering temperature and time. For a specific material, the main parameters affecting porosity are compaction pressure and mode, and, within certain limits determined by the part geometry, porosity may be changed by varying these two parameters. Microhardness is also a flexible parameter that can be easily adjusted by changing the graphite content in the powder mix. The influence of both of these material variables will be considered in the proposed design procedure for wear resistant parts.
The experimental data come from a previous work17 and will be briefly summarised in the next paragraph.
Experimental
Steels produced by diffusion bonded powders, differing for Ni content and production schedule, were studied. Their characteristics are summarised in Table 1.
Investigated materials
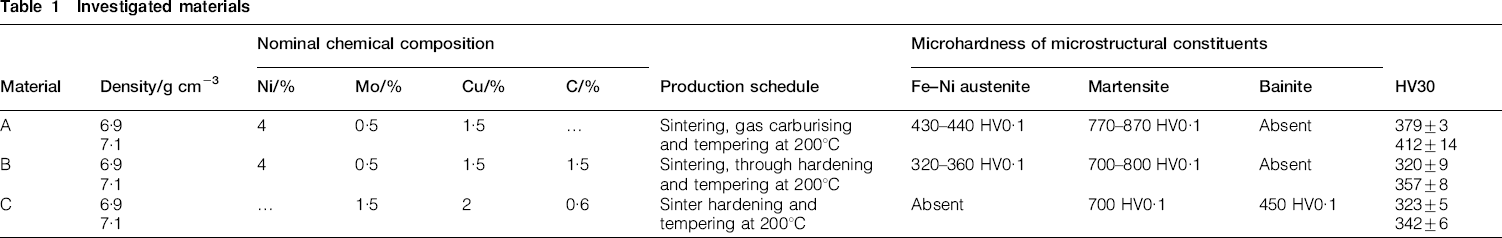
The density was measured by the water displacement method. The microstructural analysis was carried out at light optical microscope both on unetched specimens, to measure the pore size distribution by image analysis (10 images at ×200), and after metallographic etching by 2% nital, to investigate the microstructural constituents. HV0·1 microhardness was measured by carrying out 15 measurements of each sample. In the case of the carburised material (A in Table 1), the microhardness profile was measured and the values reported in Table 1 are relevant to a 50 μm depth from the external surface.
The dry rolling–sliding tests were carried out on an Amsler tribotester using two discs of the same material (40 mm external diameter, 10 mm height, 16 mm internal diameter). Four different loads were applied: 100, 200, 500 and 1000 N, with a rolling speed of 360 and 400 rev min−1 for the two discs, that means a sliding speed of 0·084 m s−1. The friction coefficient was continuously recorded during the tests by measuring the resisting couple on the driving shaft.
The total duration of the tests was 120 min, corresponding to a sliding distance of 600 m. Wear tests were interrupted each at 15 min to measure the mass loss; from that, the wear volume was calculated.
Influence of material characteristics
In the aforementioned test conditions, the prevailing wear mechanism is triboxidative wear at low sliding speed.22 Metallic fragments are entrapped between the surfaces in the contact area and oxidised. Oxide fragments are then pressed into the metallic substrates, forming a hard tribological layer that can increase the load bearing capacity significantly under specific loading conditions. When the load further increases, the wear of the hard tribological layer leads to the formation of fine fragments, with some plate-like ones due to the propagation of brittle cracks on the wear profiles, as shown in Fig. 1.
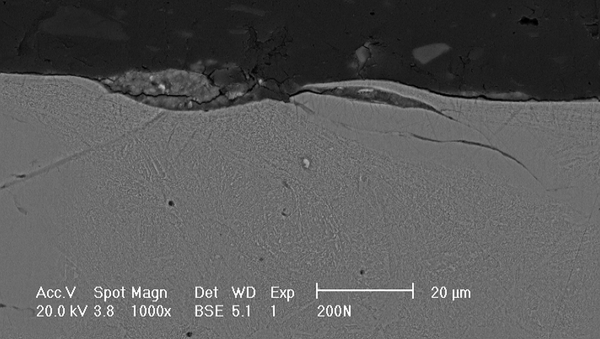
Plate-like fragments due to brittle fracture: 1000 N applied load
To evaluate the influence of the material variables, the wear coefficient K as a function of the mean compression stress P0 was first considered. Figure 2 shows that, for the lowest values of the mean compression stress, the wear coefficient of the Ni containing materials is much higher than that of the Ni free one. This is due to shearing and damage phenomena localised in the Fe–Ni austenite areas,17 which show a lower mechanical resistance than that of the martensitic matrix, leading to a large amount of wear. These phenomena are not observed in the Ni free material. For all the materials, a minimum value for K is observed, corresponding to a specific value for the mean compression stress (275×106 N m−2), which has to be related to the aforementioned generation of a continuous, wear resistant oxide glaze.
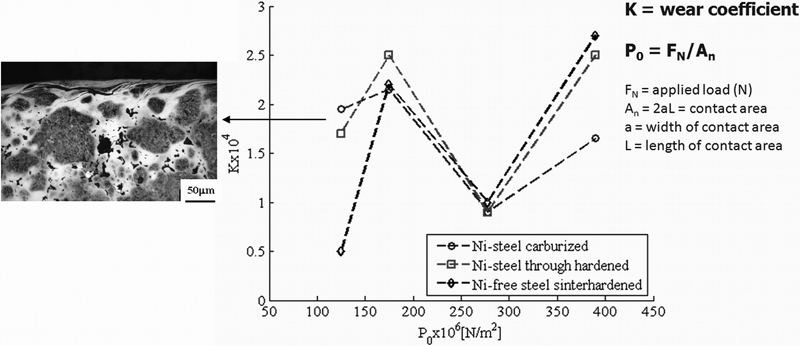
Wear coefficient versus mean compression stress
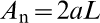
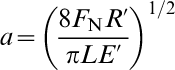
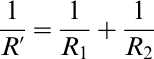
From the designer point of view, this means that the working conditions should reach the value of the mean compression stress corresponding to the minimum wear coefficient. But the mean compression stress is, in turn, affected by the material variables, as can be highlighted considering the following analysis based on contact mechanics.23 The mean pressure P0 is given by equation (3)

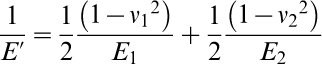
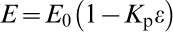
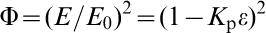
For sintered materials, the elastic constants depend on the porosity. Haynes and Egediege proposed the relation in equation (8)24

It must be considered that surface porosity ϵs is usually larger than the bulk one. The characterisation of the surface profile by means of the Abbott–Firestone curve showed that the following relation between the surface and the bulk porosity exists19,26
All these considerations demonstrate that the mean compression stress depends on porosity. This means that a specific value for porosity will correspond to the mean compression stress, which will lead to the minimum wear coefficient. Figure 3 shows the trend of P0 versus the bulk porosity in the case at study (line contact L = 10−2 m and R1 = R2 = 2×10⁻² m). The dashed areas show the P0 ranges corresponding to the low wear coefficients: 130×106 N m−2 for the Ni free material and 275×106 N m−2 for all the materials.
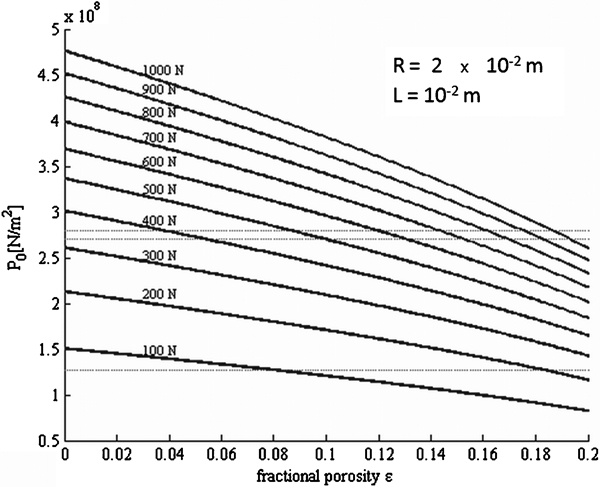
Mean compression stress P0 versus porosity ϵ as function of applied load FN
The curves in Fig. 3 show a slight gradient, which means that P0 varies significantly as a function of porosity within a wide range. According to this diagram, for a given normal force FN, the porosity corresponding to the optimal mean compression stress could be found. However, the change of porosity affects mechanical properties, in particular the load bearing capacity. In the presence of high surface pressures and of shear stresses (due to tangential forces promoted by friction), the phenomenon of plastic deformation at the asperities may occur. It may cause extensive plastic deformation, leading to surface densification. Actually, surface densification increases the load bearing capacity, but it could also damage dimensional and geometrical precision. Equation (13) controls the occurrence of plastic deformation at the surface region5
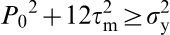
Combining equations (13)–(15), the following relation for the plastic deformation at the surface region is found
Figure 4 represents the curves in equation (16) as a function of porosity in the case at study (L = 10−2 m and R = 2×10⁻² m) for the condition of minimum microhardness through hardened or case hardened steel (5000×106 N m−2) at two different values for the normal force (500–1000 N). The graph related to a higher microhardness (7000×106 N m−2) is also shown.
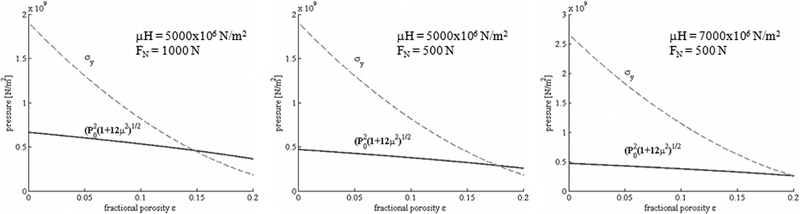
Verification of occurrence of plastic deformation at asperities for different values of microhardness and normal force
Figure 4 demonstrates that the occurrence of plastic deformation at the asperities must be carefully verified, given that it could not be excluded a priori in the conditions and porosity ranges considered in this study. In particular, it may be observed that plastic deformation occurs for fractional porosity exceeding 0·15 in the worst conditions considered here (lowest microhardness, highest normal force). It is shifted to a higher fractional porosity (0·18) on decreasing the normal force and even more (∼0·2) on increasing microhardness.
A last check implies to verify the occurrence of brittle fracture, particularly when microhardness is increased to improve wear resistance. This kind of contact is controlled by equation (17)

 is the maximum surface tensile stress and σf is the resistance to brittle fracture. Equation (17) becomes equation (18) for porous materials
In a previous work, the effect of microhardness on tensile behaviour of porous sintered steels was demonstrated. A brittle fracture is induced by pores when microhardness increases above a threshold, since pores act as preexisting cracks,31 and the critical defect size for the brittle fracture can be assumed as the size of the largest pores in the load bearing section. The same approach may be followed in the study of wear, so that the critical defect size in equation (18) may be assumed as the size of the largest surface pores. This size can be measured by image analysis on the metallographic sections along the whole extension of the wear surface.
To exclude the occurrence of brittle fracture, it should be verified that c is larger than the maximum pore size expected in the parts.
Once the tribological system has been designed to minimise the wear coefficient, by imposing the ‘optimum’ P0, and the possibility of occurrence of plastic deformation and/or brittle fracture has been verified, the wear thickness can be calculated with equation (2). It has to be compared with a maximum allowable wear thickness, which can be defined with reference to the tolerance required for the dimension perpendicular to the surface exposed to wear (hl).
All these considerations may be collected in a design procedure, described in the following paragraph.
Design guidelines
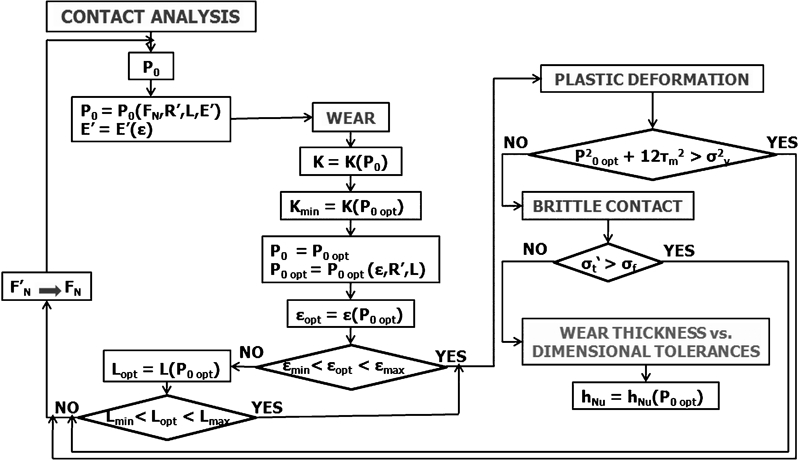
In the following description, block letters are used in the text to allow an easy identification of the relevant sections in the diagram. First, the contact analysis is provided and the main parameters are determined, related both to the geometry and to the material. These initial steps in the design procedure are summarised in Fig. 5. Concerning the wear resistance, the value of the mean compressive stress related to the minimum wear coefficient Kmin, P0 opt, is derived. Specific values for porosity (material variable) and contact length and curvature radius (geometrical parameters) correspond to P0 opt. It is then necessary to verify if these values are acceptable, for instance, for what concerns the mechanical resistance. The porosity value is compared with an acceptable interval: if it belongs to, the procedure goes on to verify the possibility of occurrence of plastic deformation; if it does not, the procedure considers the change of the geometrical parameters. The change in contact length is hypothesised, given that it implies less modification than the change in curvature radius. Again, this contact length is compared to an acceptable interval, and again, if it belongs to, the procedure goes on to plastic deformation verification. If it does not, in the hypothesis that the curvature radius could not be modified, the contact conditions have to be revised and a new value for the applied load must be considered. This is necessary also in the case of plastic deformation or brittle contact occurrence. Otherwise, the procedure can go on to verify the wear thickness versus the maximum allowable thickness related to the tolerances required for the dimension perpendicular to the contact surface (wear thickness versus dimensional tolerances, the steps of which are shown in Fig. 6).
Scheme for design procedure: part 1
Scheme for design procedure: part 2
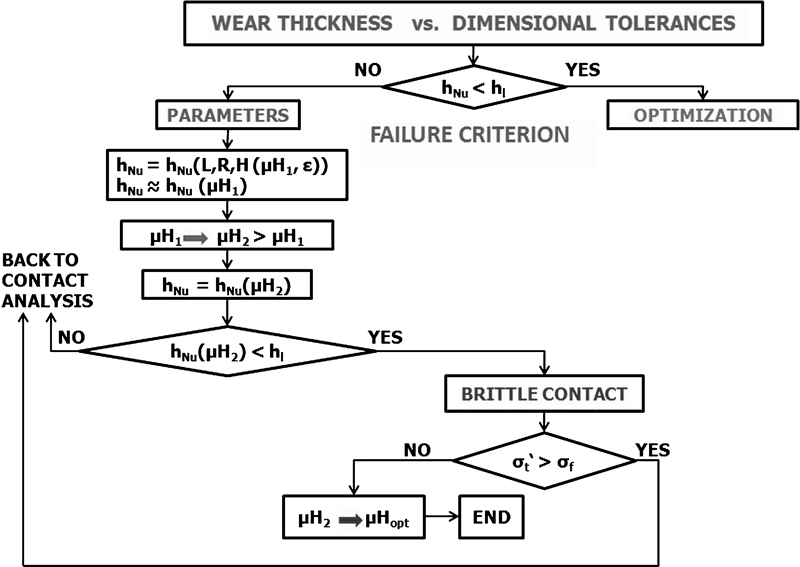
Figure 6 summarises the next steps in the design procedure. The failure criterion now provides to verify if the wear thickness corresponding to P0 opt (hNu) is lower than that derived from the dimensional tolerances (hl). If it is not, then the parameters determining the wear thickness are considered. Most of them cannot be changed (those corresponding to P0 opt), but microhardness still could be enhanced. Therefore, a higher value of microhardness is hypothesised, and it is verified if the corresponding wear thickness is lower than the allowable one. If it is still not, then the procedure goes back to contact analysis. If the failure criterion is now matched, the possibility of occurrence of brittle contact must be verified once more, being it related to the microhardness. If no brittle contact is verified, the procedure comes to an end, given that all the geometrical and material variables corresponding to the minimum wear coefficient have been determined. If brittle contact occurs, the procedure goes back to contact analysis. All of these occurs if wear thickness does not match the failure criterion. If it does, then further modifications oriented to optimisation may be possible, the steps of which are shown in Fig. 7.
Scheme for design procedure: part 3
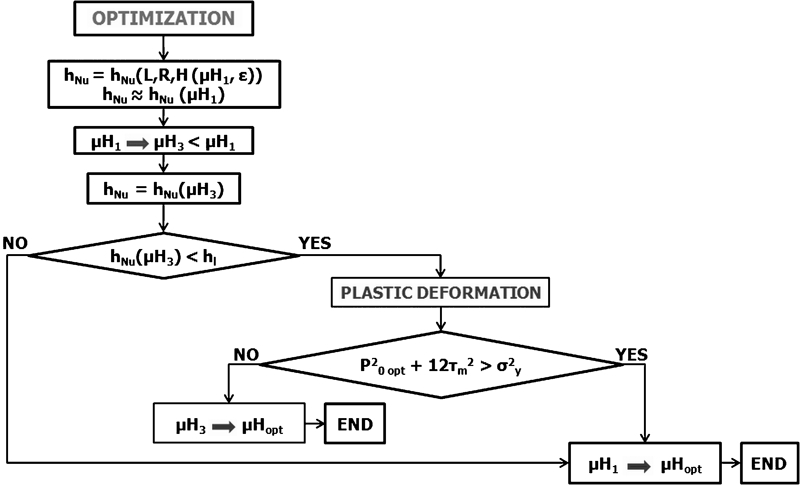
The last steps in the design procedure are summarised in Fig. 7. The last part of the design procedure provides to check if some optimisation is possible, considering a lower value of the microhardness. If the corresponding wear thickness still matches the failure criterion, then the possibility of occurrence of plastic deformation must be verified again. If no plastic deformation occurs, then the procedure comes to an end, given that all the geometrical parameters and the optimised material variables corresponding to the minimum wear coefficient have been determined. Otherwise, no optimisation is possible and the previous, higher value of microhardness must be considered. This also happens if the wear thickness corresponding to the lower value of microhardness does not match the failure criterion. However, again, the procedure comes to an end.
Some examples of application may help to clear the proposed design procedure.
Examples of application
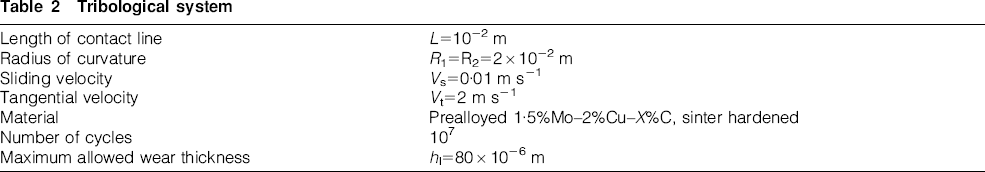
To test the proposed procedure in the design of wear resistant parts, the case of a cam is considered and some examples are presented. The contact conditions are reported in Table 2. The maximum allowed wear thickness is derived considering an ISO class IT 10 for the requested tolerance on the dimension perpendicular to the surface exposed to wear.
Tribological system
Example 1
Figure 8 describes the application of the proposed design procedure when the working conditions are those summarised in the frame on the left: the combination of the normal force and porosity leads to a mean pressure of 350×106 N m−2, which is higher than the optimum one. Therefore, according to the diagram in Fig. 8, it is considered the value for the fractional porosity of 0·17, which corresponds to the optimal mean pressure of 275×106 N m−2 and, in turn, to the minimum wear coefficient. No plastic deformation occurs, as can be observed from the diagram on the right corner of Fig. 8. However, by equation 16, there is a risk of brittle contact, given that the critical defect size is 110 μm, which may be comparable to large pores occurring in a sintered material with 6·4 g cm−3 density.
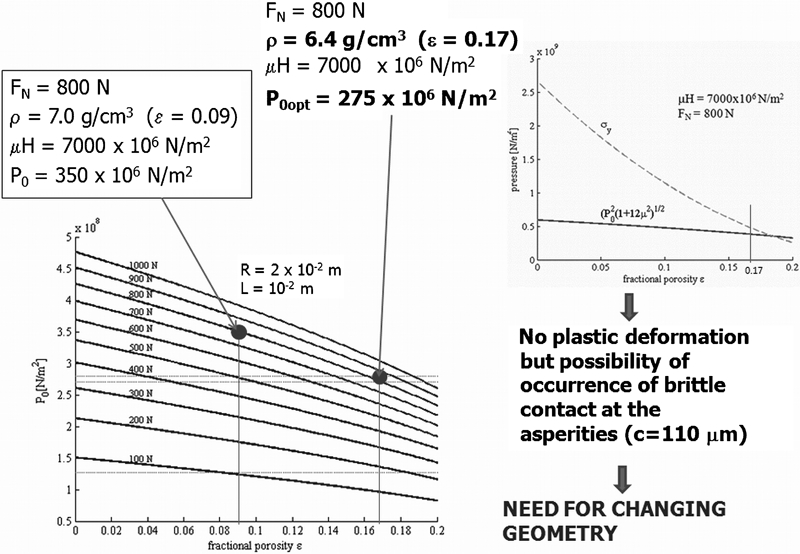
Example of application 1: change in material variables
A change in the geometry is thus considered increasing the contact length, as shown in Fig. 9. The diagram P0 versus ϵ is given for a new contact length (1·2×10−2 m). The new mean pressure is lower than in the previous case (320×106 versus 350×106 N m−2), as well as the fractional porosity relevant to the optimum mean pressure (0·14), and this is also good for mechanical resistance. No plastic deformation occurs, as can be observed from the diagram on the right corner of Fig. 9. Moreover, by equation (16), there is no risk of brittle contact, given that the critical defect size is 390 μm, which is larger than the largest pores occurring in a sintered material with 6·6 g cm−3 density. Wear thickness is calculated, but the failure criterion is not matched. A change in microhardness, always maintaining the modified geometry, is thus considered, as shown in Fig. 10.
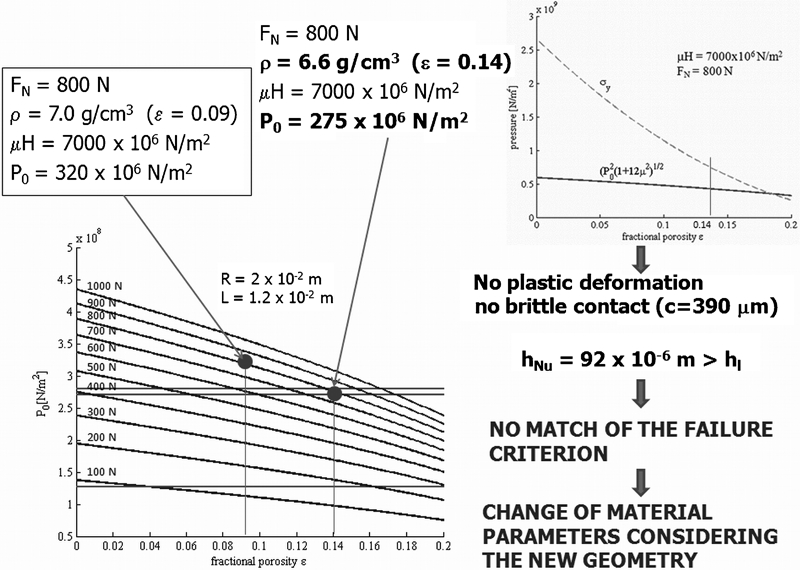
Example of application 1: change in material variables and geometry
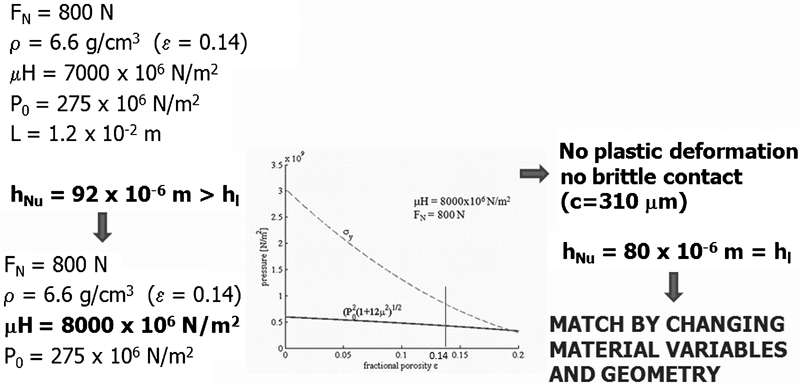
Example of application 1: change in material variables and geometry matching failure criterion
It may be observed that the failure criterion is matched considering both modifications in material variables (porosity and microhardness) and in geometry. Neither plastic deformation nor brittle contact occurs.
Example 2
Figure 11 describes the application of the proposed design procedure when the working conditions are those summarised in the frame on the left: the combination of the normal force and porosity leads to a mean pressure of 230×106 N m−2, which is lower than the optimum one. Thus, according to the diagram in Fig. 11, the value for the fractional porosity 0·09 is considered, which corresponds to the optimal mean pressure of 275×106 N m−2 and, in turn, to the minimum wear coefficient. No plastic deformation occurs, as can be observed from the diagram on the right corner in Fig. 11. Moreover, by equation 16, there is no risk of brittle contact given that the critical defect size is 350 μm, which is larger than the largest pores occurring in a sintered material with 7·0 g cm−3 density. Wear thickness is calculated, and the failure criterion is matched.
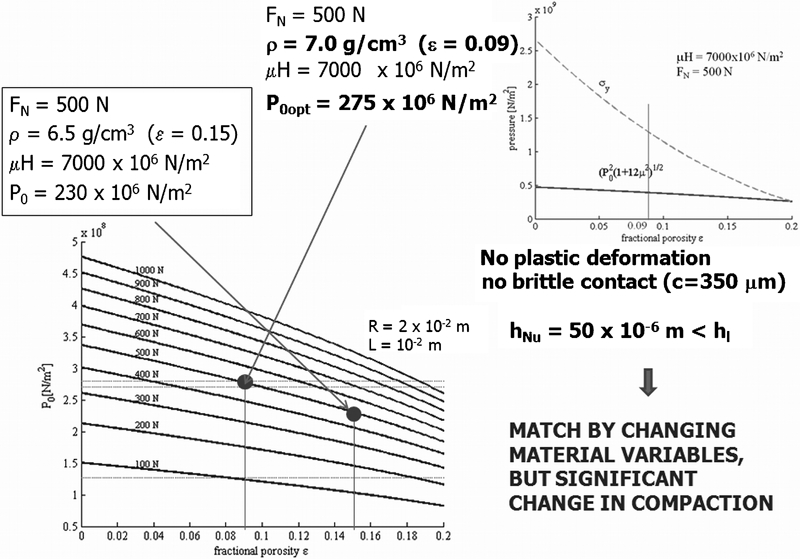
Example of application 2: change in material variables
It must be observed that, according to the diagram in Fig. 11, the fractional porosity corresponding to the minimum wear coefficient in the working conditions is 0·09, which means that density has to be increased up to 7·0 g cm−3. As an alternative, an increase in the fractional porosity up to 0·25 would decrease the mean pressure down to 120×106 N m−2, to which a very low wear coefficient corresponds (Fig. 2), but the resulting density would be too low.
On decreasing fractional porosity down to 0·09, wear thickness decreases and the failure criterion is matched, but the density is significantly higher and should imply a considerable change in the compaction strategy. Therefore, a change in the geometry is considered, as shown in Fig. 12.
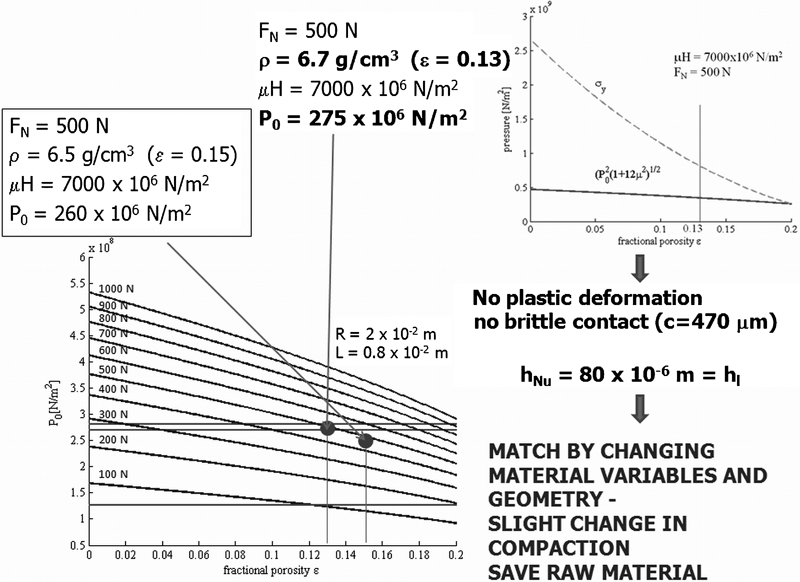
Example of application 2: change in material variables and geometry
The diagram P0 versus ϵ is given for a new contact length (0·8×10−2 m), shorter than the previous one. The new mean pressure is higher than in the previous case (260×106 versus 230×106 N m−2), as well as the fractional porosity to obtain the optimum mean pressure (0·13 versus 0·09). No plastic deformation occurs, as can be observed from the diagram on the right corner of Fig. 12. Moreover, by equation 16, the risk of brittle contact is even lower than the previous one, given that the critical defect size is 470 μm. Wear thickness is calculated, and the failure criterion is still matched.
It should also be observed that the density value is now not so different from the initial one, so that just a slight change in the compaction strategy is required (according to the different height of the part). Moreover, being the part thinner, some raw material is saved.
Conclusions
This work improved the guidelines proposed in previous works to systematically approach the design against wear of PM parts. The results obtained from dry rolling–sliding tests performed on different PM steels have been organised to build up a knowledge base, which could be used in the design step to consider the effect of the material variables (porosity and microhardness) and geometrical parameters (contact length) on wear resistance.
Corresponding to the minimum wear coefficient, an ‘optimum’ value for the mean compression stress has been identified, which is affected by porosity and geometrical variables. The intervals of porosity ensuring the ‘optimum’ mean compression stress considering different loads and contact length have been derived, and the need to verify the occurrence of plastic deformation and brittle contact has been provided. The functionality of the part is ensured by a failure criterion, which compares the wear thickness corresponding to the working conditions and a value derived from the tolerance requested for the dimension perpendicular to the wear surface. If the failure criterion is not matched, a change in the material variables and/or geometrical parameters is hypothesised and the procedure is repeated recursively.
Different examples show the procedure application, highlighting how the most significant improvement can be obtained by modifying both material variables and geometrical parameters. This approach could also be considered in case of boundary lubrication, as will be studied in further work.
Footnotes
Acknowledgements
The authors are grateful to Dr W. Pahl (GKN Sintermetals) for providing the specimens.