
Abstract
We experimentally obtain and analyse green density distribution in stainless steel compact samples and investigate the effect of compaction pressure on sample green density and density distribution. Experimental measurements of local density of stainless steel samples are conducted using scanning electron microscopy. For design purposes, the measured local densities, depth and planar location and compaction pressure are used to train an artificial neural network model to estimate the compaction density as a function of input parameters. Material parameters obtained experimentally are used to calibrate a finite element model. The results show that the artificial neural network and finite element modelling approaches are feasible and could be used in predicting the overall compaction density variations in powder metallurgy components. It is observed that the overall compact green density increases almost linearly with compaction pressure. Phenomena of particle interlocking and cold welding are observed and discussed.
Keywords
Introduction
Powder metallurgy (PM) products are used in a variety of specialty applications, such as automotive and aerospace parts and also household appliances. Powder metallurgy is quite economical and suitable for batch production of parts with complex shapes. Powder metallurgy is a flexible method compared to conventional manufacturing methods such as casting, extrusion, forming or forging techniques, which are the conventional methods of manufacturing.1 In PM process, a powdered material is first pressed into a desired shape (green or cold compaction) and then heated to bond the material (sintering).
The importance of the cold or green compaction process can be viewed from two aspects. First, the green compaction process is an important stage in PM, since the pressing characteristics directly affects other processes such as sintering and the product density and strength. In addition, density control is essential to ensure dimensional conformity after sintering. Second, in some applications, it is desirable to use porous parts that allow absorption and diffusion of liquids such as oil, and cold compacted parts are good candidates. As a result, this work is focused on the cold compaction process and the density distribution within a compact.
Coube and Riedel2 studied powder die compaction with emphasis on cracking of samples and green density distribution. Using a finite element (FE) approach, they modified the Drucker–Prager cap model. Finite element modelling is a versatile approach to investigate the distribution of local parameters within the sample as well as overall effects. Coube and Riedel2 described the formation of cracks during various stages of part production and handling. Their model required several parameters, which were determined from measured green strength values of iron powders. The model was also used to explore the risk of cracking in various conditions. In another study, the rate dependence of PM parts using two distinct material model of Fleck–Kuhn and modified version of Fleck model was investigated.3 In another work, two material models of Shima–Oyane and Fleck–Kuhn were employed using FE method,4 where Coulomb friction with zero adhesion and as the effects of viscoplasticity and adiabatic heat generation were considered. It was found that a large density gradient exists at sharp corners, suggesting that a three-dimensional model would result in more realistic prediction of mechanical properties of compacted components.
Korachkin et al. 5 measured Young's modulus and tensile failure properties of green compact alumina, zirconia and Distaloy AE powders in a series of experiments, using an instrumented die. They found that the die dilation at high pressures affects the Young's modulus of powder components. It was also found that the unconfined compression of a cylindrical compact leads to a lower modulus in comparison with the instrumented die test. This was attributed to the removal of confining and frictional effects at the die wall. Modulus data obtained from three-point bending were lower than that obtained from the unconfined compression test.
In another pertinent study, Briscoe and Rough6 explored some of the effects of the alumina powder die wall friction, the compact aspect ratio and the ultimate applied compaction stress on the green density of samples. It was shown that the average density of wall lubricated specimen was higher than that of non-lubricated wall specimen. The powder compaction was also modelled by the FE method incorporating a non-linear elastic constitutive material.
Park et al. 7 simulated three types of duplex compaction of zirconia powder, employing FE method using a backward Euler method and a yield criterion, which can describe the densification behaviour of ceramic powders. They examined the effects of two parameters in the yield criterion on the uniaxial compaction curve. The calculated shape of duplex compacts and density distribution showed good agreement with experimental results. It was found that a height difference between inner and outer compacts after combination disappears by friction force reduction.
Zhang et al. 8 simulated the densification and creep behaviour of stainless steel powders. The appropriate material model was implemented in ABAQUS FE software through a user subroutine code. Their approach was based upon the continuum theories of elastic and non-linear viscous deformation of porous bodies. The non-uniform density distribution of the green compact was considered as an initial condition for the FE model. Grain growth, gravity, thermal expansion, thermal conductivity and other factors were also considered in the simulation. Several applications were performed, and the simulation results of axial shrinkage and density distribution changes were compared before and after sintering. Dec et al. 9 reviewed models relating basic properties of the feed material, roller press design and its operating parameters. These methods were compared in terms of efficiency and accuracy of predicting the course of basic process variables like nip angle, pressure distribution in roll nip region, neutral angle, roll torque and roll force. In a recent study, experimental and FE analysis was performed on cold compaction of titanium powders. The effect of pressure and sample aspect ratio was investigated on the green density.10 A benchmark experimental and numerical study on the compaction density of ferrous parts was performed by Häggblad and Oldenburg.11 The prediction of density variation was consistent when using different simulations.
Application of artificial neural networks (ANN) is increasing in engineering problems. In this complex statistical method, based on an existing experimental dataset, a neural network is trained that can estimate an output based on the input parameters. This allows the designer to select appropriate design parameters in order to obtain desired output parameters such as mechanical properties of the PM parts. Artificial neural network performance is similar to a correlation obtained based on regression analysis, which can express the behaviour of a dependent parameter as a function of several input variables. Compared to simple correlations, a well trained neural network can more accurately estimate the response, but the functionality of an ANN is not known to the user. In a study on the application of neural networks in sintered PM parts, the training input parameters were the compact pressure, particle size, etc.12 The network was trained such that it could predict the sintered density of manufactured parts. In another similar study, Khorsand et al. 13 studied the effect of heat treatment duration and temperature on the mechanical properties of the compacted steel powders with various densities. The data obtained from experimental work were used to train a neural network for future predictions of hardness when the heat treatment conditions were given to the model. There is no ANN study on the green compaction of PM parts.
Based on the forgoing literature review, and given that the green density is an important parameter in emerging PM parts, our aim is to further study green compaction density and void distribution using experimental, statistical and numerical approaches. In the lack of sufficient experimental work on green density, more physical insight is gained from the experimental work. Furthermore, the predictive capability of neural networks and FE methods in determining the green density variation in PM of stainless steel parts is investigated. There is currently no neural network study on green compaction of PM parts, and the FE studies are limited. Moreover, there is no experimental work on cold compaction of steel powder. This paper consists of three parts: first, the experimental method and green density measurements are presented; second, a neural network model is constructed and its predictive capability is discussed and finally, the FE prediction of average density is examined.
Materials and methods
In this study, 15 stainless steel samples were manufactured out of stainless steel 316L powder with a median particle size of 25 μm. All samples had identical cross-sectional dimension of 12·725×31·75 mm with three different thicknesses (heights) of 10, 15 and 20 mm. The powders were compacted using five pressure settings. The lowest density was selected such that the resulting green sample would hold together after pressing. The die had a cross-section of 12·725×31·75 mm, which is the standard size used for a transverse rupture bar as in ASTM B925. There was no admixed lubricant in the powder; DuPont Vydax AR, a fluorotelemer, diluted 10∶1 in DuPont Vertrel FX was used as a die wall lubricant. This mixture evaporates and dries very quickly. The die was swabbed between each compaction. The data shown in Table 1 are the experimentally measured overall (bulk) green density for each sample compressed at a given pressure. The samples were manufactured and generously donated by Powder-Tech Associates, Inc. (North Andover, MA, USA).
Sample specifications (sample length = 31·75 mm and sample width = 12·725 mm)
Final bulk densities were estimated from the compressibility data; the volume of each sample was used to calculate the required powder quantity. The compaction die was mounted in a small spring loaded holder to provide an ejection force after compaction. During compaction, the die floats down on the springs and results in equal compaction of the part, on the top and bottom surfaces. The powder was then compacted using a predetermined pressure. The die lubricants tend to contaminate the specimen surfaces. This was observed in all samples fabricated for this work. Thus, for achieving a clean surface, all samples were cleaned by acetone in order to remove the punch surface lubricant that was applied on the punch surfaces to facilitate the easy ejection of samples. Furthermore, all samples were polished using abrasive paper no. 4. The polishing was performed using a belt sander adjusted to a low speed.
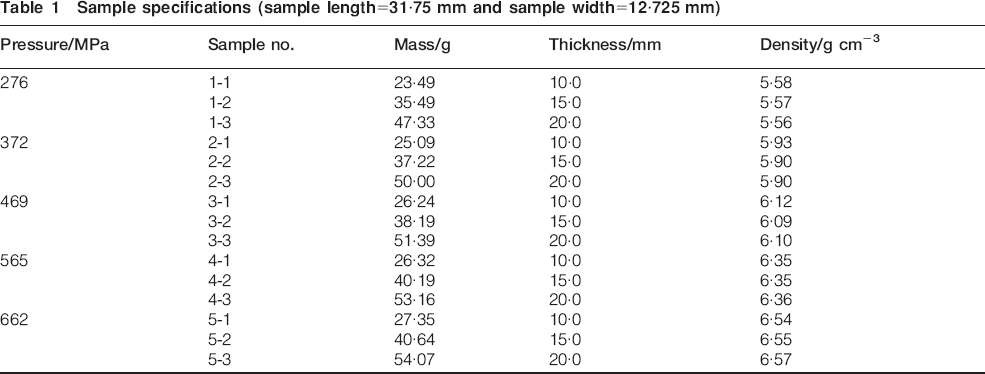
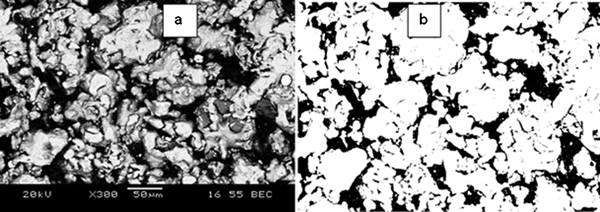
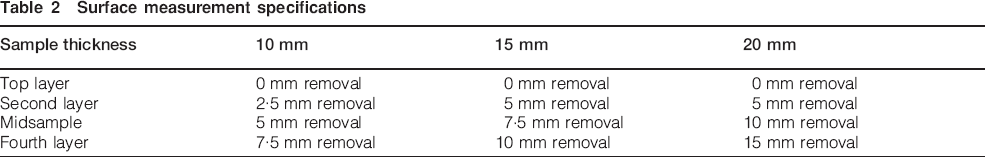
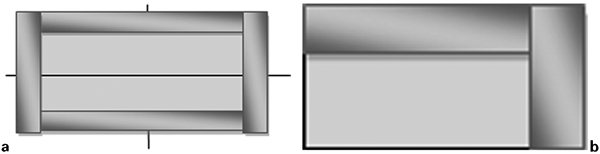
The surfaces of these samples, obtained after compression, were examined using a scanning electron microscope (SEM) (JSM-6380LV). Owing to inadequate strength of the green compact, the sample preparation for SEM was challenging. Figure 1a shows a typical SEM image of green compacts made from stainless steel 316L powder. The figure shows widespread deformation of the powder particles together with evidence of extensive particle interlocking and void area. The surface morphology, microstructure and density were evaluated by image analysis of individual SEM images (Fig. 1b) of the top surface and three sublayers (Fig. 2). After the analysis of the top surface, the sample surface was ground to reduce the thickness, and then similar surface analysis was conducted (Fig. 2). In order to remove the desired amount of material, each sample was polished using the same belt sander. While polishing the samples, it was observed that sizable parts of the material were being removed. As a result, it was challenging to obtain smooth surfaces needed for density analysis. This was due to the inadequate strength of the specimen as the samples were not sintered. Nevertheless, the main structure of the samples remained intact. Sintering of samples would strengthen them, but it would also affect our objective, which was the analysis of green compacts. Table 2 shows the sample size and the amount of material removed for each subsequent measurement. Throughout this work, the layer designation outlined in Table 2 is used.
Images (SEM) of samples surface
Pictorial representation of location of relative density measurements: average of three measurements on lateral axis of specimen was taken; five readings were taken along longitudinal axis of each specimen
Surface measurement specifications
For each layer of sample, 15 SEM images were digitised and processed to identify the void and filled parts of the surface.14 In order to estimate the local green density, three SEM images were taken beside the die wall (on the sample edges) on both sides of the sample, three images at the samples centres and three images between the two above mentioned spots, i.e. at equal distances away from the die wall and the sample centre, at both sides of the centre. These measurements were taken in three layers: the top surface (surface that is in contact with the punch), equal distance from either side of both top and bottom surfaces and the midsample surface. For the calculation of local densities in these 15 points, the density of bulk stainless steel 316L, which is 7·99 g cm−3, was multiplied by the fraction of the filled area (Fig. 1b). For some cases, energy dispersive spectroscopy tests were performed on the samples to identify the composition of dark and bright spots. Energy dispersive spectroscopy results showed that the dark areas are mainly void, whereas the bright areas are compacted particles. To study the distribution of the voids in the specimens, the SEM images were exported to MATLAB. The average density at a specific layer and at a specific pressure of the sample was calculated by averaging over the 15 readings of local densities on that specific layer.
Results and discussion
Experimental observations
Density data obtained from the analyses of the SEM images of the middle layer (Fig. 2) of three thick specimen compacted at 372 and 565 MPa are shown in Fig. 3. It is observed that the density in the vicinity of the sample corners and edges is smaller than that in the rest of the compact. The edge zone could be potentially detrimental, since cracking is more likely to be initiated from this region. Similarly, Fig. 4 displays the variation of local green density along the longitudinal axis of the sample for five compaction pressures for sample height of 2 cm. It is expected that the sample green density increases with an increase in the die compaction pressure. However, for the examined surface layer, no correlation is found between the local densities and the compaction pressure. Later, a correlation is obtained between the overall density and the compaction pressure. Figures 3 and 4 also show that the green density is somewhat symmetric about the central axis, which is expected owing to the symmetry of the samples and the manufacturing process. In some cases, e.g. Fig. 3b, peculiarities are observed perhaps due to uncertainties and errors in the density measurements or manufacturing.
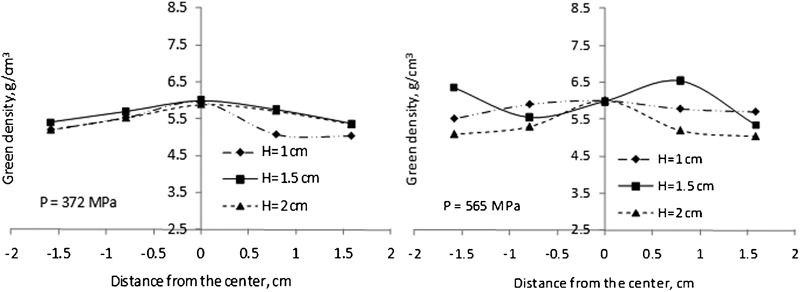
Variation of local green density along longitudinal axis of samples for three sample heights (middle surface) at two compaction pressures
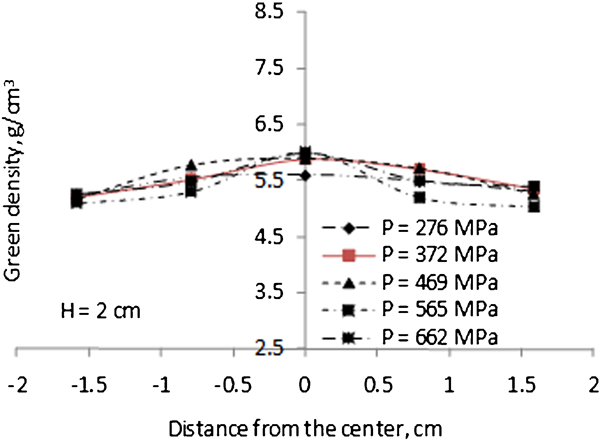
Variation of local green density on middle layer along longitudinal axis of samples at given sample height for five compaction pressures
Our observations showed that, at low compaction pressures, porosity is present in the samples but powder interlocking is negligible. The occurrence of high density and/or strength in the unsintered state does not necessarily equate to good machining characteristics. At higher values of green density, particle rearrangement is considerably less and the particles in contact are already plastically deformed. For the range of parameters considered in this paper, non-homogeneities in the density distribution obtained during filling and transfer only have a small effect on the final density distribution in the compacted component.
One measure of the sample quality and uniformity is the distribution of voids. This is particularly important since it shows the effect of friction between the particles and how the particles flow under compaction pressure. The relative green density at the centre of the midlayer of the specimen was measured to be the highest in all compaction pressures. To further study this effect, the standard deviation of the void ratio versus the layer was studied as well. It was found that the deviation of void distribution decreases from the top layer to the midsurface layer. The behaviour of the cold compaction process of iron powders is dependent on factors such as tool kinematics, material properties of the powder and frictional sliding at the tool–powder interface. Particles beside the sample edges, generally, have frictional interaction among themselves as well as with the walls, whereas far from the edges and particularly at the centre, the wall friction is absent and particle interlocking may readily occur. During the manufacturing process of specimen, a lubricant was used to reduce friction between the samples and the die walls, and this perhaps contributed in smaller local densities in the sample edges compared to the centre. Another observation is that the tap density appeared to be higher at the centre layer of specimen (midlayer in Fig. 2) than anywhere else. This may be due to the fact that when powder is transferred to the mould and tapped, smaller particles tend to migrate to lower layers during tapping phase, therefore causing higher tapped density at the centre layer compared to other regions. Naturally, under compaction, the higher tapped density and lack of frictional forces due to die and punch body combined has the net effect of higher density at the centre layers. This was observed in all samples tested regardless of compaction pressure.
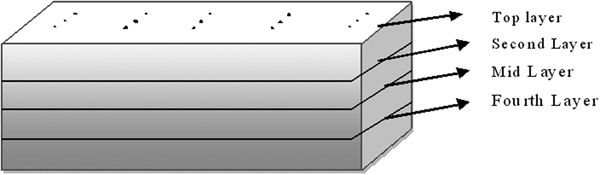
Generally, in powder compaction, powder particles are bonded together by mechanical interlocking of powders or by cold welding. The mechanical interlocking generally happens at lower compaction pressures, while cold welding occurs at high compaction pressures. At a high pressure, particle contact area increases due to particle deformation at contact interfaces. Continuous deformation of particles increases the interface contact area, and eventually, the cold welding of the contacting particles occurs. This effect is shown in Fig. 5a and b for samples fabricated at compact pressure of 276 and 662 MPa respectively. As Fig. 5a indicates, the specimen fabricated at 276 MPa pressure does not show cold welding at the grain boundary and grain interlocking is visible. On the other hand, the grain boundaries in Fig. 5b are less visible, indicating the occurrence of the cold welding phenomenon. The powder interlocking is prominent in lower pressures and gradually is replaced with cold welding as the compaction pressure increases.
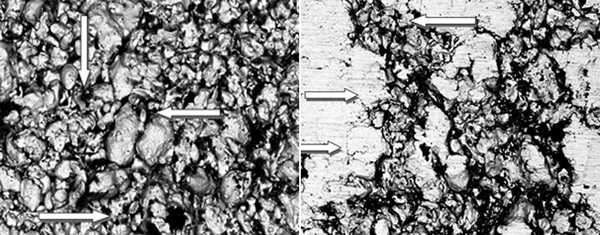
Grain boundaries of sample size 20 mm thick on midsurface layer fabricated at a 276 MPa and b 662 MPa: arrows show boundary and interlocking of grains
Neural network analysis
A multilayer ANN model consisting of one input layer, one hidden layer and one single-variable output layer was used to create a neural model for the compaction process. The neural network was trained using back propagation learning rule with Levenberg–Marquart algorithm.15 The input variables of the ANN include the compaction pressure, sample height (thickness) and local distance from the edge of the sample (location), and the output or response is the local green density. Ten experimental data points of local green densities on sample surface were employed to train a neural network. The neural model was then used to predict the green density under conditions of the remaining five experimental data points. Representative results are shown in Fig. 6 for a given compaction pressure and at two different layers. Overall, the neural network predicted values on samples used here are in fair agreement with the experimental data. In future studies, researches need to be performed on more complex sample geometries to investigate the prediction power of ANN on complex geometries.
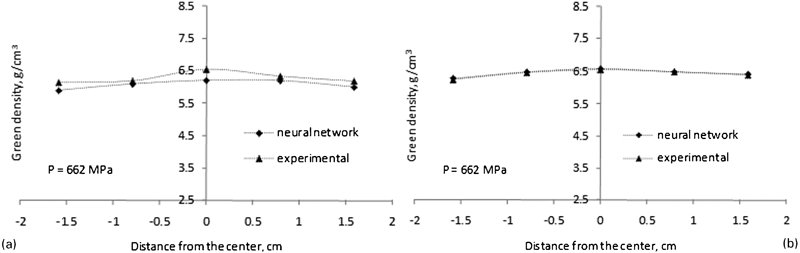
Effect of compaction pressure on green density: variation of experimentally determined and neural network predicted local green density along longitudinal axis of sample at given sample height; x axis origin denotes centre of the samples
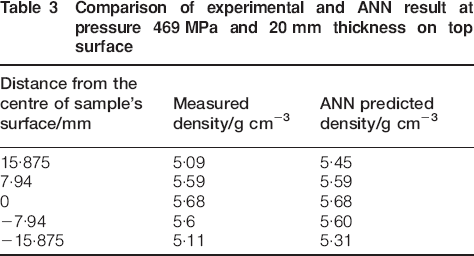
In addition, to determine the predictive capability of the neural network, the relative densities were obtained by the neural network at various locations and at various pressures. Table 3 shows the ANN results of a 20 mm thick specimen fabricated at 469 MPa pressure at top surface. The measurements were taken from the top surface (first layer), along the longitudinal axis. Note that 0 refers to the centre location, and ±15·875 mm refers to the location near the die body. The neural network resulted in overall average error of 2·2% for sample data presented in Table 3. Details of the ANN analysis may be found in Ref. 16.
Comparison of experimental and ANN result at pressure 469 MPa and 20 mm thickness on top surface
Finite element analysis
To further study the cold compaction process and green density variation and in order to simulate a realistic compaction model, a fully three-dimensional FE model was implemented. The geometry and the boundary conditions considered here were defined similar to the experimental conditions. Three FE geometries were constructed in this study to represent three experimental samples of different heights (thicknesses) of 10, 15 and 20 mm, but with identical cross-sectional area. Utilising two midplane symmetries, one quarter of each model was constructed (Fig. 7). The Coulomb friction model with constant friction coefficient of 0·1 was used. Five compaction pressures of 276, 372, 469, 565 and 662 MPa were considered.
a Full size model and b quarter model with die body
MSC MARC software was utilised for the FE simulation. This software incorporates the Shima model as the material model. The Shima model is adequate for simple shapes such as the rectangular shape used in this study but may not be sufficient where shear mechanisms are present. For complex shapes and mechanisms more sophisticated models are needed. The elastic modulus and Poisson's ratio reported by Pavier and Doremus17 as a function of relative density were input to the FE program. The Pavier–Doremus is derived from experimental data based on three-dimensional characterisation of iron powder. This material model is known to perform well within the FE simulation.17,18
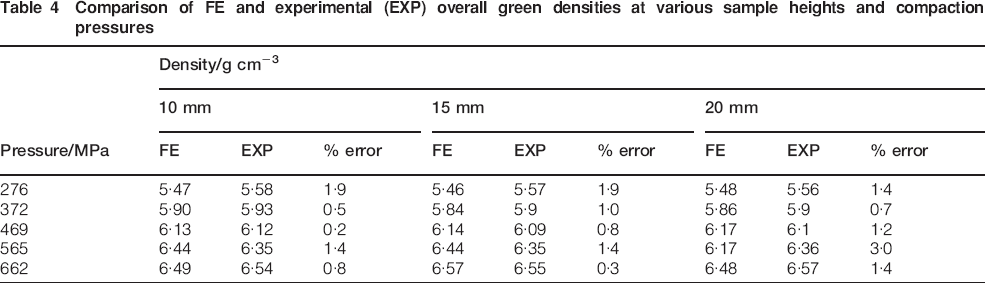
The numerical method considered here was implicit time integration Newmark–Beta with consistent mass matrix. The elastic modulus and Poisson's ratio were calculated as a function of relative density. The contact forces were calculated at each node on the surface. The forces were then integrated over the surface of the brick element.16 For each FE analysis, relative density was calculated at the die/powder interface, centre and a location at midspan on four layers. Figure 8 shows the comparison between experimental and FE results of densities averaged over the surface for the 10 mm specimen. Table 4 lists the complete results of the average relative density after compaction for various compression pressures and sample heights. While the FE average density results slightly overestimate or underestimate the density data, the error is insignificant and within the accuracy of both experimental data and the FE analysis.
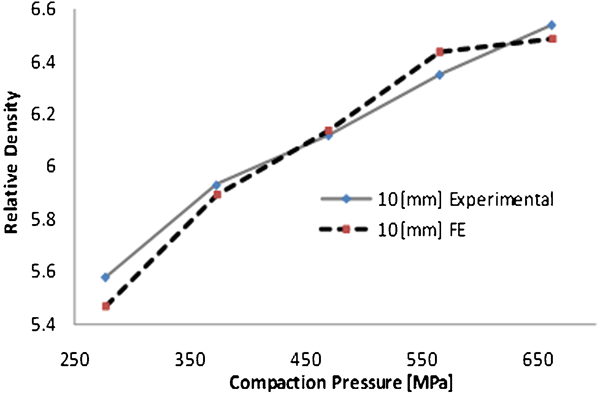
Comparison between experimental and finite element density (g cm−3) for 10 mm specimen
Comparison of FE and experimental (EXP) overall green densities at various sample heights and compaction pressures
While Fig. 8 and Table 4 show the average density data, Fig. 9 shows a typical FE contour plot of local density within the sample. Note that the domain corresponds to half of the sample. The minimum density is calculated at the centre and increases towards the edges. This is inconsistent with the experimental results shown in Fig. 3 where the densities measured at the sample centre are slightly higher than those measured close to the edges. We note that there might be some uncertainties associated with the density calculation from the SEM images. Furthermore, we note that the FE model assumes a uniform and homogeneous distribution of particles within the sample, whereas the powder in the mould is not uniform during the manufacturing, as discussed above for the tap density. Nevertheless, and as shown in Table 4, one may argue that the FE analysis is an effective tool for the estimation of overall relative density for design purposes. However, it may not precisely predict the local density as observed by others as well.7 It is primarily due to the fact that FE works based on a continuous distribution of relative density throughout the specimen. To obtain accurate local relative density, one has to assign various relative densities to various discrete elements.
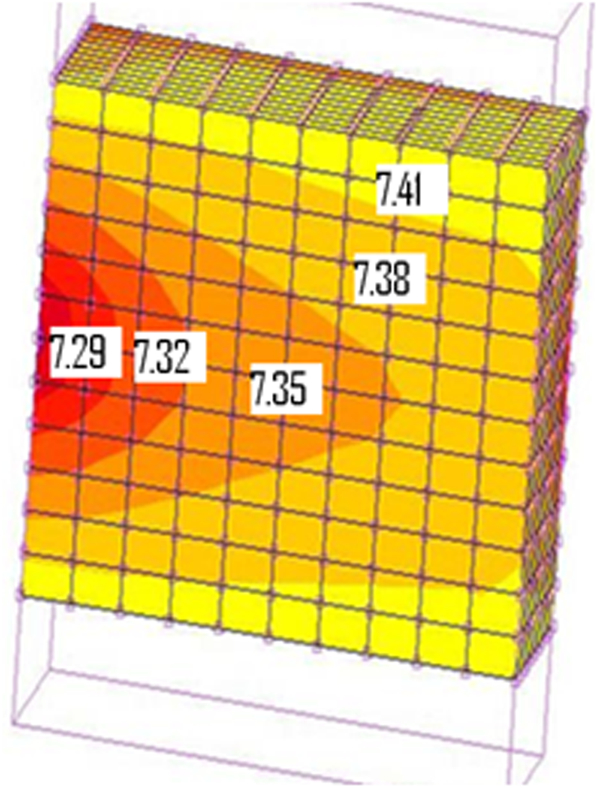
Typical top view contour plot of local density in g cm−3 for half of sample obtained from FE analysis
Conclusions
Green densities of stainless steel powders compacted under various compaction pressures were obtained. A methodology for predicting the green density distribution using neural network and FE method was also developed. Experimental observations showed that, in most cases, the green density attains its highest value at the sample centre and decreases towards the edges. This is attributed to the friction between the power at the sample edges and the die body. The experimental data were used to train a neural network and to calibrate the FE scheme. It was shown that a neural model, once trained using some of the experimental data points, can predict the green density of compacted stainless steel samples with reasonable accuracy. For design purposes, the neural network, therefore, may be used to estimate the green density for varying input/design parameters. The overall compact density almost changes linearly with the compaction pressure. These results were generated by the FE model as well. Finite element simulation underestimate or overestimated the green density distribution by ∼3% for different pressure compactions. Mechanism of particle interlocking was observed for low compaction pressures, whereas cold welding was the dominant binding process at higher pressures.
Footnotes
Acknowledgements
This work was financially supported by a grant from NVE/Auto 21 of Canada. Authors are indebted to L. Peace of Powder-Tech Associates, Inc. for manufacturing of specimens.