
Abstract
Investigation was focused on resistance of Astaloy CrL type sintered material to contact fatigue. The material in two versions (0·3 and 0·7 wt-%C) was covered with TiCN coating. The results show that resistance to contact fatigue increased substantially, up to the value of about 3410±90 MPa. This increase was influenced primarily by the properties of coating. In this case, the impact of the matrix was of secondary importance. The results obtained in the evaluation of life in terms of contact fatigue were confronted with those of the microscopic observation of generation and propagation of cracks leading to the formation of pitting, as well as with other tests. It describes the impact of contact fatigue stress to changes in the material at the point of application. A special section is devoted to the use of finite element method (FEM) for simulation of the Hertzian stress and changes during contact strain.
Introduction
Numerous studies in the area of contact fatigue of materials produced by powder metallurgy are aimed to increase their lifetime using methods of surface treatment. This effort is not an end in itself, because the phenomenon of contact fatigue damage is a limiting factor of mass scale use of powder metallurgy materials. Studies so far made in this direction have shown the possibility of increasing the contact fatigue life.1–5 In particular, the development of new prealloyed high strength steels and utilisation of conventional coating techniques such as cementation, nitriding, surface hardening, etc. proved the possibility of using these materials for demanding applications.6–8 At the present time, research will continue using new methods such as progressive coating by PVD/CVD or by applying laser treatment. Some types of coatings are expected to be very effective in this regard.
A further increase in need for high performance balls and roller bearing components that can withstand extreme applications has led to a growing interest in hard coatings for their better fatigue life and wear resistance.9–11 In particular, hard TiN and TiC (N) coatings and also DLC films12,13 have attracted and still attract much attention of manufacturers. Experiments conducted on compact materials showed that the hard coatings can effectively extend the fatigue life of steel bearings. 9 Laboratory tests have shown that the best results for testing on contact fatigue provides in particular, thinner hard coatings, with thickness from 0·2 to 1·0 μm. For thicker coatings >∼2 μm, it leads to delamination, or fracture, and in most cases, to reduction of the contact life of bearing steels. It shows also that the lifetime of the coated material is highly influenced by the architecture of coating 14 or the roughness of matrix. 15 Some other authors showed that even the layer 5–7 μm may be beneficial as well. It turns out, however, that the improvement in fatigue life and wear depends on coating thickness and adhesion. 16 Ultimately, it is important for coatings that rolling contact surfaces remain intact. The present article has the task to show what phenomenon occurs after applying PVD to TiCN coating with a thickness of 3 μm at contact stress of CrL type sintered steel with modification 0·3 or 0·7 wt-%C and how it affects the values of the fatigue life.
Experimental procedures
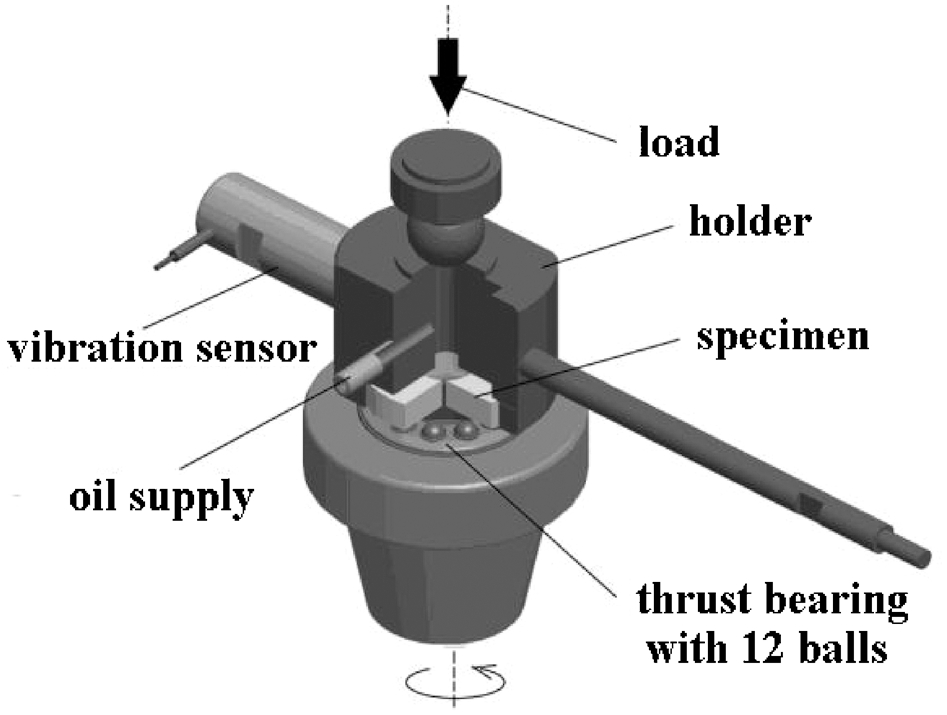
Samples were prepared from prealloyed steel powders from Höganäs Company of types Astaloy CrL (Fe–1·5Cr–0·2Mo) and Astaloy CrM (Fe–3Cr–0·5Mo). Three sets of samples were created by adding graphite powder contents of 0·3 and 0·7 wt-% of CrL and 0·3 wt-%C of CrM. After the addition of HWC type lubricant, samples were compacted under 600 MPa to form disc specimens of φ30×5 mm. Then they were sintered in controlled atmosphere (90%N2+10%H2) at 1120°C/60 min. The sintering atmosphere was frozen before sintering, dew point of −57°C. Samples were placed into a retort with a mixture of Al2O3 with an addition of 1 wt-%C to avoid possible undesirable oxidation and decarburisation of sample surfaces. After sintering, the samples were cooled outside the furnace in an inert atmosphere. Subsequently, they were machined so that the outer diameter became φ28 mm. Also a central circular hole with φ10 mm was made. The samples were finally ground to achieve plan parallel flatness on both circular areas. All samples were then coated with TiCN [synthesised by evaporation of Ti (99·5 wt-%) in N2/C2H2 plasma at 250°C] using PVD. Contact fatigue tests were held at the AXMAT test device (Fig. 1), the frequency of which was about 500 s−1. The sample in the AXMAT replaced one part of the thrust bearing 51102, and 12 balls with φ3·969 mm roll on its surface inside the bearing steel cage. Lubrication was provided by a continuous supply of SAE 80 MOGUL gear oil, which was continuously filtered. The samples after tests were subjected to metallographic–microscopic analysis, hardness and microhardness measurement. A scanning electron microscope (SEM) and EDX analysis were used. Hardness values were determined by conventional tests such as the Vickers and Rockwell hardness (HRB method). In addition, the HB method was used to determine the resistance of TiCN coating to cracking under pressure stress. The sample was measured in the traditional way for hardness, using 5 mm ball under loads 5, 10, 15, 20, 30, 40 and 50 kp. After completing the tests, at the point of the squeezes were detected cracks using both light and a SEM.
Device AXMAT
Friction coefficient was measured at a CSM tribometer under the following conditions: tribological partner, standard hardened steel ball of 4 mm in diameter (62 HRC), sliding speed 20 cm s−1, load 6 N, running distance 1000 m, track radius 8 mm and temperature 20°C.
Results and discussion
Tests were focused on sintered material based on the Astaloy CrL type powder in two variants, namely, the 0·3 and 0·7 wt-%C. Metallographic analysis of these materials, of the chemical composition and processing has been published before by us. 1 In case of both materials, the structure was of ferrite–pearlite, where the pearlite ratio corresponded to the carbon content.
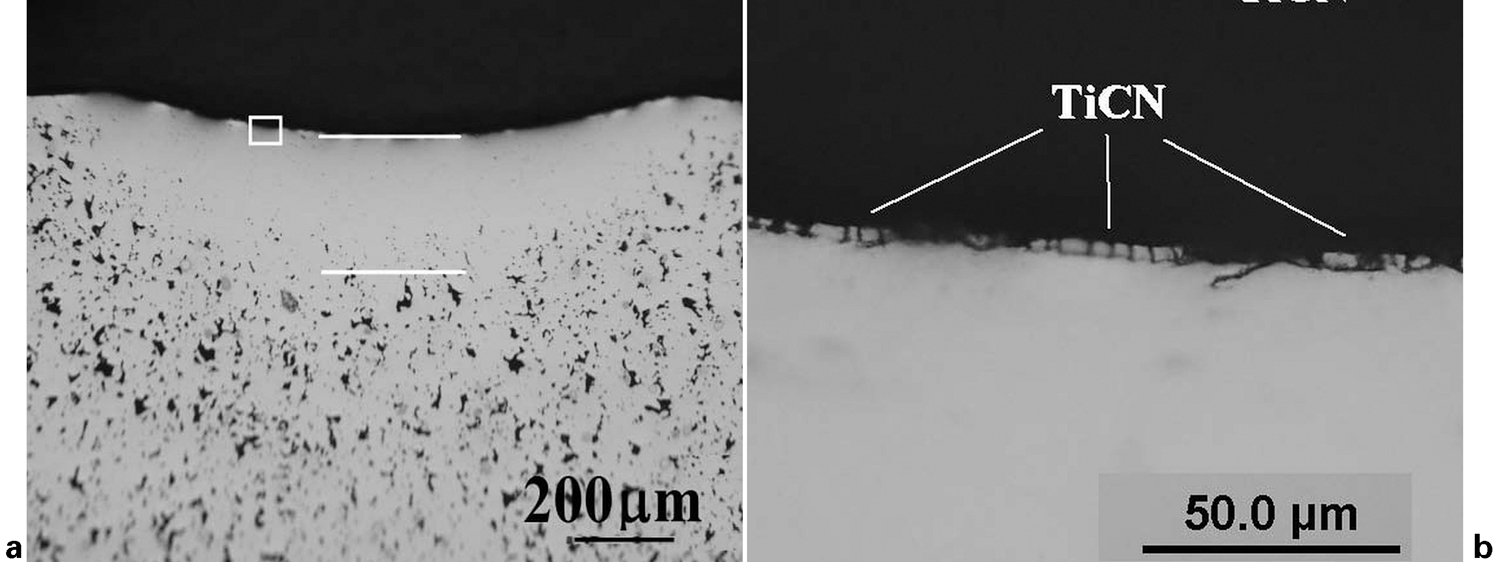
These structures are consistent with CCT diagram for the chemical composition and cooling rate. 17 Identification of the TiCN coating was performed on a metallographic cut and also by means of SEM (Figs. 2 and 3).
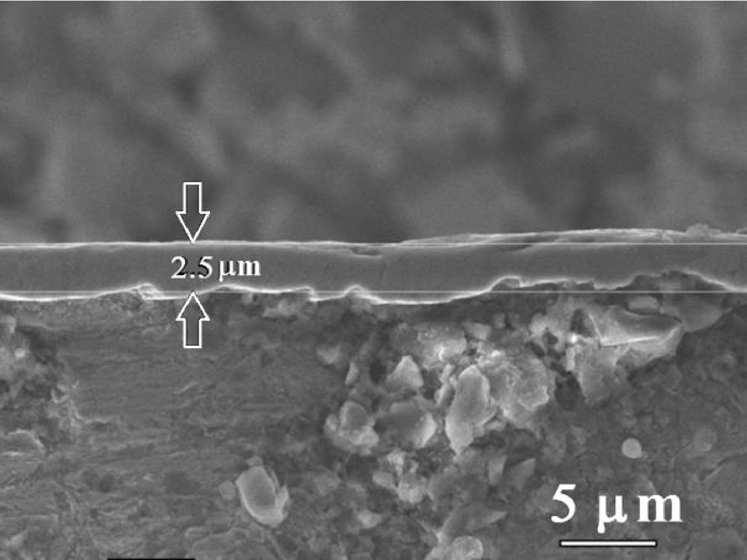
TiCN coating material on surface of CrL+0·3 wt-%C
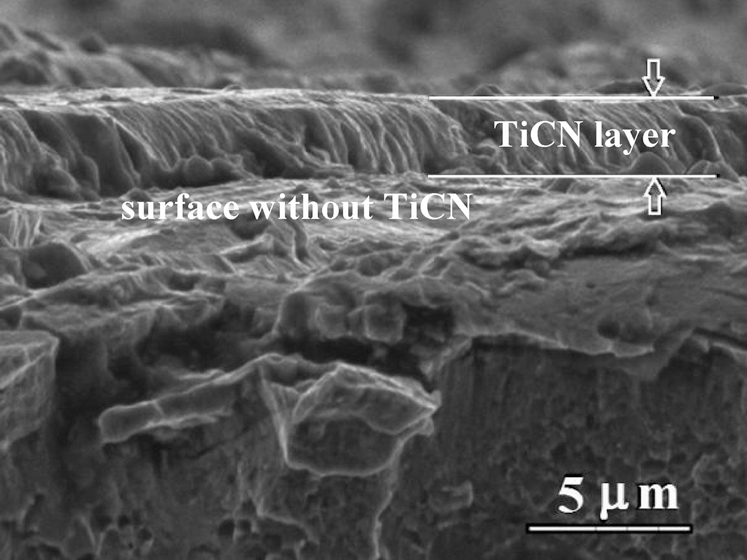
Appearance of TiCN layers
Its thickness can be determined from scales presented in the appropriate figures and one can state that it fell within the range of 2 to 3 μm. EDX analysis (Fig. 4) confirmed the presence of Ti as well as C. The point of analysis is shown in Fig. 3, between the lines denoting layer thickness.
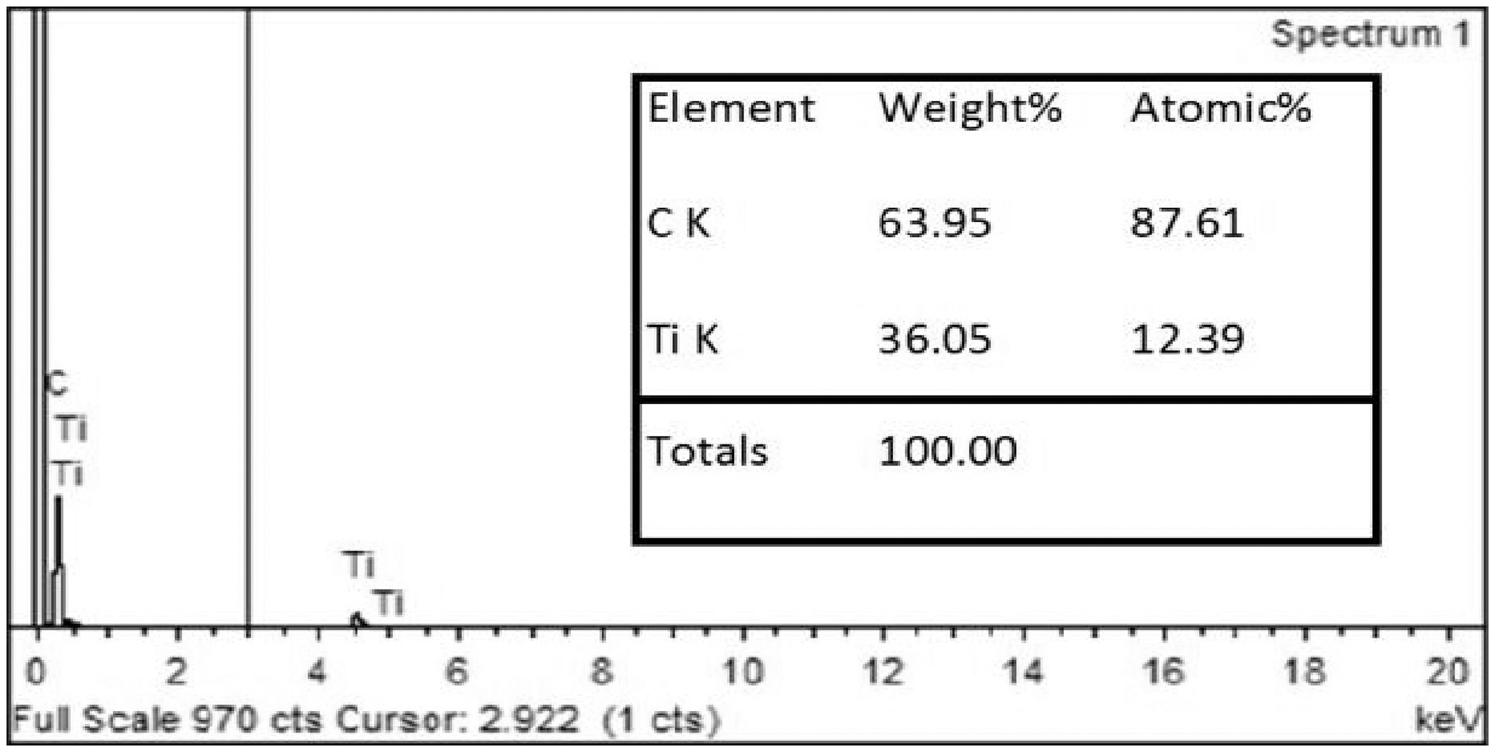
EDAX analysis of TiCN layer
The observation of the coating clearly showed that it has not shown constant thickness at all points.
This fact is, however, given by the nature of the sample surface, which was grounded before coating to roughness Ra = 0·86 μm and also by the nature of the TiCN coating. According to some sources, it is difficult to maintain uniformity of coating deposition. 10
Another obvious aspect is its structure, mainly because it has a poreless columnar character. This fact is evident from Fig. 3, showing a micrograph of a broken sample. The structure of the base material under the TiCN layer exhibits both dimple morphology and pores (Fig. 5).
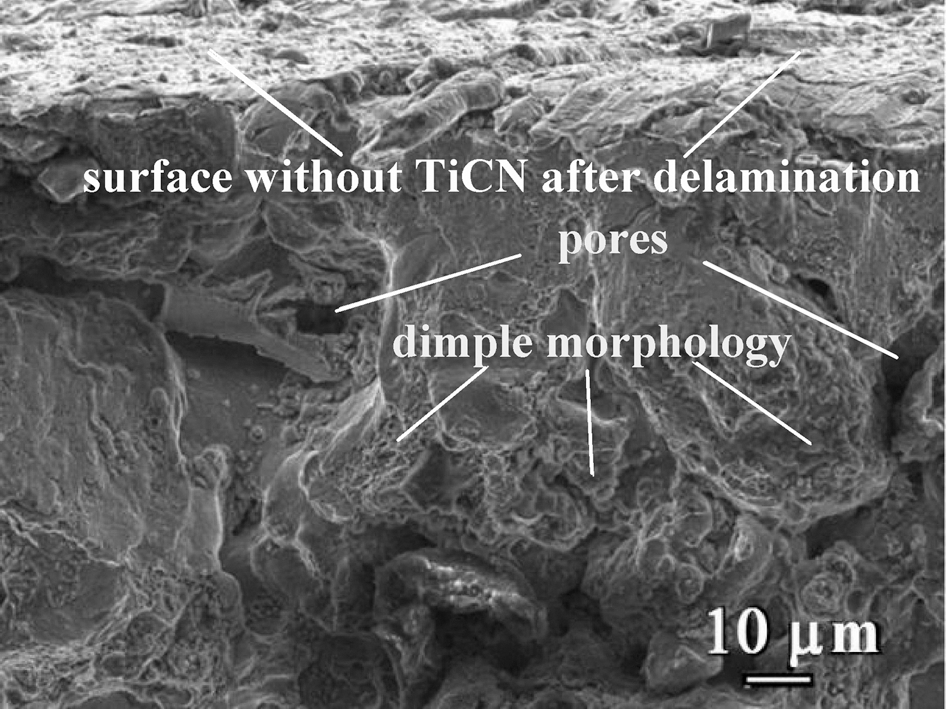
Fracture structure of material CrL+0·3 wt-%C
The broken specimen has also given information about the adhesion ability of the coating. As shown, it is not particularly high. This can be inferred from the fact that in many places delamination occurred (Figs. 3 and 5). TiCN coating opposite to the base material has much higher hardness, so it is obvious that when stressed it exhibits high brittleness. Coating with a thickness of 3 μm deposited on the surface leads a priory to more cracking, because it already belongs to the group of thicker coatings, which cannot adapt so easily to the deformation of the base material, unlike the group of thin coating (0·2–1 μm) that has shown better ability to do so.11,14
To assess the mechanical properties of these two tested materials, hardness tests were performed. Hardness of substrate materials (i.e. after sintering) was measured by Vickers and Brinell methods. These methods were then also applied to measure the hardness of the surfaces after application of TiCN coating. The results are shown in Table 1. By comparing hardness values in the table, we can see that the deposition of the coating, although with small thickness, caused an increase in surface hardness for each set of samples.
Hardness, indentation depth and friction coefficient of the experimental materials before and after applying coating
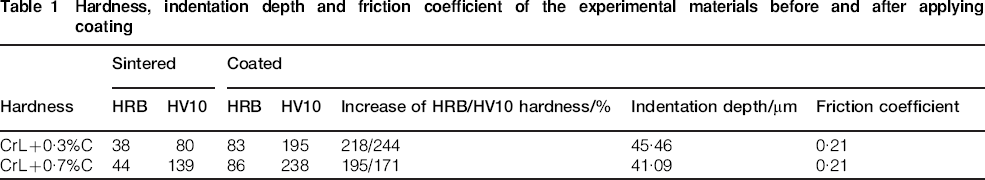
When measuring the hardness by the HV method, there occurs damage to the coating, the thickness of which was about 3 μm, whereas the indenter tip penetrated into depths listed in Table 1. In order to reduce the damage of the coating we also applied measurement by HRB method, where we assumed that due to the type of indenter (ball with a diameter of 1·5875 mm), no puncture of the coated layer would take place. As shown by our measurements, the assumption that we said proved to be correct. In the case of measuring the hardness of HV, the increase of the hardness following coating at the separate materials was 245 and 171%, which actually confirmed that the intrinsic hardness of base material was measured.
In the case of measuring HRB, surface hardness applying the coating increased by 218 and 195%. The difference to us indicates a smaller contribution of the base material on the total hardness when measured by the method HRB.
Equipment for measuring HB hardness was also used to determine the resistance of TiCN coating to compressive stress. In other words, we have investigated the load at which there occurs fracture of the hard layer (due to breakage). Loads were used in the order of 5, 10, 15, 20, 25, 30, 40 and 50 kp. It turned out that the first cracks (fissures) in the material with 0·3 wt-%C appeared at a load of 30 kp load and material with 0·7 wt-%C at 40 kp.
Measurement of the friction coefficient showed values listed in Table 1. It is clear that the friction properties improved significantly, as these values are much lower than those at steel to steel couple friction, which typically gives the coefficient 0·8. 18 The coefficient of friction is the same for both experimental materials and remained stable during the entire testing. It shows that coating was neither seriously damaged nor removed during the wear process.
To verify that the material properties under the coating have not been altered significantly, we performed microhardness measurements along the cross-sections of the samples up to the half of the thickness of the material. The measured values are shown in Fig. 6. The behaviour of microhardness helps us state that the TiCN coating has no significant impact on the substrate. A slight increase in microhardness of the samples for each variant at the coating to a depth of about 250 μm can be probably explained by the weak surface cementation processes in the process of coating deposition.
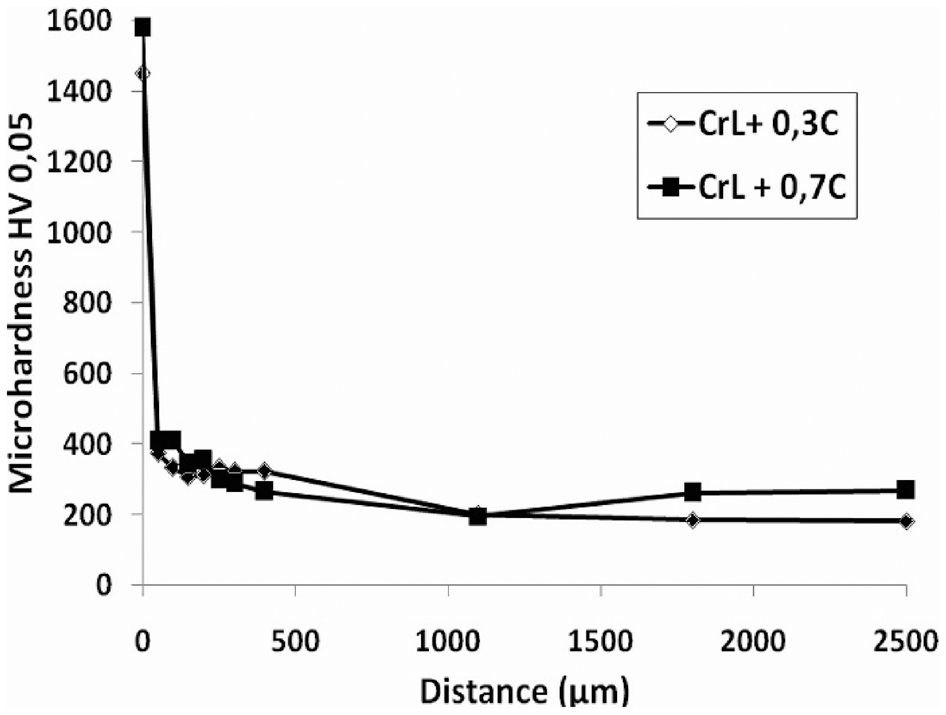
Microhardness–depth profile
Measuring the resistance of coated sintered materials against rolling contact fatigue was the main objective of this research. Effect of coating was compared with the initial state obtained following sintering. The initial state and its properties have been published in Refs. 1 and 19 and were used as a starting point in our case, too.
The results of contact fatigue of the coated samples and their comparison with the basic sintered state are shown in Fig. 7 and also in Table 2. The graph in Fig. 7 is prima facie evidence of those facts. First, there has been a substantial increase in the life of both investigated variants. Second, in the case of pure sintered materials, the life curves were different (in accordance with the mechanical properties). For the coated version, this difference could not be identified. Differences in life have a greater variance and so we were forced to limit the life by two curves that intersect the limit of 50×106 cycles at values of 3320 and 3500 MPa. We consider this limited field a common value for life of both material alternatives and next, we will work only with the average value of 3410 MPa for both variants. Third, it is about the slope of these curves. At the sintered variant, the Hertzan stress difference in life between 1×10⁶ and 50×106 cycles (i.e. if the sample breaks at short time, or it will last until the limit investigated) lies between 1050 and 1350 MPa. At coated samples, this mean value is only about 200 MPa. These differences evoke a quite unambiguous conclusion that the majority factor of coated material resistance is in the properties of the coating. The matrix is of secondary importance, and its impact will be further discussed.
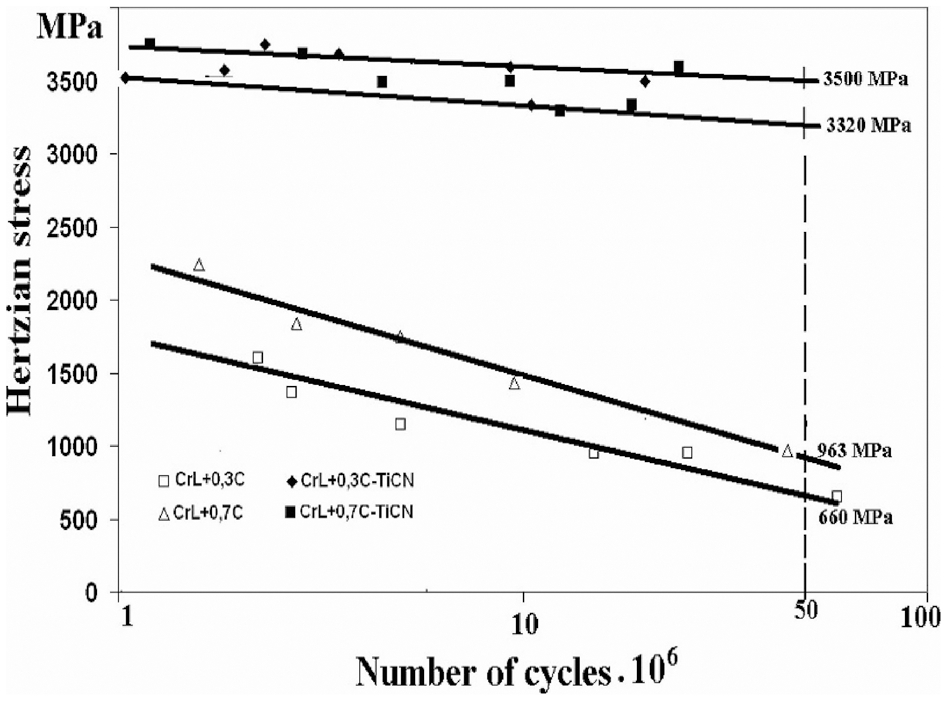
Wohler curves for sintered state and TiCN coated state
Fatigue limit of materials after sintering and coating
σC–S: fatigue limit in sintered state; σC–C: fatigue limit in coated state.
It is obvious that the nature of the contact fatigue is decisively affected by extremely hard yet thin (compared to the layers of other conventional coatings) and brittle layer of TiCN coating. This is capable of withstanding some stresses without some tension to allow the creation and development of fatigue cracks in the base material, which would lead to the development of pitting. The diagram in Fig. 7 shows that under the level of approximately 3300 MPa no pitting has occurred for any of the materials. We consider that the TiCN layer is able itself to withstand a certain amount of stress. In addition, cracking of layers may also depend on the hardness of the substrate. Softer ground is more deformable. If adhesion is good, the deformed layer remains together with the matrix and only a certain stage of deformation leads to its rupture. Detection of cracks using the method for measuring the HB hardness confirms this fact. The coating on the softer CrL+0·3 wt-%C material cracked at a lower pressure than the coating on a harder substrate of CrL+0·7wt-%C.
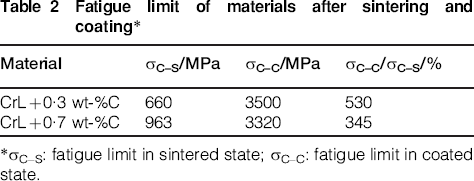
Another important factor in testing of contact fatigue of sintered materials (our case) is the fact that the pressure of the circulating balls creates plastic deformation of the circular track area, which has its width and depth. In this context, as an example, we measured the value at the CrL+0·7 wt-%C variant, graphically illustrated in Fig. 8. As it can be seen, depending on the number of cycles, both values exhibit two distinct areas. In the first one, one can see a rapid increase both in the width and depth of the track. This fact is also valid for the second variant and allows us to explain the relatively large increase in the lifetime at contact fatigue tests. Increase in the fatigue life for the value of 50×106 cycles by CrL+0·3 wt-%C was from 660 to 3500 MPa, which is an increase of 530%. And by material CrL+0·7 wt-%C from 963 to 3320 MPa, it was 345%.
a width and b depth of track
TiCN coated material life depends, like that of other materials, on the processes, which are generally known. In the material, such processes have to be induced, which lead to initiation of cracks, then their gradual propagation and joining, and eventually to the formation of pitting.
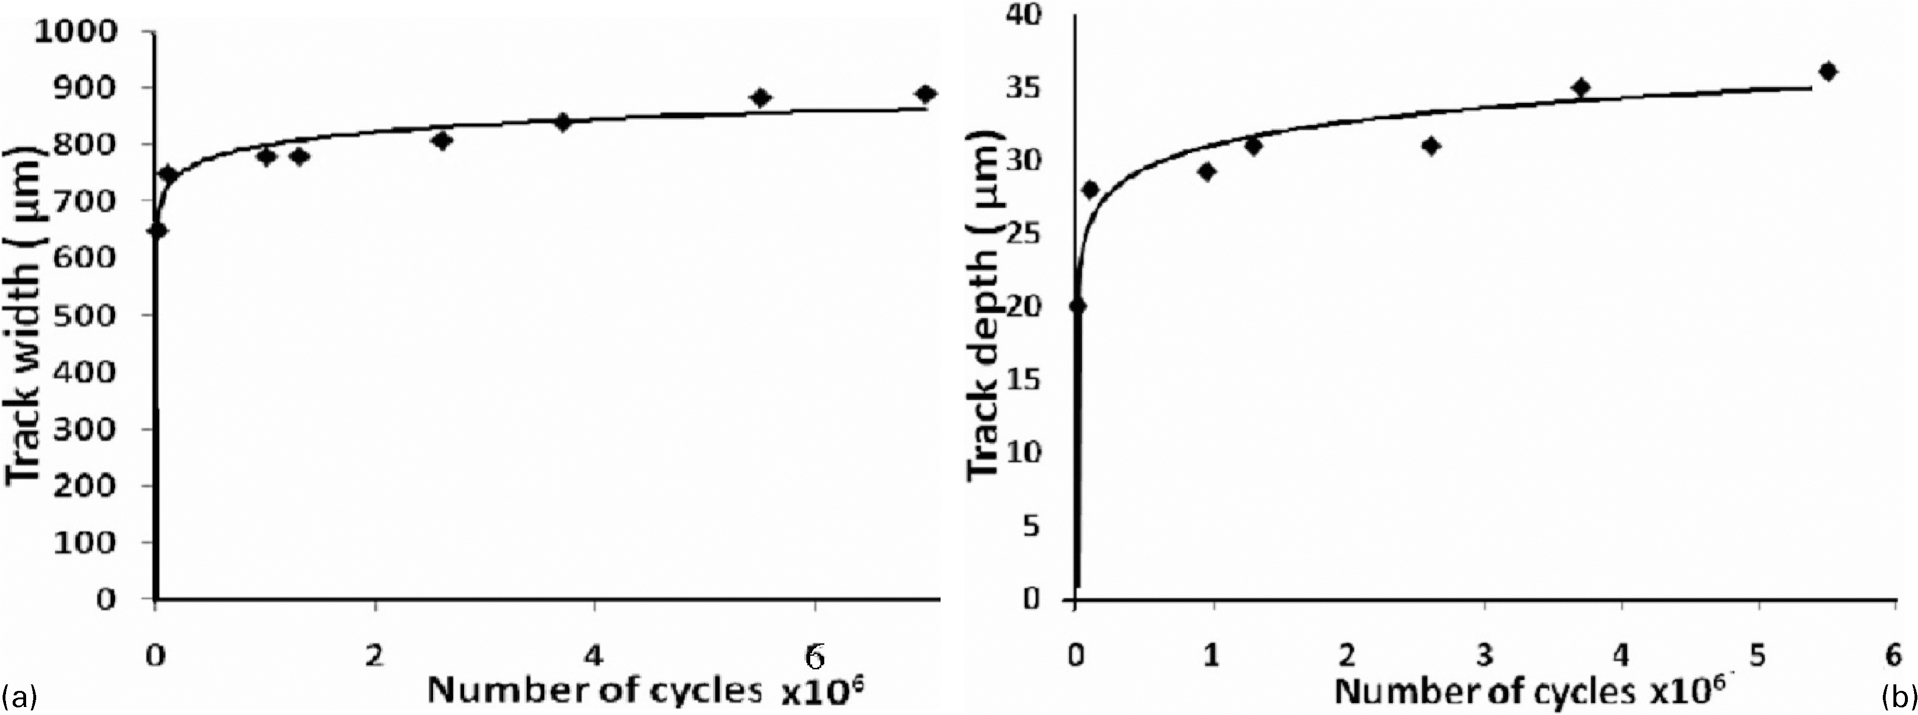
On the other hand, metallographic observation has shown that the motion of balls under the effect of pressure causes the at the point of movement not only generation of track (with its width and depth) (Fig. 9), as well as compaction of the matrix, resulting in the removal of porosity at points under the orbiting balls (Fig. 10a) and also cracking of the TiCN layers (Fig. 10b).
a track covered by pitting and plastic deformation on each side and b profilograph of track
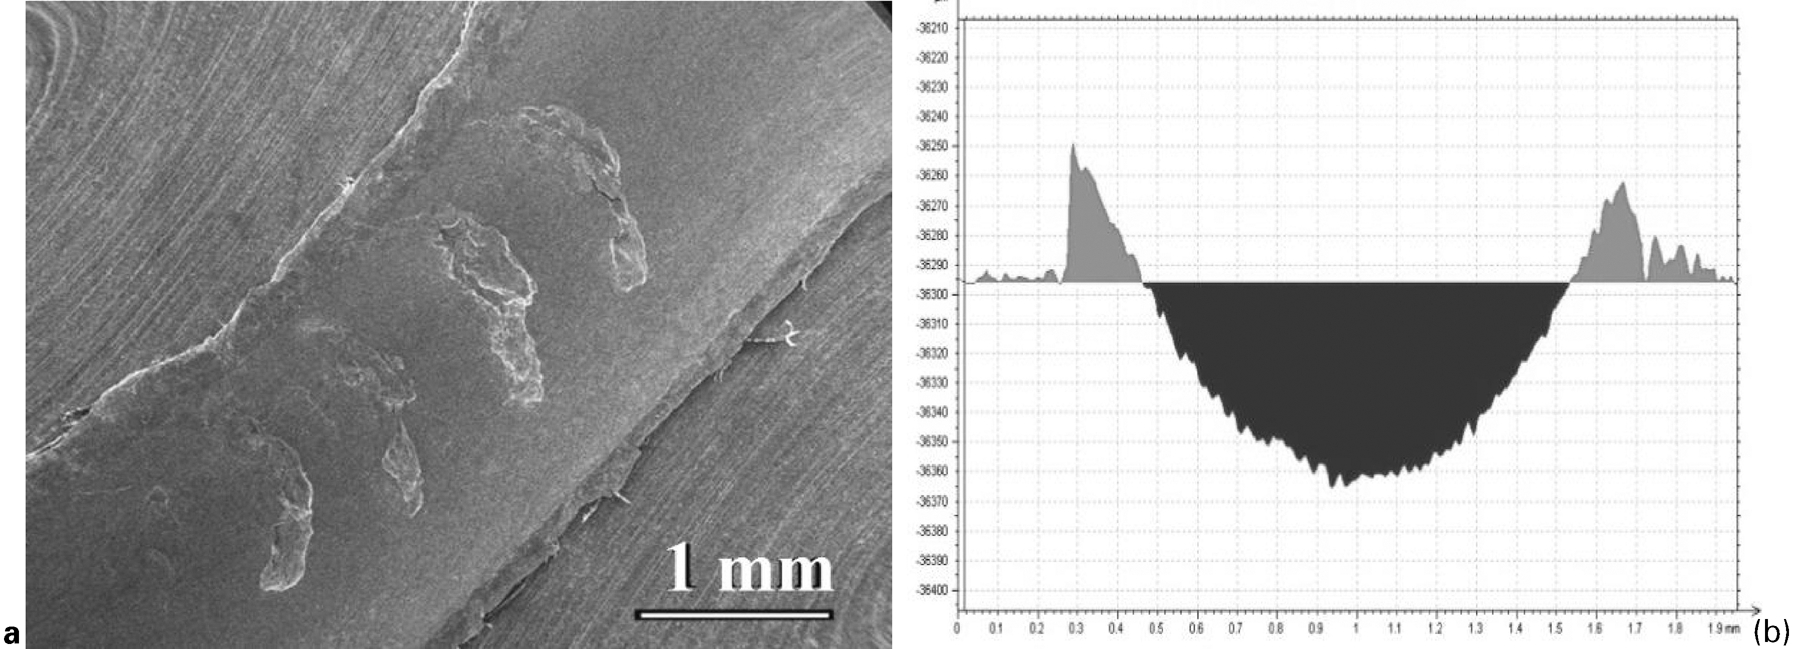
a compaction of material under track (CrL+0·3 wt-%C) and b residues of TiCN coating on it
Even though this TiCN layer cracked and some of it peeled off, quite a large part of her part remained on the surface till the end of the testing. Practically, it is therefore possible to state that despite peeling off the cracked layer, the balls until the end of life still moved along this layer. Hardening occurring at the orbital track has two aspects. The first is the strain hardening and the other is reinforcement arising due to increased density of the material in this site. In Fig. 10, and it may be said that the density increased from the original 7 g cm−3, at least 7·8 g cm−3, which means that the porosity decreased at that point at 1–2 wt-%. The compaction occurs by both material variants. The nature and depth of compaction depended on Hertz operating stress of driven cycles and the hardness of the material samples. It is therefore clear that the densest layer with maximum thickness at the same Hertz stress was under the track of the CrL+0·3 wt-%C material. This fact to some extent is reflected in life. From a theoretical point of view, the absence of pores prevents fatigue crack propagation compared to material with greater porosity.
Deformation, of course, is not uniform along the cross-section, but it follows the outline of the track (ball), i.e. that the regions of the deformation is smaller. This fact is reflected in the later stage after the formation of cracks in the way that crack propagation takes place from a macroscopic point of view on the contour of the given distribution of distortion level (Fig. 11). This track has a shape given by the shape of ball, i.e. it has breadth and depth as shown in Fig. 9, and at the same time, it is also obvious that the Hertzian stress causes plastic deformation, at which is not only shaping the tracks, but also displacing part of the material on both sides to the outside the track (Fig. 9b).
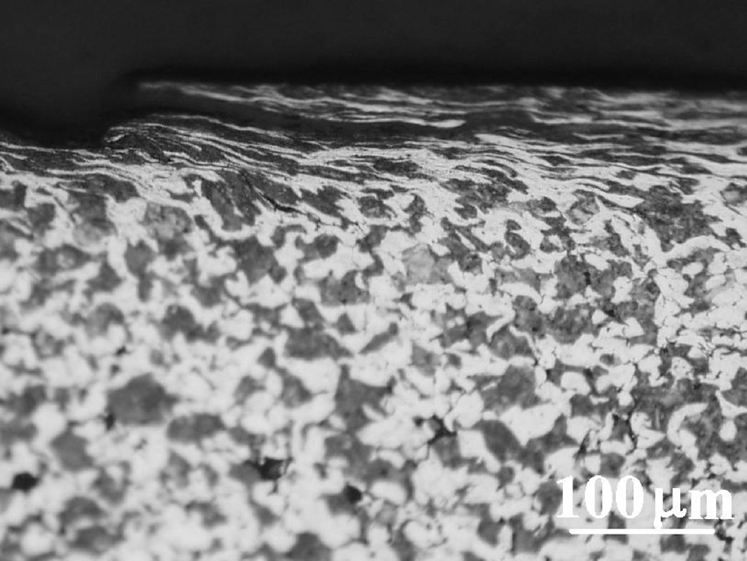
Deformation of material in track
The actual mechanism of damaging consists of the following steps: acting of the Hertzian stress and its repeated cycles leads to cracking of the coating layer, generation of cracks, which is due to that cyclic stress are spreading into the inside of the material. This fact can be seen in Fig. 12. By more plastic material (CrL+0·3 wt-%C), especially in places where porosity is removed cracks can propagate by way of classic striacias – (Fig. 13). Figure 13a shows the cross-section of pittings in the orbit and Fig. 13b shows the magnification of the area marked in the previous picture, presenting the that surface pitting covered by striacias, which is a clear sign of crack propagation. As it can be seen from the pictures, cracks always emerged on the surface. The main reason why they have not occurred under the surface in places highs Hertzian stresses is in the formation of cracks on the surface, which served as stress concentrators. Their further propagation was given, from macroscopic point of view, by deformation that originated at the orbit. At this point, deformation contours were formed, along the surface of which the cracks were propagating into the material.
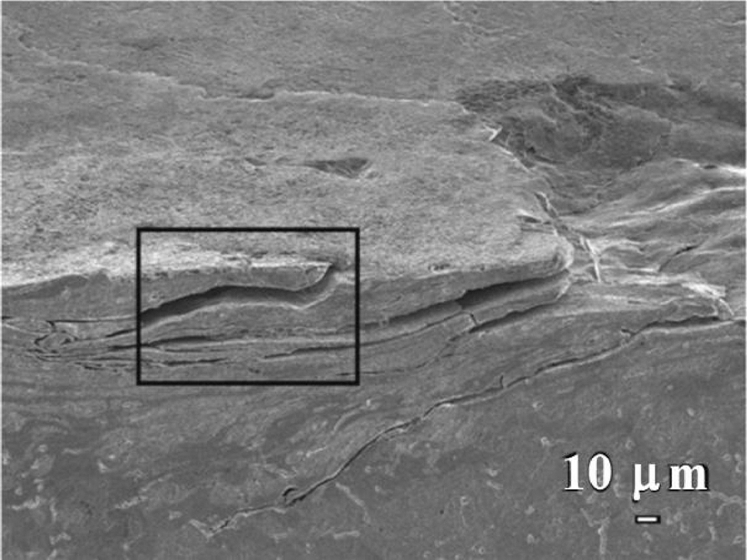
Crack propagation from surface inside material
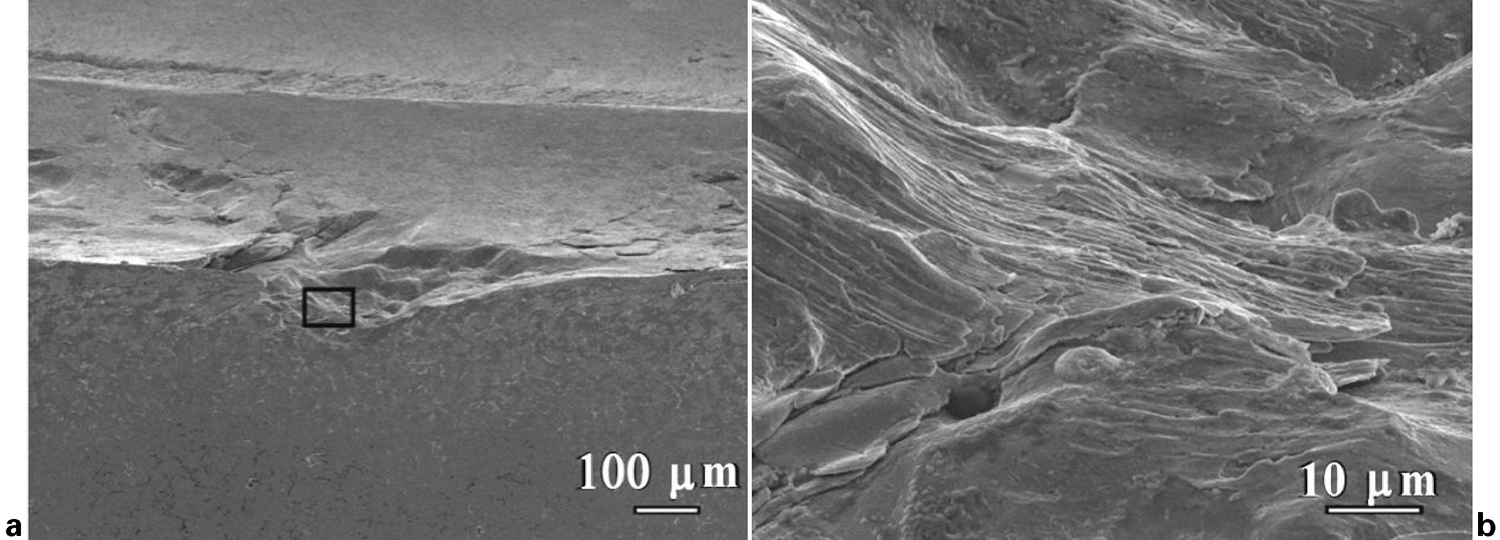
Pitting a cross-section and b stration of fatigue fracture
The most important, however, resulted from calculations using finite element method (FEM). The contact surface was in this case calculated on the basis of determining the radius ‘a’ of the contact surface, using equation
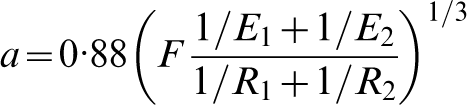
This value was the basis for the conversion of Hertzian stress values. The simulated model included the TiCN layer thickness: Young's modulus used in the calculations was the value 610 000 MPa. The behaviour of stresses after taking these factors into account, based on FEM, is shown in Fig. 14a. Based on this calculated stress, contact fatigue tests were performed till the end of service life. However, as shown by the results shown in Fig. 8, the values of the contact surface imprints have already changed after 103 cycles, so contact fatigue spread during the entire life of the sample was carried out at substantially lower values, which naturally had to be reflected in total life. In addition, calculations also included the compacted layer at a thickness of about 200 μm, the Young's modulus of which made use of a value ∼200 000 MPa. Figure 14b is offered as the proof of the results of calculations based on FEM analysis.
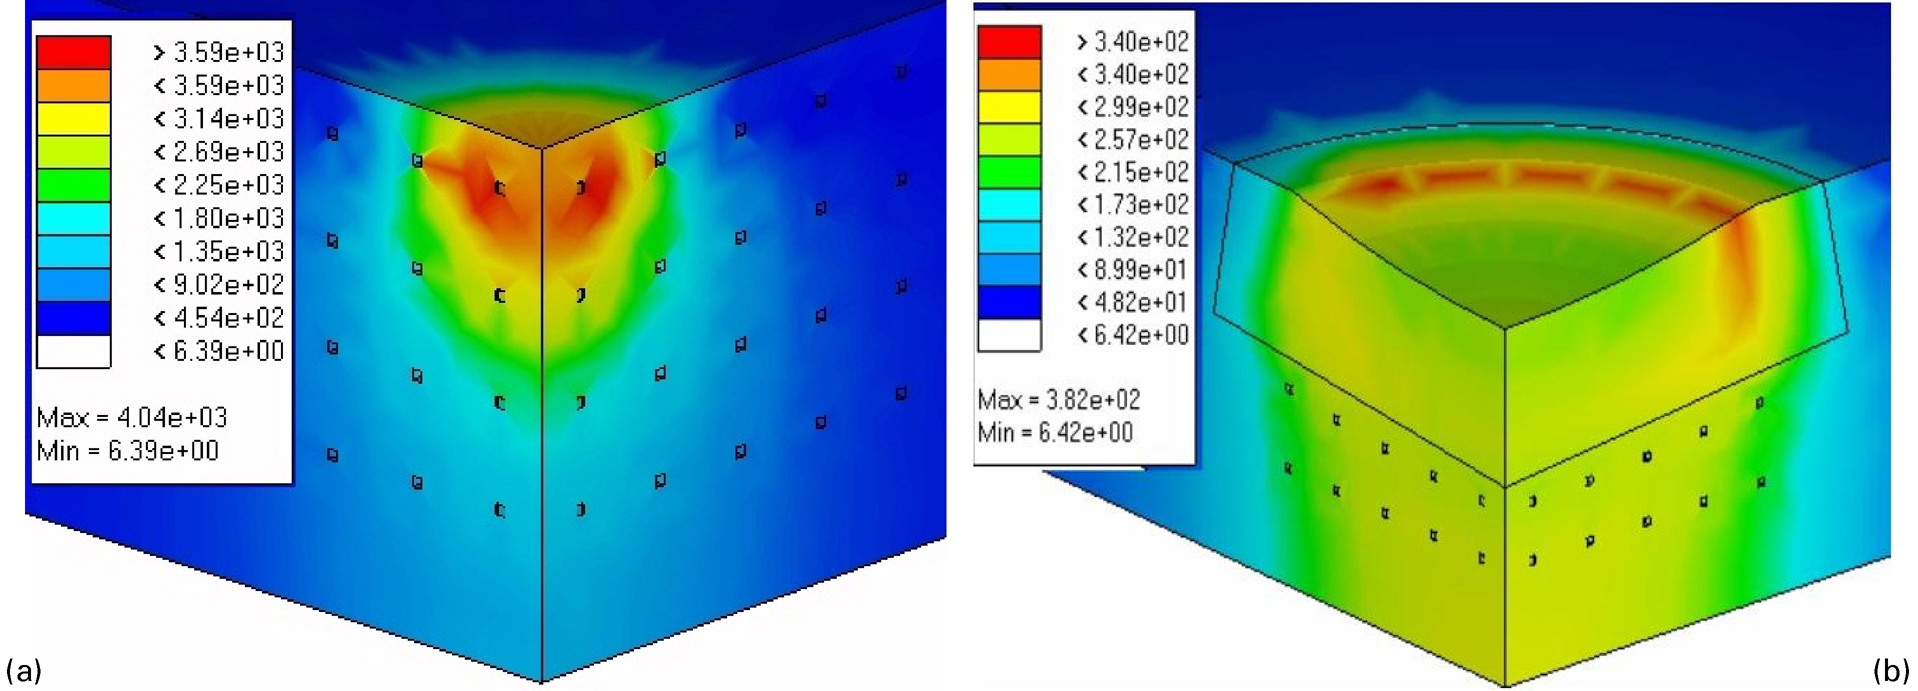
a, b behaviour of Hertzian stress calculated by FEM
As it can be seen from Fig. 14a, maximum Hertz stress on the basis of which the materials were was approximately 4040 MPa. Upon completion of the testing, the actual tension in the sample was only 382 MPa (Fig. 14b). It is therefore obvious that most of the time the sample ran at stresses at least 10 times smaller than those calculated. This result in the value of the Hertz stress inserted into the test sample is decreased from baseline by approximately 10 times.
Conclusion
Contact fatigue tests of TiCN coated material type CrL showed that:
1. Influence of coating CrL material with TiCN coating for contact fatigue properties proved to be highly beneficial. There was an increase in the fatigue limit of a material CrL+0·3 wt-%C by about 530% and material CrL+0·7 wt-%C by about 345%. The typical feature of contact fatigue curves is in their narrow stress values range (about 200 MPa), incorporating the points of service life ranging between 0 and 50×106 cycles.
2. As it follows from the results, the properties of matrices of the tested samples were of secondary influence regarding service life.
3. The high value of life is given in the first place by the resistance of the layer to the Hertzian, which became apparent only at stress values higher than 3000 MPa. It was a value, which in this method and stress parameters caused cracking of the layer. Abrasion was a minor aspect that had a secondary impact on the destruction layer. Weight test of the samples before and after contact stress showed that almost no weight loss occurred as a result of abrasion.
4. Contact fatigue also in the case of TiCN coating of the layer caused material degradation in the form of pittings. Their formation was the function of by the initiation of the initial damage, which in our case was present in the form of cracks originating incurred by TiCN layer cracking. Cracks were formed always on the surface and spread at along areas strain contours caused by the pressures of orbiting balls floating in the track.
5. In addition to pittings, the surface of materials was damaged by plastic deformation caused by the orbiting balls forming tracks. By dimension (width and depth), the track significantly increased the contact area between the orbiting balls and matrix. However, this quasidefect had a positive effect on the material life as a result of reduced Hertzian stress.