
Abstract
The aim of this work is to investigate the effects of different power modes [constant current (CC), constant voltage (CV) and constant power (CP)] on the structure and corrosion resistance of the plasma electrolytic oxidation ceramic coatings containing Ca and P on AZ91D Mg alloy. The phase composition, morphology and element distribution of the coatings were studied by X-ray diffraction, scanning electron microscopy and energy dispersive spectroscopy. The corrosion resistance of the coatings in the simulated body fluid was examined by electrochemical impedance spectroscopy and polarisation curve methods. The results showed that the coatings were of porous structure and mainly composed of MgO. The thickness, surface roughness, the size of the surface micropores and the amount of MgO were all increased with the cell voltage under the same power mode or increased in the sequence CV>CC>CP under the different power modes. The corrosion resistance of coatings was related to the structure characteristics, which were determined by different power modes. Among the different power modes, the corrosion resistance of the coatings is generally increased in the sequence CV>CP>CC, and under the same mode, the proper increase in the cell voltage is liable for improving the corrosion resistance of the coatings.
Keywords
Introduction
In the present study of plasma electrolytic oxidation (PEO) technique,1 – 3 the electrical sources are generally regarded as one of the most important factors to obtain high quality ceramic coatings. Among the researches on the electrical sources, the most widely studied areas are all kinds of electric parameters (current density, voltage, frequency and duty ratio, etc.) all over the world.4 – 9 Furthermore, the comparison of unipolar and bipolar electrical source modes is also investigated by some researchers.10 – 12 All these above studies are usually carried out under the condition of constant current density (CC) or constant voltage (CV), but the comparison of CC and CV processes is seldom reported currently. Moreover, another type of electrical source, which works at the mode of the constant power (CP) output, was adopted in our previous work.13 Under the mode of CP, the cell voltage was increased, while the current density was decreased with extending reaction time. Therefore, it is necessary and significant to study the effects of the different power modes (CC, CV and CP) on the structure and property of the PEO ceramic coatings. In this work, the PEO ceramic coatings were prepared under three power modes, and their effects on the structure and corrosion resistance of the PEO ceramic coatings containing Ca and P on AZ91D Mg alloy were investigated.
Experimental
Preparation of coatings
Plate samples of AZ91D Mg alloy with dimensions of 30×15×1 mm were used as the working electrode and an electrolyser made of stainless steel served as the counter electrode. Before PEO process, the samples were polished with fine abrasive papers and then cleaned to obtain a uniform surface. The electrolyte system contained sodium hydroxide (7 g L–1), sodium hexametaphosphate (4 g L–1) and calcium acetate (0·4 g L–1). PEO processes were carried out under three power modes (CV, CC and CP) with the same working frequency of 2000 Hz and initial peak current density of 2 A dm–2. When the designated voltage (200, 300, 400, 450 and 480 V) was reached, the constant voltage was maintained for the CV mode for 30 min, while the PEO processes stopped directly for CC and CP modes. The reaction temperature was controlled to be below 30°C by adjusting the cooling water flow. After the treatment, the coated samples were flushed with water and dried in air.
Characterisation of coatings
Morphology images and the elemental distribution of the coatings were studied with SEM and energy dispersive spectroscopy (EDS). Phase composition of the coatings was examined using X-ray diffraction (XRD), with a Cu Kα source. The coating's thickness and roughness were measured using an eddy current based thickness gauge (CTG-10) and a surface roughness gauge (TR-100).
Corrosion resistance of coatings
The corrosion resistance of the coatings was evaluated using electrochemical impedance spectroscopy (EIS) and polarisation curve method using a CHI604 electrochemical analyser in simulated body fluid solution, using a three-electrode cell (a Pt plate was used as a counter electrode, a calomel electrode was used as an auxiliary electrode and the coated sample was used as a working electrode with the area of 1 cm2). In the measurement of EIS, a sinusoidal alternating current perturbation of 5 mV was applied to the electrode at the open circuit potential of the coated samples over the frequency range of 0·01 Hz–10 kHz. The measured EIS spectra of the coatings were fitted and interpreted by EIS fitting software. Furthermore, the polarisation curve's scanning rate was 0·5 mV s–1, with a scanning range from −0·2 to +0·2 V versus open circuit potential. Based on the approximate linear polarisation at the corrosion potential Ecorr, the corresponding corrosion potentials, corrosion current densities and polarisation resistance Rp values were determined.14
Results and discussion
Thickness and roughness of coatings
The thickness and the roughness of the coatings prepared under different power modes are shown in Figure 1 Figs. 1 and 2 respectively. Both the thickness and the roughness of the coating abide by the following sequence: CV>CC>CP. Under CV mode, the coating was still growing, accompanying the spark discharging on the surface of the electrode sample when the constant voltage was maintained, which results into the increase in the thickness and the roughness, compared to the other two modes. Under CP mode, the output of the power is constant during the process, i.e. the cell voltage increases, while the current decreases during PEO process, and at CC mode, the current is constant, while the cell voltage increases. In this way, the actual output of CC mode is more than that of CP mode; therefore, the thickness and the roughness of CC mode are larger than those of CP mode in general.
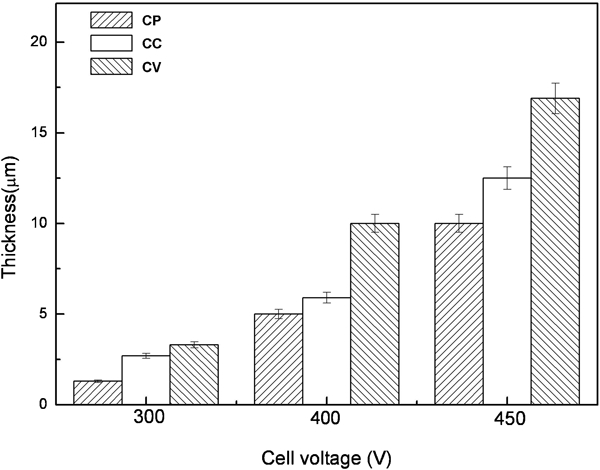
Thicknesses of coatings prepared under different power modes
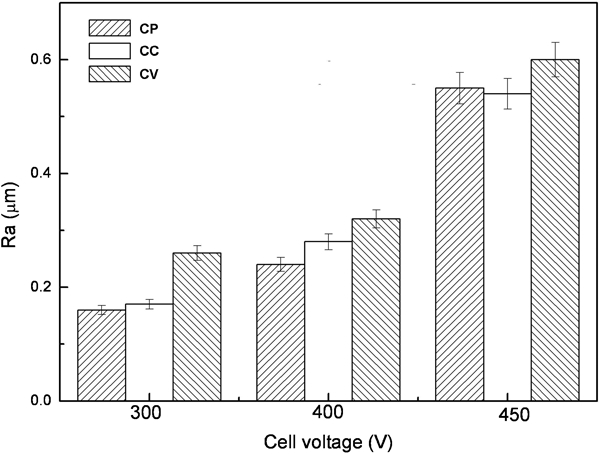
Roughnesses of coatings prepared under different power modes
SEM images of coatings
The surface and the section SEM images of the coatings prepared at 300 and 450 V under different power modes are shown in Fig. 3. From the surface SEM images, the coatings are all porous. Under the same power mode, the number of micropores is decreased, while the size is increased with the cell voltage. Under the same cell voltage, the number of micropores is decreased, while the size is increased in the sequence of CP, CC and CV modes. Comparatively, the surface morphologies of coatings prepared under CC and CP modes are basically similar, which are quite different from that of the coatings prepared under CV mode. The changes of the surface morphologies comply with the surface roughness of the coatings. As for the section SEM images, the thickness of the coatings is consistent with the results shown in Fig. 1. Furthermore, the micropores and the microcracks are clearly shown in the section images.
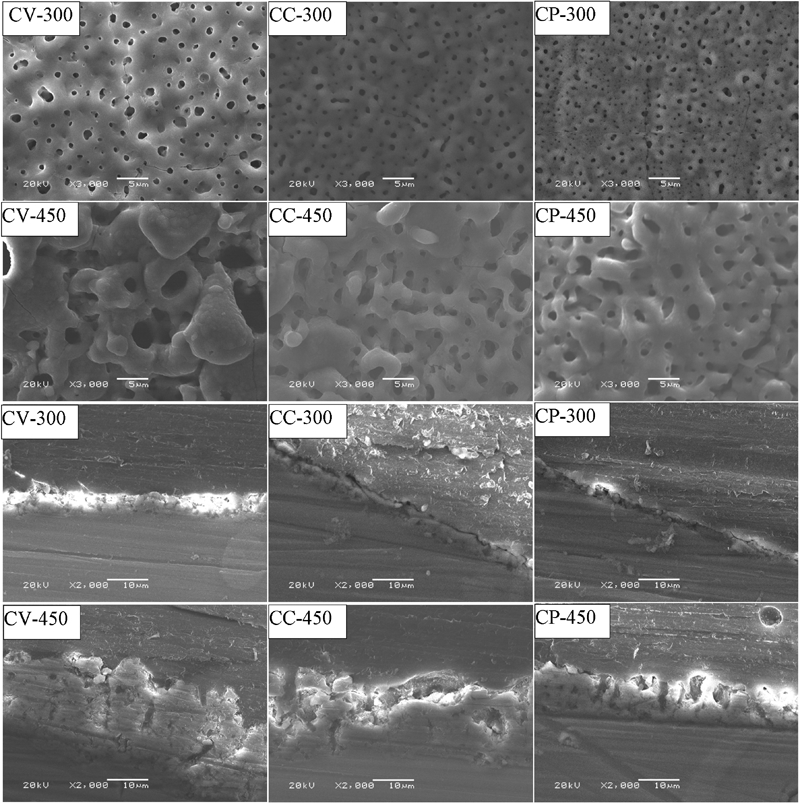
Surface and section SEM images of coatings prepared under different power modes
Composition of coatings
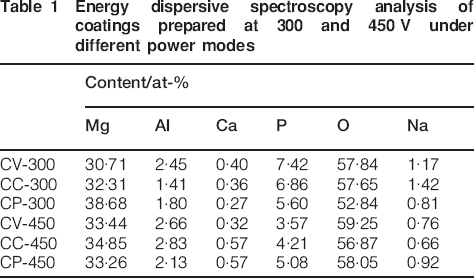
Table 1 presents the relative content of the main elements of the coating prepared at 300 and 450 V under different power modes. All the coatings are composed of a large amount of O and Mg and a small amount of P, Al, Ca and Na, which shows that the elements, both from the substrate and the electrolyte, joined the PEO process and contributed to the formation of the coating. Furthermore, the relative contents of the main elements in the coating change less with different cell voltages or power modes. In order to investigate the crystalline substance of the coatings, XRD analysis was carried out, with the results shown in Fig. 4. The main crystalline in the coating is MgO. Moreover, the diffraction peaks corresponding to the Mg alloy substrate appear in the patterns because the coatings are thin and porous. Under the same cell voltage, the amount of MgO is increased in the sequence of CP, CC and CV mode. However, under the same power mode, the amount of MgO is increased with the cell voltage. Therefore, the coating prepared at the higher cell voltage under CV mode has better crystallisation. Moreover, P, Ca, Al and Na are not detected by XRD analysis, which means that they may exist in the form of amorphous state in the coating. Figure 5
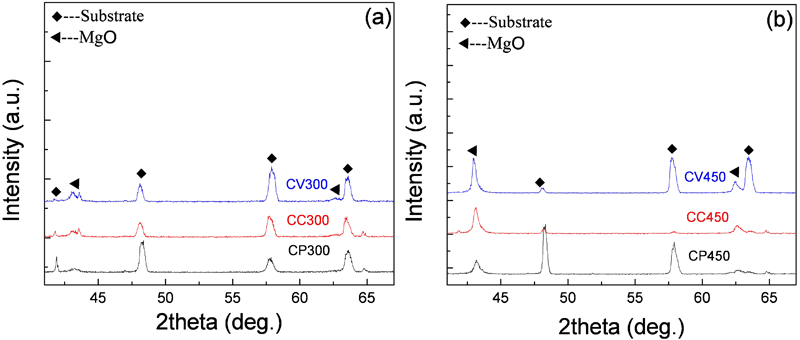
X-ray diffraction patterns of coatings prepared under different power modes:
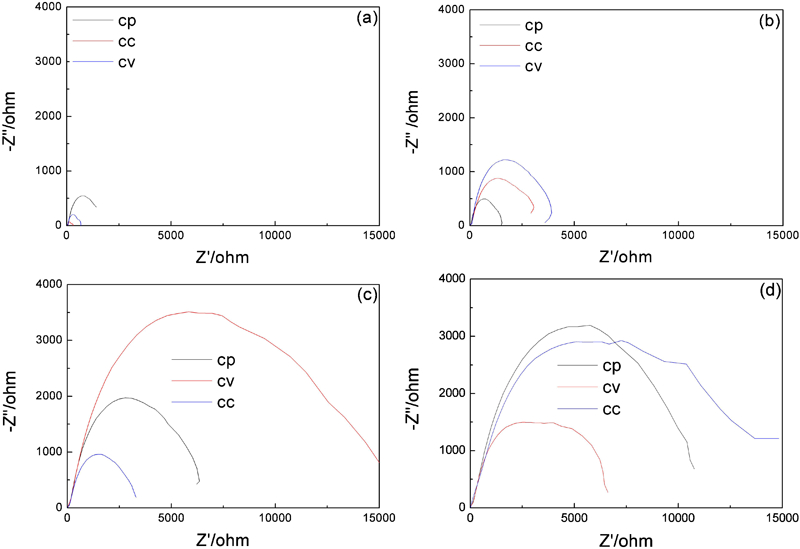
Electrochemical impedance spectra (Nyquist plot) of coatings prepared under different power modes
Energy dispersive spectroscopy analysis of coatings prepared at 300 and 450 V under different power modes
Corrosion resistance of coatings
EIS measurement and analysis
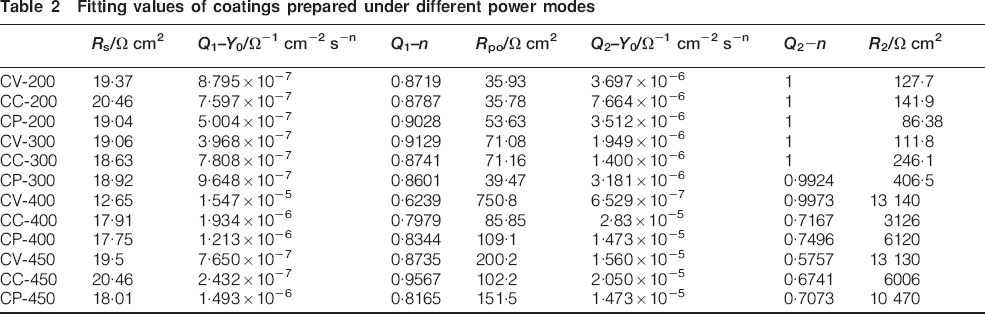
Figure 5 is EIS (Nyquist plot) of the coatings prepared under different power modes. According to our previous study,15 the equivalent circuit of EIS spectra <Rs{Q1[R1(Q2 R2)]}> was adopted. Rs is the electrolyte resistance between the working and reference electrode, Q1 is the constant phase angle element used to reflect the capacitance of the interfacial and pores in outer layer Cif, R1 is the pore resistance of the coating's outer layer, R2 is the electric charge transfer resistance corresponding to the inner layer and Q2 is the constant phase angle element corresponding to the structure of the inner layer. The fitting values of equivalent circuit elements are shown in Table 2. According to the established ‘equivalent circuit’, the sum of R1 and R2 approximately equals the polarisation resistance Rp, which is able to reflect the corrosion resistance of the coatings. Under CV mode, the coatings prepared at 400 and 450 V are of better corrosion resistance, while the coatings prepared at 450 V under CC and CP modes both have better corrosion resistance. However, the coatings prepared at 480 V under different power modes were all very rough due to the long periods of large sparking discharging on the coating surface, which leads to the great decrease in the corrosion resistance. Among different power modes, the corrosion resistance of the coatings is generally increased in the sequence CV>CP>CC.
Fitting values of coatings prepared under different power modes
Polarisation curves measurement and analysis
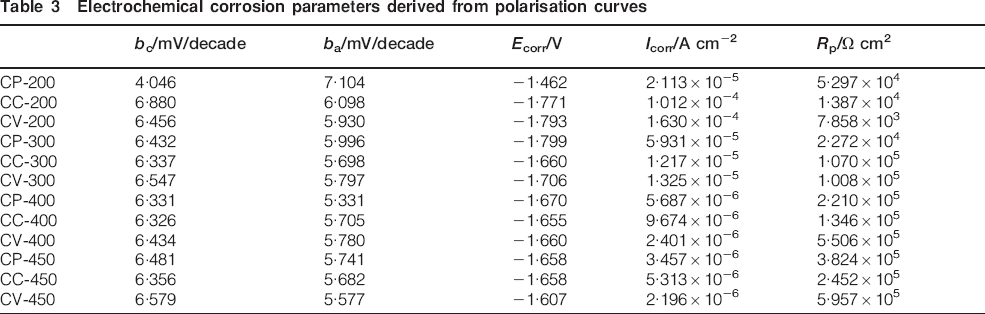
To further verify the corrosion resistance of the coatings, the polarisation curves were measured, and the results are shown in Fig. 6. A summary of the electrochemical corrosion parameters derived from the polarisation curves is also listed in Table 3. Moreover, ba and bc are the anodic/cathodic Tafel slopes respectively. Compared to Table 2, it can be noted from Table 3 that the values of Rp from this polarisation curve method are a little larger than those from EIS tests, but have the same tendency or classification presented by EIS analysis.
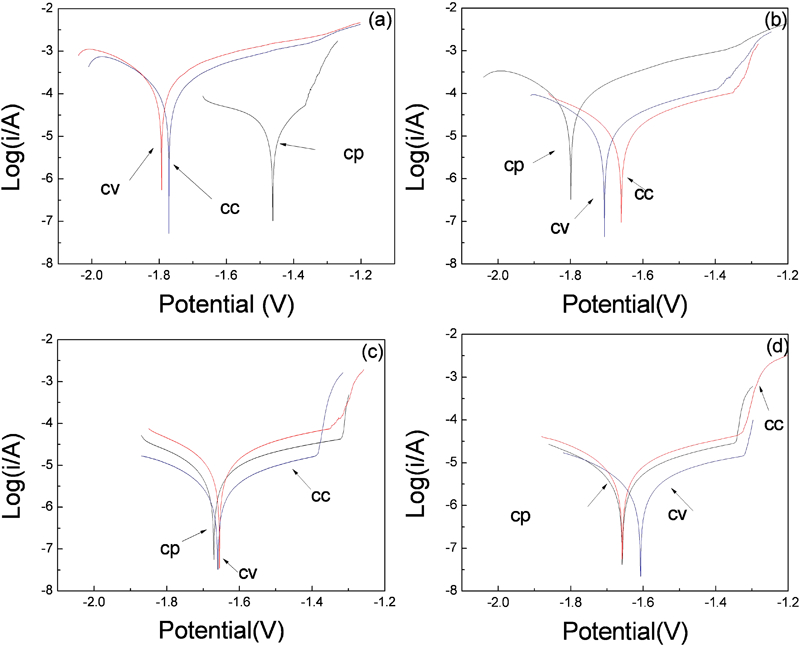
Polarising curves of coatings prepared under different power modes
Electrochemical corrosion parameters derived from polarisation curves
Generally, the corrosion resistance of the coatings is related to the composition and the structure. The results of EDS analyses show that all the coatings have similar composition under different reaction conditions; therefore, the corrosion resistance of the coatings is mainly attributable to the structure and surface state of the coatings. During the CV process, the coating continued to grow, which may be liable for self-repairing of the coating and in the meantime presents a certain sealing effect for the inner layer of the coating. In addition, the coatings prepared under CV mode have the maximum thickness and better crystallisation. Therefore, the best corrosion resistance was obtained under the CV mode. As for CP mode, the coating shows the smallest surface roughness and the best density among the three kinds of coatings; therefore, such coating prepared under CP mode had the second best corrosion resistance. As for the coating prepared under CC mode, although the CC is liable for the growth, it also destroys the dense structure of the coatings to a certain degree, which results into the worst corrosion resistance. On the other hand, under the same mode, the proper increase in the cell voltage is liable for improving the thickness and the quality of the coating and, therefore, increasing the corrosion resistance.
Conclusion
The coatings are of microporous structure. Both the thickness and the roughness of the coating abide by the following sequence: CV>CC>CP. The number of micropores is decreased, while the size is increased with the cell voltage or in the sequence of CP, CC and CV mode.
The coating is composed of a large amount of O and Mg and a small amount of P, Al, Ca and Na. X-ray diffraction analysis shows that the main crystalline in the coating is MgO, which is increased in the sequence of CP, CC and CV mode, or with the increase in the cell voltage.
The coatings prepared under CV mode are of the maximum thickness and better crystallisation and, therefore, present the best corrosion resistance. The coating prepared under CP mode shows the smallest surface roughness and best density, therefore having the second best corrosion resistance. On the other hand, the coating prepared under CC mode showed the worst corrosion resistance.
Footnotes
Acknowledgements
This work was financially supported by the Special Foundation for New Teachers of Doctor course in Chinese Education Ministry (grant no. 200802131065) and China Postdoctoral Science Special Foundation (grant no. 201003426).