
Abstract
The aim of the present paper was to quantify the significance of uncoated and S phase coated medical grade stainless steel (MGSS) surfaces with simulated scratch dimensions, akin to those generated in vivo, on the overall ultrahigh molecular weight polyethylene (UHMWPE) wear factor, i.e. to establish whether or not scratch lips generated under physiologically relevant loading conditions serve to augment the overall wear factor produced by the mean plate asperity heights of the polished metallic counter surfaces. A 29% increase in UHMWPE wear factor was produced when sliding against non-scratched N19 S phase coated MGSS compared to those obtained when apposing uncoated MGSS. This was attributed to the tested coated surfaces having ∼1·7 times more microasperities per 50 μm test length in the direction of sliding contact compared to the uncoated surfaces. A validated experimental procedure for creating scratched metallic surfaces with dimensions (lip heights and groove depths) towards the upper bound of those observed on MGSS explants was used to show that a critical minimum threshold scratch lip height must be reached before it influences the UHMWPE wear factor beyond that due to the interaction with the microasperities alone. The N19 S phase coating effectively reduced the potential detrimental effect of prior scratching by suppressing the height of attainable scratch lip heights, i.e. a mean lip height of 0·23±0·09 μm produced on the N19 S phase coated MGSS was insufficient to alter the mean UHMWPE wear rate, whereas the larger mean scratch lip height of 1·28±0·29 μm produced on the uncoated MGSS caused an increase in the mean UHMWPE wear factor by ∼34%. In addition, two types of UHMWPE wear morphology were identified. Type A comprised wave-like or rippled areas, while type B zones had a less regular roughness. Both zones contained plate-like features (flakes), which are one possible origin of UHMWPE debris. The extent of type A formation was qualitatively observed to increase with increasing UHMWPE wear factor.
Introduction
Many clinically successful implanted total hip (THR) and knee replacements utilise metal on ultrahigh molecular weight polyethylene (UHMWPE) bearing components that articulate against each other during the walking cycle. Within the UK, until very recently, high nitrogen, medical grade (austenitic) stainless steel (MGSS), ISO 5832-9/ASTM F1586-95, was the most commonly used of all the metallic alloys used for the femoral head of the Charnley THR.1 The ‘rejection’ of orthopaedic implants by the human body is principally due to the macrophage response towards accumulated wear debris that leads to bone stock loss (resorption) and subsequent aseptic loosening (osteolysis).2 For metal on polymer sliding contacts, the most detrimental debris originates from abrasion (microploughing and/or microcutting) of the UHMWPE acetabular cup surface. There are two major categories of abrasion3 of importance to UHMWPE wear: (1) two-body abrasion and (2) three-body abrasion. Both are prevalent in vivo and contribute to the overall UHMWPE wear factor. The response to two-body abrasion is the easiest to reproduce in laboratory testing, where it has been demonstrated that the UHMWPE wear factor (for a given UHMWPE Ra) is proportional not only to the Ra of the metallic counterface4 but also to its surface shape or geometry on the micro- and nanometre scale. The use of hard coatings for orthopaedic implant bearing surfaces has received much laboratory investigation,5 – 10 and a number of these key coating and substrate combinations are collated in Table 1. While most attention has been paid to interstitial compound coatings such as TiN, CrN and various kinds of diamond-like carbon (DLC), it appears that metastable solid solution coatings, such as nitrogen S phase,11 also hold significant prospects for this application. When produced by the physical vapour deposition (PVD) technique of magnetron sputtering, metastable nitrogen S phase coatings with a nitrogen concentration [N] range from 8 to 32 at-%N can be synthesised.11 Such coatings have a Vickers hardness (HV) that increases linearly with increasing at-%N concentration according to the relationship HV = 43·6[N]+520.12 To date, the plane strain fracture toughness of nitrogen S phase coatings has not been quantified. However, the response of nitrogen S phase coated MGSS to scratch testing under physiologically relevant scratch loads has shown that when [N] is <20 at-%, the coating fracture growth associated with scratch damage is less intensive than at higher [N] levels,13 i.e. the ‘best’ fracture toughness is possible when [N] is <20 at-%.
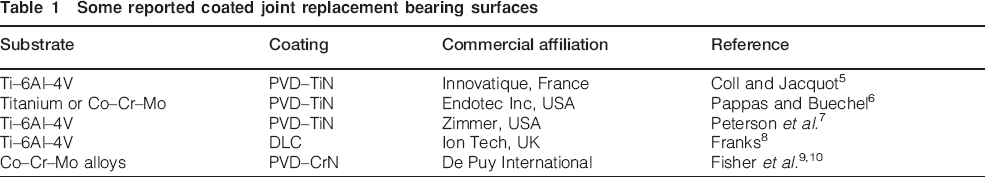
Some reported coated joint replacement bearing surfaces
An example of an uncoated MGSS femoral head surface, explanted after 17 years in vivo, is shown in Fig. 1. When examined by two-dimensional (2D) contacting profilometry, such scratches often show the features shown in Fig. 2, which comprise ‘shear lips’ of slightly differing heights (h1 and h2) on either side of the main scratch groove that has some depth (d). [It should be noted that h1, h2 and d are associated with characteristic full width at half maxima (FWHM) as defined in Fig. 2.] An example of two parallel scratches on an MGSS explant femoral head surface, with associated shear lips, is shown in Fig. 3a, while Fig. 3b shows another scratch, on the same MGSS explant, where no shear lips were detected. The latter indicates that shear lips are often removed in vivo, resulting in debris that adds to the supply of three-body particles that contribute to abrasion wear of UHMWPE in vivo. Other sources of third body particles include natural bone fragments residual from total hip arthroplasty and bone cement (polymethyl methacrylate) particles. Although it is accepted that third body particles are important for contributing to the total UHMWPE wear factor in vivo, this mechanism is not simple to simulate in laboratory based sliding contact tests. There are many problems, not least of which is assuring that the entrainment of third body particles between the sliding contact surfaces has a constant, quantifiable and reproducible mass flow rate and third body particle size distribution. Accordingly, a more pragmatic approach is to emulate two-body abrasion by prescratching the metallic component before conducting either pin on plate or simulator tests.14, 15 Here, the role of scratch lip height (h1 and h2 in Fig. 2) can be investigated and distinguished from that of the contribution to the UHMWPE wear factor from the background asperity heights of non-scratched polished metallic counterfaces. In a recent paper,16 pin on plate tests carried out in bovine serum solution showed that the UHMWPE wear factor increases slightly with increasing mean plate asperity height for polished uncoated and S phase coated MGSS materials (Fig. 4), of which the latter contained [N] with 8, 19 and 26 at-%N (coded N8, N19 and N26 respectively). It is the aim of the present paper to quantify the significance of uncoated and S phase coated MGSS surfaces with defined scratch lip heights on the overall UHMWPE wear factor, i.e. to establish whether or not scratch lips generated under physiologically relevant loading conditions serve to augment the overall wear factor produced by the mean plate asperity heights of the polished metallic surfaces.
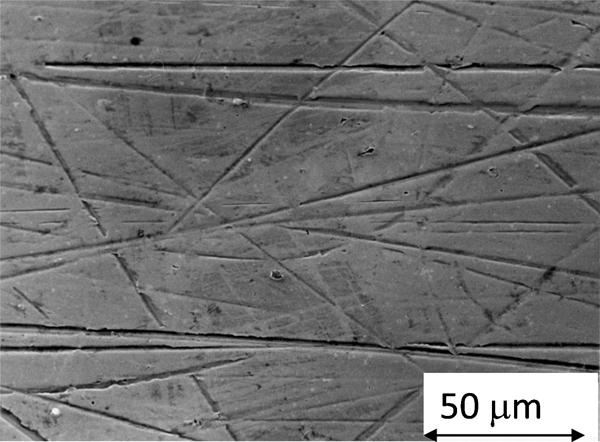
Medical grade stainless steel femoral head bearing surface THR explant after 17 years in vivo (note multidirection scratches)
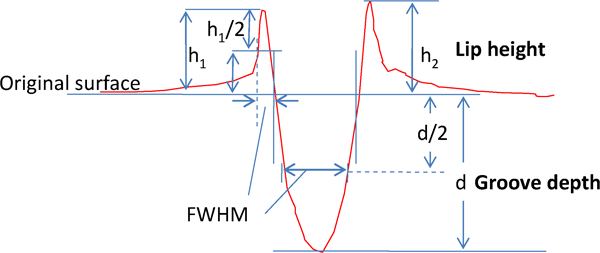
Definitions of scratch dimensions showing lip heights, grove depths and their associated FWHM
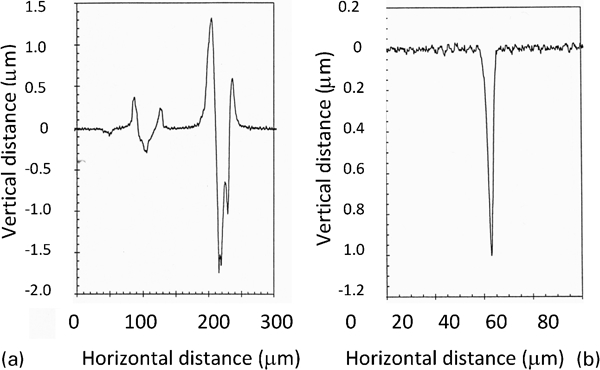
Examples of scratch profiles from MGSS explants showing a two parallel and adjacent scratches with associated lips and b scratch where lips have been removed via shear in vivo
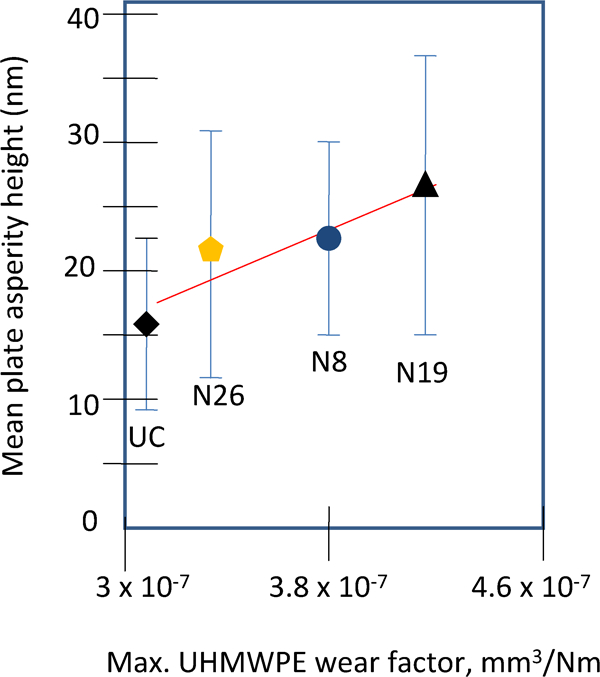
Correlation between maximum UHMWPE pin wear factor and mean plate asperity height for apposing uncoated (UC), N26, N8 and N19 S phase coated MGSS: error bars represent one standard deviation
Materials and methods
Test materials
Both MGSS plates and UHMWPE extruded bar stock material (GUR 1120) were supplied by De Puy International (Leeds, UK). The UHMWPE was not gamma irradiated. The composition of the MGSS plates is given in Table 2.
Composition of Ortron 90

PVD coating with S phase
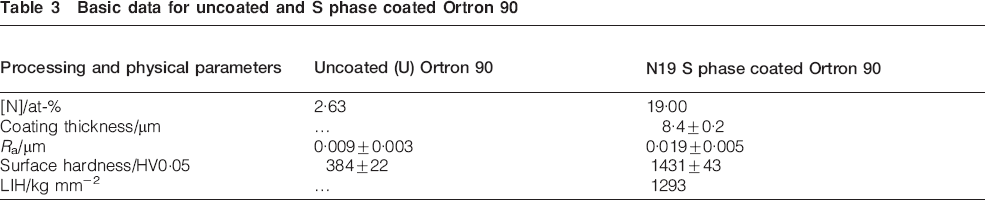
Before coating deposition, polished MGSS substrates were mounted within the Leeds PVD unbalanced magnetron sputtering system and were radio frequency (13·56 MHz) plasma etched (cleaned) in pure Ar for 1 h using 200 W of forward power. The N19 S phase austenitic stainless steel coatings (supersaturated with 19 at-%N) were synthesised by reactively sputtering a 150 mm diameter 316L (Fe–18Cr–11Ni–2·5Mo) austenitic stainless steel target in a partial pressure of N2 of 2·4×10−2 Pa (the balance of the deposition atmosphere being Ar). The target was always sputter cleaned for 5 min before use to ensure the removal of unwanted contaminants. A self-bias of −50 V was maintained throughout the deposition cycle of the process. Further details of the coating thickness and hardness are cited in Table 3. The substrate temperature did not exceed 200°C during deposition. Greater details concerning the sputtering conditions needed to produce S phase coatings can be found elsewhere.11
Basic data for uncoated and S phase coated Ortron 90
Rationale for using pin on plate testing
To enable relatively rapid ab initio evaluation for proof of concept testing of new bioimplant bearing materials, it is sensible to use a simple pin on plate testing method rather than more elaborate and costly hip simulator tests like those performed using the Leeds II hip joint simulator.14, 15 From extensive analysis,17 it has been shown that simultaneous rotation during sliding is important in hip joint replacements in vivo, which can be reproduced in state of the art hip joint simulators. The action of this bidirectional sliding is to cause a phenomenon known as ‘cross shear’, which is more ‘aggressive’ in creating UHMWPE wear debris than single direction reciprocation sliding. In the present work, a simultaneous rotation of ±40° was introduced to the reciprocation pin on plate testing procedure (see the section on ‘Pin on plate testing’), which, although greater than the rotation introduced during adduction–abduction of a THR in vivo or in the physiology of the natural joint, nonetheless yields cross shear of similar magnitude but in a planar rather than a polar orientation.17 It should be appreciated that this type of testing was adopted as a precursor to more advanced hip simulator testing and was not intended as a replacement or alternative method of investigation. It is also fair to say that the pin on plate tests used here are quite simple in that they utilise a constant compressive load rather than the more complex sinusoidal cyclic compressive twin peak Paul type loading that is achieved with advanced hip simulators.14
Pin on plate testing
Pin on plate tests were carried out using a six-station pin on plate reciprocating machine, which was designed and built at The University of Leeds.18 Further details of this test apparatus are given elsewhere.16 The UHMWPE pins and apposing coated and uncoated stainless steel plates were immersed in 25 (v/v) bovine calf serum diluted with deionised water containing 0·1 wt-% of sodium azide. All tests were carried out at ambient temperature (20±2°C). While lower than human body temperature, this procedure is considered acceptable for first level, ab initio screening wear testing purposes before more advanced hip simulator tests.
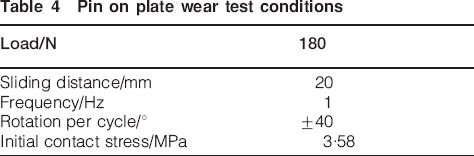
Cylindrical UHMWPE pins, 12 mm in length and 12 mm in diameter, were machined to produce pins with the geometry shown in Fig. 5a. Each pin was truncated to give wear test contact diameter of 8 mm that when loaded resulted in an initial contact stress of 3·58 MPa. Other test conditions are cited in Table 4. In all cases, the UHMWPE pins were used in the ‘as machined’ state (Ra = 1·74±0·54 μm).
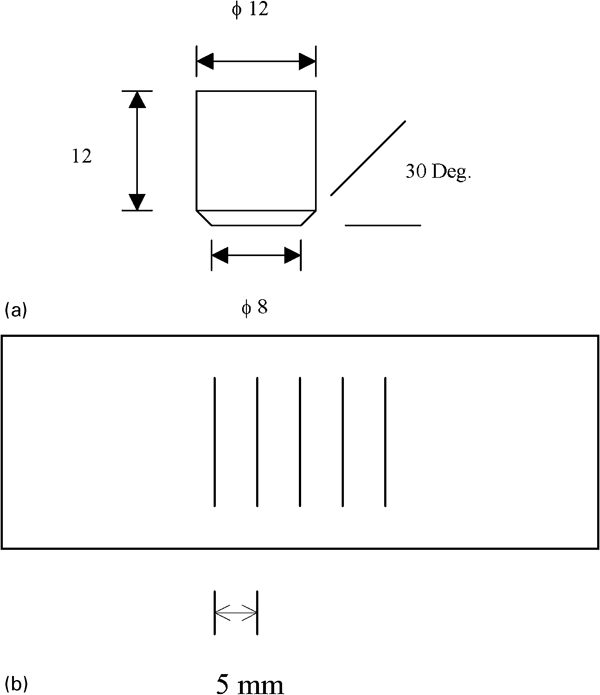
Essential features of a UHMWPE test pin geometry (dimensions in mm) and b arrangements of scratches on polished uncoated and N19 coated MGSS test plates
Pin on plate wear test conditions
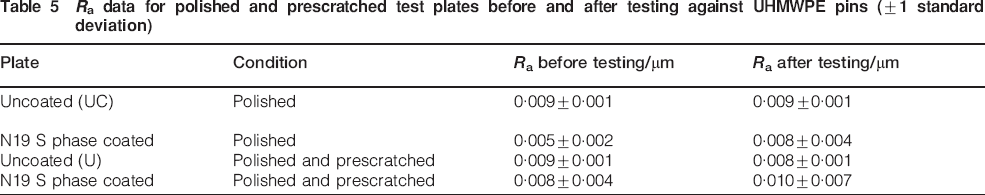
The MGSS sliding contact test surfaces were ground flat using emery papers incrementally graded from grit sizes of 200–1000 and automatically polished using 6 and 3 μm diamond paste. The test plates were thoroughly cleaned between each grinding and polishing stage to avoid contamination by unwanted abrasive particles. All the N19 S phase coated plates were repolished after deposition. The mean Ra of the plates before and after pin on plate wear testing, determined by Talysurf 2D contacting profilometry, is shown in Table 5. At least five measurements were taken within each test track. The data for the plates, scratched after polishing, refer to the Ra values determined between the scratches, i.e. in regions that excluded the scratches. No evidence of UHMWPE film transfer was detected on the MGSS plates as deducted from light optical microscopy (Leica, Cambridge Instruments) and SEM (Philips XL-30) back scattered and secondary electron imaging observations.
Ra data for polished and prescratched test plates before and after testing against UHMWPE pins (±1 standard deviation)
Profilometry
Both 2D contacting (Talysurf, Taylor Hobson, UK) and 3D optical (Wyko interferometer, Veeco) surface profilometries were carried out to determine the overall surface roughness Ra, the maximum lip heights h1 and h2 and the scratch groove depth (d) and their associated FWHM values, as defined in Fig. 2.
Scratch damage simulation and validation
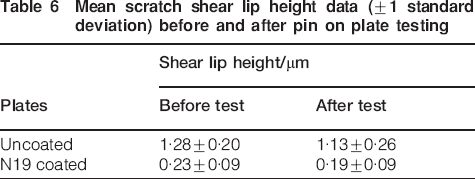
The polished uncoated and N19 S phase coated MGSS test plates were prescratched by applying a 500 g load to a 100 μm radius tipped conical diamond stylus tool. Five 15 mm long scratches placed 5 mm apart, oriented normal to the pin on plate sliding direction, were applied to a number of polished N19 S phase coated and uncoated MGSS test plates, as shown in Fig. 5b. Examples of the resulting scratch profiles, determined using 2D contacting profilometry before pin on plate testing, are shown in Fig. 6, while the mean scratch lip heights before and after pin on plate testing are shown in Table 6, and their associated 3D optical profiles are given in Fig. 7. Five surface roughness measurements were taken of each scratch and the regions between each scratch before and after pin on plate testing. The effect of the N19 S phase coating was to reduce the height of the scratch lips compared to those observed on the uncoated MGSS (Fig. 6), which is consistent with an identical effect previously reported for CrN coated Co–Cr–Mo15 as well as TiN and DLC coated MGSS.19
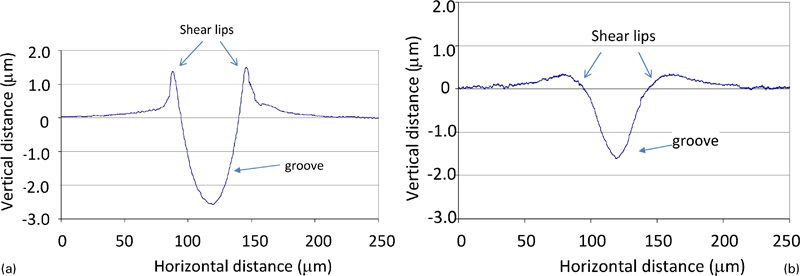
Examples of test plate scratch profiles (before wear testing) for a uncoated MGSS and b N19 coated MGSS
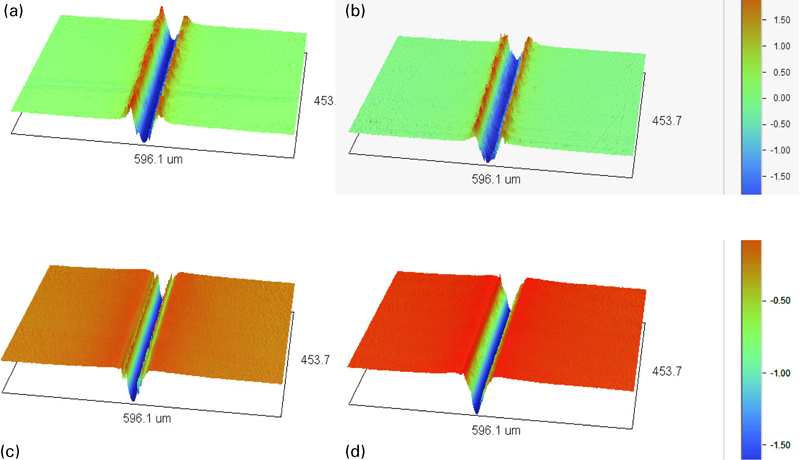
Examples of 3D profiles of scratched plates before and after wear testing with apposing UHMWPE: colour intensity numbers represent heights in micrometres:
Mean scratch shear lip height data (±1 standard deviation) before and after pin on plate testing
Validation for the scratch simulation approach can be considered as follows. The MGSS femoral head explant surface shown in Fig. 1 is a typical example showing numerous multiple multidirectional scratches produced in vivo. The scratch dimensions defined in Fig. 2 were analysed for a series of >20 MGSS explants. These data are summarised in Figs. 8 and 9. By way of example, the lip heights, groove depths and associated FWHM data derived from the laboratory scratching experiments, shown in Fig. 6, are superimposed within Figs. 8 and 9. These show that the scratch dimensions created by scoring both N19 coated and uncoated MGSS with a diamond stylus tool are towards the maximum values observed on uncoated MGSS explant surfaces produced in vivo by third body abrasion. Accordingly, the scratch methodology adopted in this work is validated as a means of introducing scratch damage similar to that which can be produced on uncoated MGSS in vivo. (Unfortunately, there are no coated explants available for similar analysis at this time, and so, the scratch damage introduced to the coated materials in the laboratory cannot be validated in a similar way.)
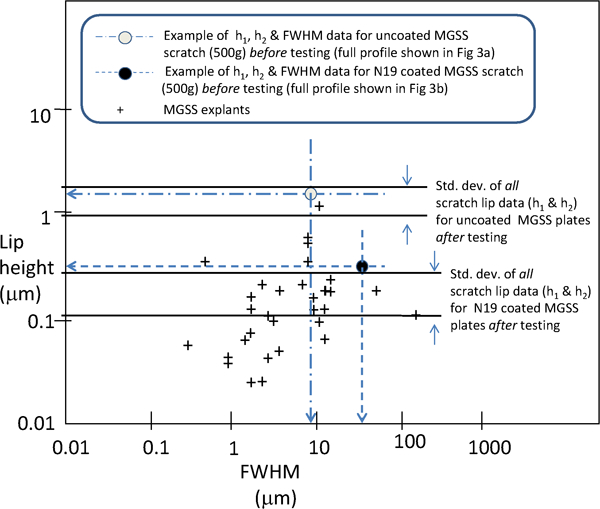
Scratch (500 g mass) lip height standard deviation data for uncoated and N19 coated MGSS test plates after wear testing with apposing UHMWPE compared to uncoated MGSS explant lip heights and associated FWHM data: specific (500 g mass) data for scratch profile examples (before wear testing) and shown in Fig. 3 are indicated by dashed lines
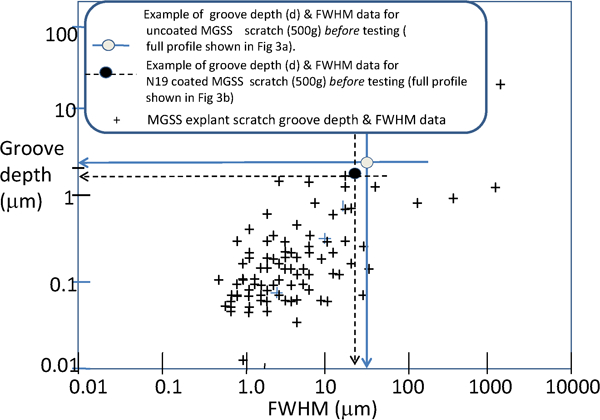
Specific (500 g mass) scratch groove depth data for one example of uncoated and N19 coated MGSS test plates before testing (shown in Fig. 3) compared with uncoated MGSS explant scratch grooves and their FWHM data
UHMWPE wear determination
Before pin on plate testing, the UHMWPE pins were soaked in deionised water for a minimum of 14 days to permit water absorption. This assured pin stabilisation by minimising any subsequent mass gain from atmospheric moisture during testing. The UHMWPE pin mass was measured before commencing testing as well as after every week of testing. The measurements were carried out using a Mettler Toledo balance, accurate to ±0·5 μg. After removal from the pin on plate apparatus, and before weighing, the worn pins were placed in a climatically controlled room (temperature 20°C, humidity 40%) for at least 46 h in order to stabilise their mass. The wear factor [volume/(sliding distance×applied load)] was obtained by plotting the cumulative wear mass loss against sliding distance and then determining the slope of the resulting graph using linear regression that assumed the data to follow an equation of type


Friction coefficient measurements
The friction coefficient of UHMWPE against uncoated and N19 coated Ortron 90 was measured using a simple configuration reciprocating pin on plate machine dedicated for friction measurements. Friction force measurements were performed after running the test apparatus for 20 min with an applied load of 25 N (contact stress of 0·5 MPa), frequency of 1 Hz and sliding distance of 40 mm per cycle. Although this contact pressure was less than the starting contact pressure used in the pin on plate testing (3·58 MPa) (Table 4), the tests still served to detect differences in friction coefficients caused by differences in the material surface chemistry and geometry of the uncoated and S phase coated MGSS.
Results
Coating and substrate characterisation
All the N19 coatings were ∼8 μm thick and had an as deposited surface roughness (Ra) of ∼0·02 μm (Table 3) compared to the original uncoated surfaces about 0·005–0·009 μm. Although this roughening was partly due to the formation of microholes and ‘macroparticles’ introduced during the coating deposition, significant background roughening took place before deposition through initial and deliberate intensive ionic bombardments (etching) of the substrates made possible by the application of a radio frequency plasma.11 Subsequent polishing of the coated surfaces before pin on plate testing achieved Ra values comparable to the uncoated Ortron 90 test plates (Table 5). The Ra values shown for the polished coated plates that were subsequently laboratory scratched were determined from the non-scratched regions of the plate surfaces.
Friction tests
Both N19 S phase coated plates displayed similar friction coefficients (∼0·065), which were ∼25% lower than those observed for the uncoated MGSS (∼0·09; Fig. 10). This was probably primarily due to the slightly lower surface roughness of the polished coated plates (Table 5).
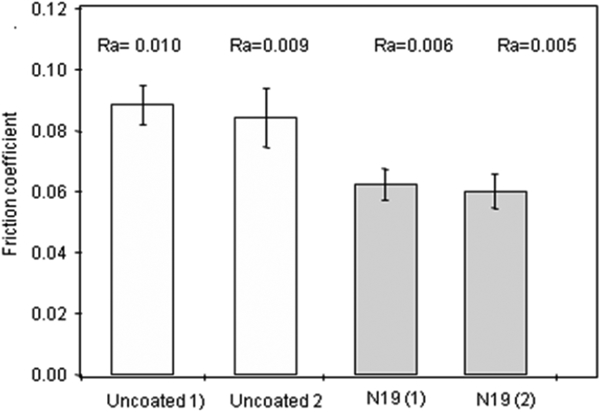
Friction coefficient data for UHMWPE pins apposing uncoated and N19 S phase coated MGSS
Wear of UHMWPE pins
The mean UHMWPE wear factors (for five pins per test plate) determined at the cessation of pin on plate testing are collated in Fig. 11, while four examples of the progression of the mean UHMWPE pin wear (mass losses) during pin on plate testing for uncoated and N19 S phase coated MGSS, with and without prior scratching, are shown in Fig. 12. It is apparent that laboratory scratching of the N19 coated MGSS with a diamond stylus had no measurable effect on the UHMWPE mass loss, while a higher mass loss was observed for the UHMWPE wear when sliding against scratched compared to sliding against non-scratched uncoated MGSS. Optical profilometry 3D imaging and accompanying extracted 2D profiles (after pin on plate testing) of the polished and non-scratched regions of the MGSS test plates are shown in Fig. 13.
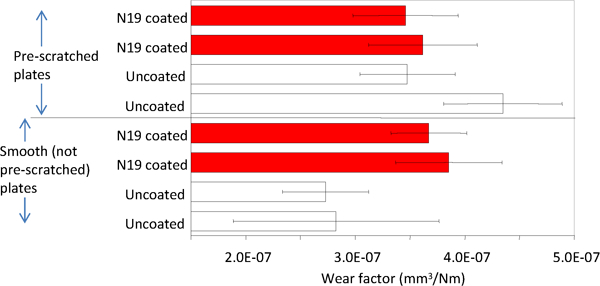
Mean wear factor values of UHMWPE pins obtained against smooth and prescratched coated and uncoated MGSS plates after pin on plate testing: error bars represent 95% confidence limits
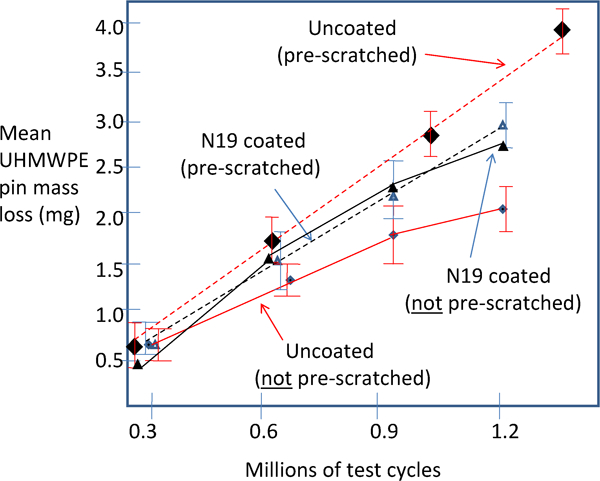
Examples of development of UHMWPE pin mass losses (during pin on plate testing) as function of test duration when apposing smooth and prescratched N19 S phase coated and uncoated MGSS plates: error bars represent 95% confidence limits
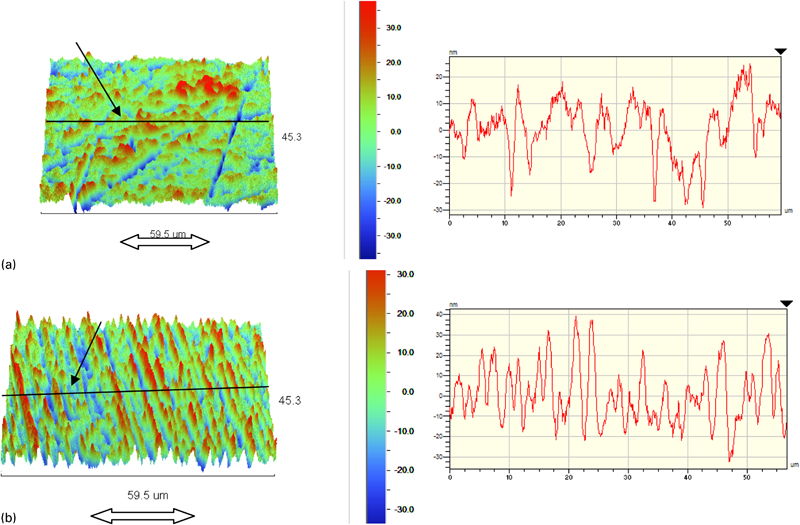
Examples of 3D (left hand side) and extracted 2D (right hand side) profiles of non-scratched a uncoated MGSS plate surface and b N19 S phase coated MGSS plate surface after wear testing against UHMWPE pins. Colour intensity numbers represent topographical heights in micrometres: sliding direction is indicated by double arrows
Examination of the UHMWPE wear surfaces after pin on plate testing showed two main types of wear morphology (Fig. 14). Type A comprised wave-like or rippled areas, while type B zones had a less regular roughness. Many of the ripples, examined by profilometry, were shown to have a wavelength of up to 4 μm and an amplitude of about 0·2–0·8 μm (Fig. 15a and b). Type B regions (Fig. 14) contained irregular undulations with no particular orientation (Fig. 15c and d), and there was an absence of ripples. Both types A and B morphological regions contained fine scratches and plate-like features (flakes), e.g. as shown in Fig. 7b, with a maximum height of ∼0·7 μm, which may be an important mechanism of polymer material loss (wear).
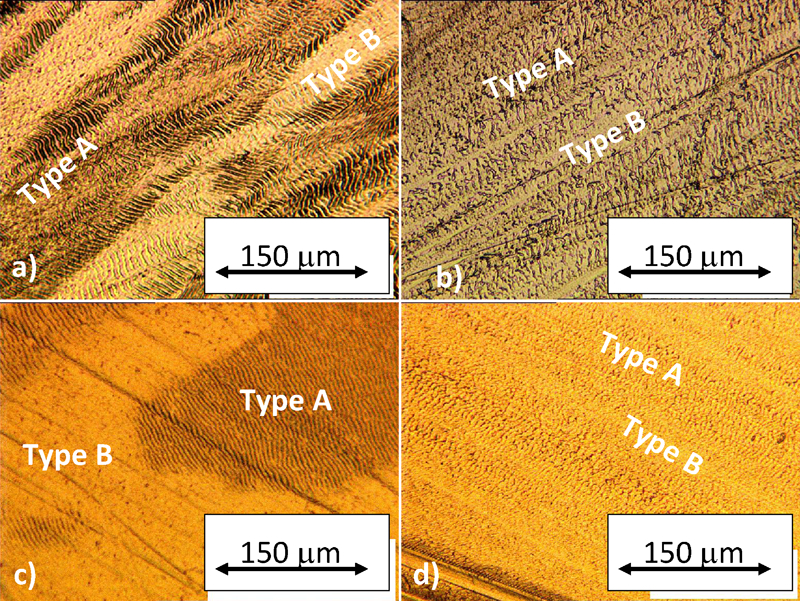
LOM pictures of worn UHMWPE pin surfaces showing types A and B wear morphologies resulting from sliding against apposing a, b prescratched uncoated MGSS and c, d prescratched N19 coated MGSS
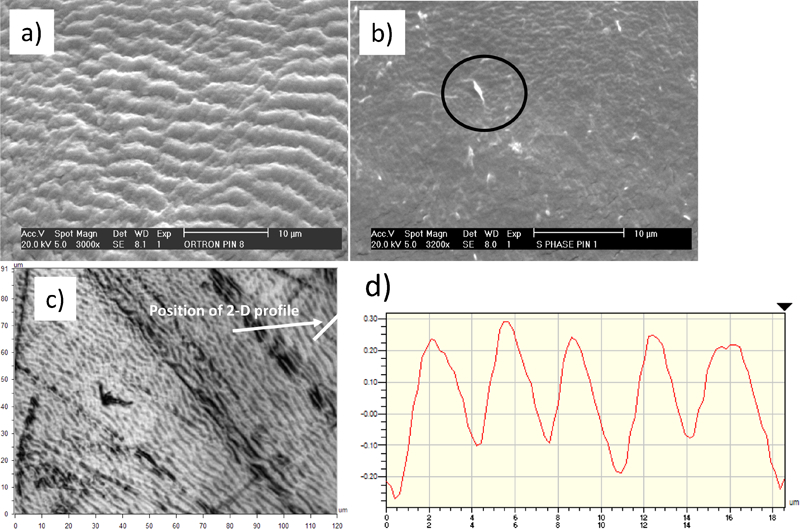
Worn UHMWPE pin surfaces:
Discussion
The higher UHMWPE wear factor produced when sliding against non-scratched S phase coated MGSS compared to those obtained when apposing uncoated MGSS (Fig. 11) agreed with similar differences in UHMWPE wear factors previously reported for TiN coated and uncoated MGSS,20 as well as CrN and DLC coated and uncoated Co–Cr–Mo.15 Optical profilometry examination (after pin on plate testing) of the polished and non-scratched regions of the MGSS test plates showed a subtle difference between the coated and uncoated surfaces. It was evident from the extracted 2D profiles (the right hand images in Fig. 13) that the tested coated surfaces had ∼1·7 times more asperities per 50 μm test length in the direction of sliding contact compared to the uncoated surfaces. Hence, a higher incidence of second body abrasion of UHMWPE caused by the non-scratched regions of the coated MGSS plates would be possible. Here, the mean UHMWPE wear factor increased from ∼3·00×10−7 mm3 Nm−1 when apposing uncoated MGSS to ∼3·8×10−7 mm3 Nm−1 when apposing N19 coated MGSS (Fig. 11). This re<@?show=[fo]?>presents an increase of ∼29% due to the higher density of asperities.
From the results shown in Figs. 11 and 12, it appears that the magnitude of the lip height must exceed a critical threshold value before it is able to influence the UHMWPE wear factor beyond that which is due to the interaction with the asperities of the type shown in Fig. 13 for the non-scratched surfaces. For the N19 S phase coated scratched test plates, a mean lip height of 0·23±0·09 μm (Table 6) was insufficient to alter the mean UHMWPE wear rate compared to the non-scratched coated plates that had a mean asperity height of ∼25 nm (Figs. 4 and 13), whereas the larger mean scratch lip height of 1·28±0·29 μm (Table 6) of the uncoated MGSS caused an increase in the mean UHMWPE wear factor from ∼2·75×10−7 to ∼3·7×10−7 mm3 Nm−1, which represents an increase of ∼34%. Accordingly, it can be appreciated that the N19 S phase coating effectively reduced the potential detrimental effect of prior scratching by suppressing the height of the attainable scratch lip heights.
Although not quantified, it was apparent that the UHMWPE type A wear surface morphology was more dominant for those pins with the highest wear factors. This is probably a consequence of microasperity shearing, which involves a significant amount of strain hardening of the UHMWPE before eventual ductile fracture. The latter stage appears to involve the formation of plate-like features (flakes) (Fig. 7b), which probably are at least one origin of UHMWPE debris, although such features can be formed in both morphological zones. Accordingly, the types A and B morphology zones have the potential to form plate-like features and UHMWPE debris.
Conclusion
The following conclusions are based upon a series of pin on plate tests carried out on polished N19 S phase coated and uncoated MGSS ISO 5832-9/ASTM F1586-95, apposing UHMWPE. Specific attention was placed on evaluating the influence of prior scratching to emulate in vivo damage.
A validated experimental procedure for creating scratched metallic surfaces with dimensions (lip heights and groove depths) towards the upper bound of those observed on MGSS explants was demonstrated.
A 29% increase in UHMWPE wear factor was produced when sliding against non-scratched N19 S phase coated MGSS compared to those obtained when apposing uncoated MGSS. This was attributed to the tested coated surfaces having ∼1·7 times more microasperities per 50 μm test length in the direction of sliding contact compared to the uncoated surfaces.
It was demonstrated that the magnitude of the scratch lip height had to exceed a minimum critical threshold value before it made a significant influence on the UHMWPE wear factor beyond that ordinarily due to microasperities alone. A mean lip height of 0·23±0·09 μm produced on the N19 S phase coated MGSS was insufficient to alter the mean UHMWPE wear rate, whereas the larger mean scratch lip height of 1·28±0·29 μm (Table 6) for the uncoated MGSS caused an increase in the mean UHMWPE wear factor by ∼34%.
The N19 S phase coating effectively reduced the potential detrimental effect of prior scratching by suppressing the height of the attainable scratch lip heights and therefore demonstrated potential for use in bioimplant bearing surface applications.
Two types of UHMWPE wear morphology were identified. Type A comprised wave-like or rippled areas, while type B zones had a less regular roughness. Both zones contained plate-like features (flakes), which are one origin of UHMWPE debris. The extent of type A formation was qualitatively observed to increase with increasing UHMWPE wear factor.
Footnotes
Acknowledgements
The authors thank De Puy International (Leeds, UK) for providing the Ortron 90 MGSS used in the work reported here. One author (CGF-P) wishes to thank the Instituto Politecnico de Setúbal (Setúbal, Portugal) for the provision of a post-graduate research scholarship. Professor J. Fisher of The University of Leeds is thanked for his enthusiastic support of this work.