
Abstract
Corrosion of one type or another occurs in almost every environment and high performance corrosion protection methods are often too expensive to be economically viable. This work examines the performance of protective layers of Inconel 617, laser clad in the form of salvaged machining chips, to protect a corrosive substrate from both mild and harsh environments. The clad layers are investigated for microstructure and phase composition and polarisation measurements used to determine their corrosion resistance in neutral and acidified NaCl electrolyte solutions. The clad microstructure was discovered to be columnar dendritic, with an atypical upper layer. However, neither this nor any dilution by the substrate compromised the corrosion resistance of the Inconel 617, and the clad layer provided very good corrosion protection. The results confirm the viability of using this method as a low cost corrosion protection method for both mild and harsh environments.
Introduction
Corrosion is a well recognised but enduring problem in industry and the developed world in general.1 Metallic materials are used widely, and the corrosion of these is subject to accelerating factors including moisture, temperature and different chemicals from a wide range of industries. The choice of corrosion protection method for a component is dependent upon a number of factors including the type and severity of the corrosive environment, whether the part is subject to wear and abrasion, the required appearance of the part, the criticality of the part and the cost of the method. There are three basic methods, i.e. barrier protection, inhibitive protection and galvanic protection, from which the first is usually preferred in immersed, marine and industrial atmospheres.2
Application of an organic coating is a widely used barrier protection technique. There are actually multiple methods within this category, and they can vary greatly in sophistication, from the simple spray gun to method such as hot melt wax coatings (thermoplastic corrosion prevention compounds) and sol–gel coatings.3 However, these methods have many disadvantages as outlined by Hu et al.4 They have low mechanical strength and generally perform poorly in abrasive environments.
Metallic coatings are generally stronger. Stainless steel coatings perform well in many corrosive environments because the chromium content of the steel produces a ‘self-healing’, protective oxide film on the surface.5 Steel–ceramic coatings have also been created to provide a combination of wear and corrosion resistance.6 However, the protection that can be provided is limited by the fact that steels suffer localised corrosion in specific environments, particularly in chloride ion rich solutions.7
Coating with a range of other metals is also possible. Zinc alloy is a popular metallic barrier method. Zinc–nickel produces the highest corrosion resistance: it has been found that the corrosion resistance of zinc–nickel alloys in wet salt environments is approximately three times that of pure zinc.8 A detailed study by Gavrila et al.9 found that the electrodeposited alloy corrodes in a localised manner with the appearance of surface cracking and partial dezincification in a neutral, saline, aqueous environment.
Nickel based alloys are now widely used. Akin to stainless steels, the superior corrosion resistance of nickel based alloy is closely related to the formation of a passive film on the surface, and a comparative study has indicated that it offers better protection than stainless steels such as 304 and 316L.10 Salt spray corrosion tests by Serres et al.11 and a previous work by the authors using a 3·5%NaCl electrolyte12 both showed that nickel alloys exhibit very high corrosion resistance. Zheng et al.13 verified that Inconel 718 alloy can be used for corrosion protection in environments with high partial pressure H2S and CO2 but noted that the passive film resistance reduced and the passive film capacitance increased gradually as the corrosion environments turned rigorous. Tan et al.14 examined their potential for use in nuclear plants.
In addition to the coating material used, the method of application is important. As pointed out by Sorensen et al.,2 the presence of inhomogeneities such as air bubbles, cracks, microvoids, contaminants, non-bonded and weak areas can influence the transport of aggressive species through a coating and subsequently affect the degradation process. Neville and Hodgkiess demonstrated that even applying the same type of coating in different ways could make a profound difference to the corrosion mechanism and hence its performance in corrosive conditions.15 Laser treatment has been shown by various authors to provide increased corrosion resistance,16, 17 but there has been little work concentrating on the corrosion of laser clad layers, with work concentrating more on the wear properties. In the limited work available, Cai et al.18 found that increasing Cr increased the corrosion resistance of a clad Cr alloyed Ni2Si/NiSi nickel silicide coating. Pimenova and Starr19 tested 49 different laser deposited Ti–xAl–yFe alloys, concluding that the uneven distribution of alloying elements in the phases resulted in generally poor corrosion resistance in biofluids. However, this work took no account of possible dilution effects when depositing a protective layer.
This paper experimentally investigates the corrosion protection provided by Inconel 617, laser clad onto a metallic substrate. Inconel 617 is a solid solution, nickel–chromium–cobalt–molybdenum alloy, identified by Tan et al.14 as having the best corrosion resistance of a range of superalloys. Its high chromium and molybdenum contents make it resistant to a wide variety of both reducing and oxidising media.20 However, it is a relatively expensive alloy, meaning that cheaper materials often need to be used to reduce costs. The conditions found in possible areas of application such as petrochemical extraction can be considerably harsher than can be simulated by salt spray or NaCl electrolyte as in much previous research work with alloys of this type (e.g. Ref. 21), so testing in this work is performed in both mild and harsh conditions. The characteristics of the layers, effect of clad properties on final corrosion resistance and the nature of that resistance are analysed and discussed.
Experimental
Sample preparation
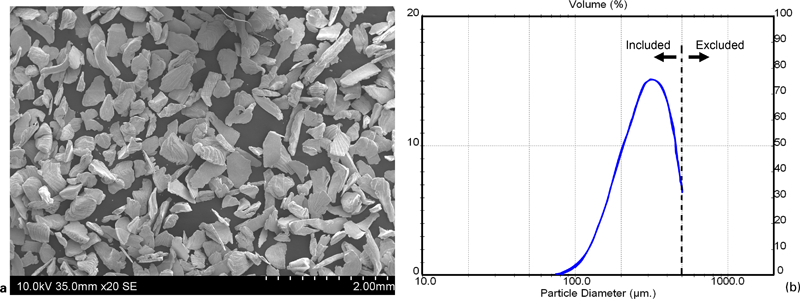
The apparatus used for the laser cladding is shown in Fig. 1 and can basically be divided into mass, energy and motion systems. Mass for the process was provided in the form of prepared swarf chips: waste Inconel 617 (22%Cr, 12%Co, 9%Mo, 2%Fe, 1%Al, <1%Mn, Si, S, Ti, Cu, B and balance Ni) swarf was collected from a Mikron HSM 400 type TNC 430M computer numerical control milling centre before the experiment and then cleaned by sonication using Branson 2200 equipment, dried in air at ambient temperature and reduced in size in a Pulverisette-13 disc mill. Chips of <300 μm were transferred to the powder feeder (Fig. 2). From here, they were conveyed via a 10 L min−1 argon stream to a lateral nozzle of 2 mm diameter inclined at 26° to the vertical during the cladding process. The swarf was clad onto sand blasted and degreased substrate blocks of 50×50×10 mm mild steel (EN-43A) positioned 10 mm from the nozzle.
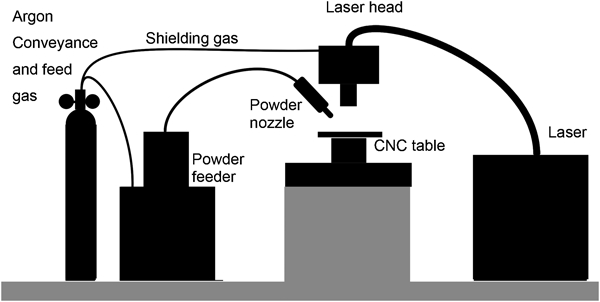
Experimental apparatus for laser cladding
Cladding material:
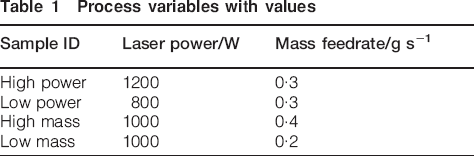
A 2 kW IPG YLR-200S multimode ytterbium fibre laser mounted vertically above the substrate provided energy for the process. The laser beam had a spot of 1·7 mm diameter at the substrate surface. Motion was provided by a two-axis computer numerical control (CNC) system with the third manually controlled (vertical) stage. This was used to trace a raster pattern in order to deposit a cladding layer composed of 10 parallel tracks with 50% overlap onto each of the substrates. All tracks were deposited at a speed of 5 mm s−1. Four combinations of laser power and powder mass feedrate were used, as shown in Table 1. Throughout the deposition process, argon was used both as the conveyance gas and as a shielding gas to prevent oxidation close to the melt pool.
Process variables with values
Sample analysis
After preparation, each clad layer was sectioned in horizontal and transverse planes and then mounted in phenolic resin. The samples were then prepared following standard metallographic procedure. After grinding and polishing, they were etched electrochemically using 10% oxalic acid and imaged using a Keyence VHX-500F optical microscope and an EVO50 ZIESS SEM. A lower magnification image was also taken and analysed using the thresholding method to obtain the surface profile of the samples. Polished samples sectioned in horizontal plane were used for phase characterisation. A Philips X'Pert diffractometer operated at 45 kV and 40 mA with Cu Kα radiations incident at 3° was employed. Samples were scanned in the 2θ range of 20–85°.
For passive alloys, the general corrosion rate is usually low and the life limiting factor in service is localised corrosion failure by pitting, cracking or crevice corrosion.22 To quantify this, samples of the substrate material (mild steel), parent bulk material of machining swarf (Inconel 617) and cladding layers were sectioned. These samples were spot welded with nichrome wire, cold mounted in epoxy to leave the sectioned area exposed and polished with increasingly fine abrasive papers. The linear polarisation resistance (LPR) method was used, with the potentiodynamic polarisation scans performed first in mild and then in harsher conditions. For the former, a 3·5 wt-%NaCl electrolyte contained in a glass three-electrode cell was used. For the latter, the solution was saturated with CO2 by bubbling for 1 h before each polarisation experiment to achieve an acidic carbonic acid brine solution with a pH of 3·9; such solutions are common in industries such as petrochemical extraction and known to be highly corrosive. A saturated calomel electrode (SCE) was used as a reference electrode to measure the potential, while a platinum electrode was used as a counter electrode. The corrosion rate was first measured using the LPR method by polarisation scanning over the range of −0·01 to 0·01 V and back versus open circuit with a scan rate of 0·333 mV s−1. Corrosion rate was calculated using equation (1) and the parameters given in Table 2.

Parameters for corrosion rate calculation
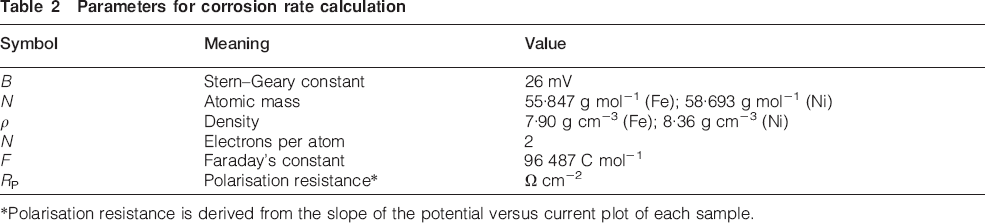
Polarisation resistance is derived from the slope of the potential versus current plot of each sample.
Results and discussion
Geometric characteristics
In all cases, the 50% overlapping of individual tracks produced a continuous layer. Figure 3 shows the surface profiles of the samples, scanned across the tracks, normal to the deposition direction. The typical waviness seen when producing a clad layer by this method is evident in all cases, although this varied in scale. Viewed in cross-section, there was minimal porosity in any layers; however, lack of fusion bonding was identified in one part of sample high mass (HM).
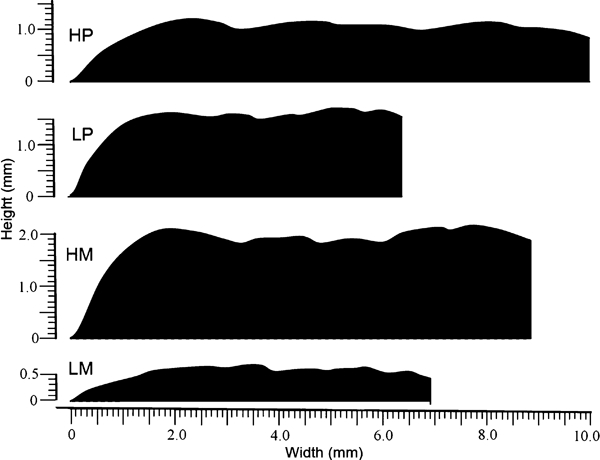
Surface profiles of clad layers
The mean thickness of layers and penetration of the layers into the substrate produced at the different parameter combinations are shown in Table 3 together with an approximation of the overall dilution within the layer, determined from the ratio of the penetration depth to the overall depth of the clad layer above and beyond the original substrate.
Geometric characteristics of clad layers
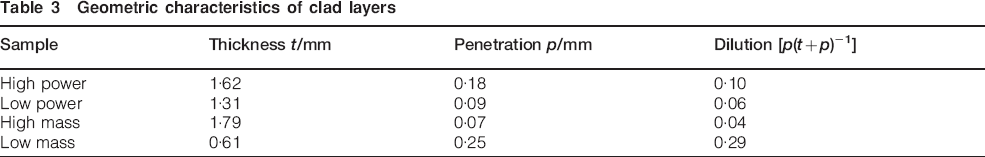
Layer thickness has increased with power due to an increasing melt pool area to catch incoming material and with mass flowrate due to increasing mass flux. Penetration has increased with laser power due to greater capacity to melt deeper (more energy per unit substrate surface area) and decreased with mass flow due to increased power attenuation. These trends are similar to those that would be expected when using a spherical powder.23
Microstructure and phase composition
A characteristic laser cladding microstructure was observed in all the layers. Figure 4 shows the microstructure near the surface of each clad.
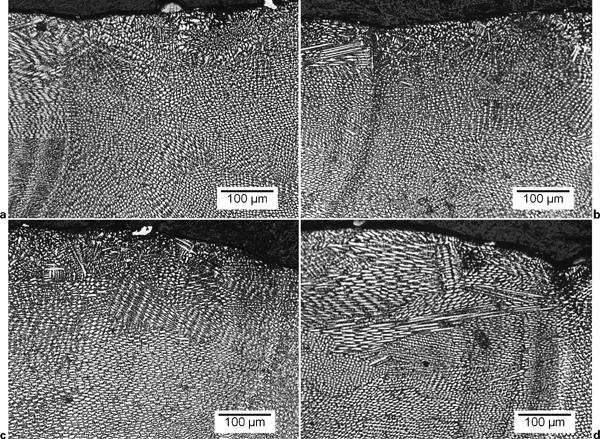
Cross-section micrographs of deposited clad samples:
In all cases, the microstructure observed within a track is principally composed of equiaxed cellular and columnar dendrites, with these occasionally becoming more directional, often approaching a track boundary. The quick solidification and lack of any substantial reheating cycle high up the layer resulted in the formation of a generally fine structure, but it can be seen that the scale varied. By translating this scale to cooling rate using Refs. 24 and 25, it is possible to relate it to melt pool size, as shown in Fig. 5. Melt pool depth has been used as the characteristic melt pool dimension The value is easier to obtain than melt pool length, which has been used previously26, and provided traverse speed is constant, the two should be approximately proportional. As can be seen, there is an approximately, although not ideal, linear log–log relationship, and if melt pool length was assumed to be twice the depth, the relationship would in fact agree closely with those originally found for steel deposition by laser engineered net shaping (LENS) process.26
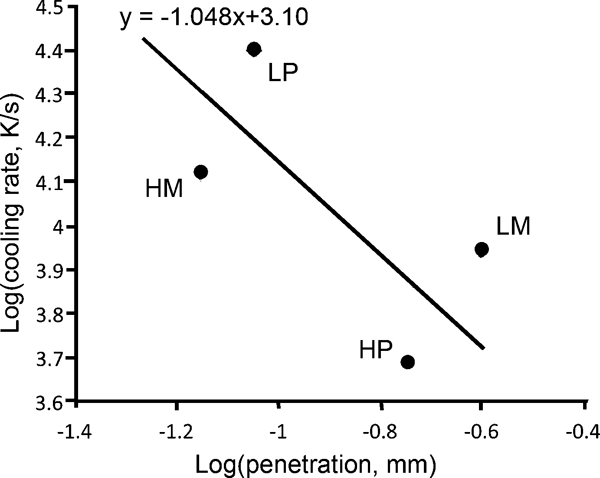
Calculated cooling rates and penetration for clad layers
Lower in a clad, the microstructure tended to become more directional with dendrites that begin at the substrate and grow upward counter to direction of heat flux.27 This epitaxial growth can then be seen at each track boundary within the layer. Reheating, the cyclic changes in temperature that each track undergoes on the deposition of subsequent tracks, may also contribute to the coarsening of the grains, particularly in the lower and middle parts of the layer.
Nickel based superalloys typically consist of a γ phase, consisting of a continuous matrix of face centred cubic (fcc) austenite, a γ′ phase, which is the major precipitate phase and various carbides, mainly M23C6 and MC, where M denotes a constituent metal.28 Mankins et al.29 confirmed M23C6 as the principal carbide phase in Inconel 617 after exposure to temperatures in the range of 649–1093°C. The γ′ and carbide phases have a major strengthening effect, but the rapid cooling rates experienced in this process (Fig. 5) are not generally conducive to their widespread formation.30 An X-ray diffraction scan through the four clad layers (Fig. 6) revealed the expected austenitic (fcc) structure of the alloy, promoted by the high percentage of nickel, which gives austenite phase stability. The main peaks evident in the diagrams for all samples correspond to the (111), (200) and (220) planes.
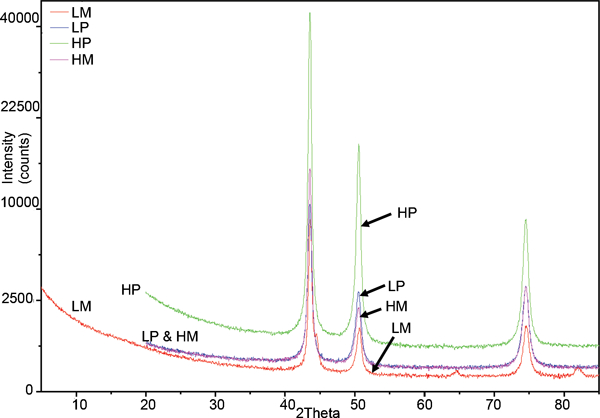
X-ray diffraction analysis of four clad samples
The low mass (LM) sample alone contained an additional phase. Large quantities of Cr, Mo, W and Re promote the precipitation of intermetallic phases that are rich in these elements, forming topologically close packed phases,28 so the high content of Cr in Inconel 617 means that this is a possibility. However, they have not been identified in previous research involving rapid cooling of Inconel 61731 and have a complex structure. It is more likely that the additional structure is due to dilution of the clad by the mild steel, which had a ferritic (body centred cubic) structure. The small track of the LM samples may also have permitted more reheating of previous tracks, allowing more of the γ′ and carbide phases to be precipitated.
Corrosion performance
The general corrosion rates for the samples and parent materials, as determined by LPR, are shown in Fig. 7 for both the neutral and the acidified brine solutions. Corrosion rates vary very significantly, so a log scale has been used. As expected, the corrosion rate of the mild steel is considerably faster than that of either the 617 in original or clad form, and the corrosion rate is greater in the harsher environment. Interestingly, in a harsh environment, a protective clad Inconel layer does not reduce the corrosion by as great a factor as in a mild environment. Tested in mild conditions of 3·5%NaCl, the corrosion rate of a mild steel component dropped by a factor of at least 374 if laser clad with Inconel (34·7 mm/year to sample LM, 0·093 mm/year). However, in a harsher environment, the best it could be reduced by was a factor of 75 [111·38 mm/year to the value of sample low power (LP), 1·49 mm/year].
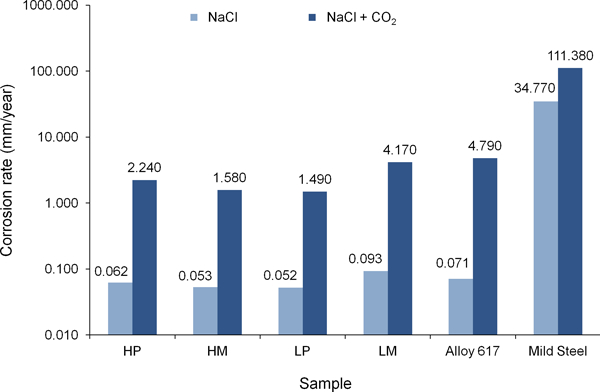
Corrosion rates of samples measured by LPR method
Comparing samples, the LP and HM clads reduced the corrosion rate to the lowest levels in both mild and harsh environments. These are the samples with lowest overall dilution (Table 3) and lie to the upper left of Fig. 5, so they were produced at conditions that gave low penetration, a high cooling rate and fine microstructure.
To assess the resistance of each sample to localised breakdown of the passive film, and consequent localised corrosion by pitting, Fig. 8 shows the cyclic polarisation curves of all the clad samples. As a benchmark, results for the parent Inconel 617 and the unprotected substrate are shown in Fig. 9. In both cases, the arrows indicate the scan direction as forward and reverse scans.
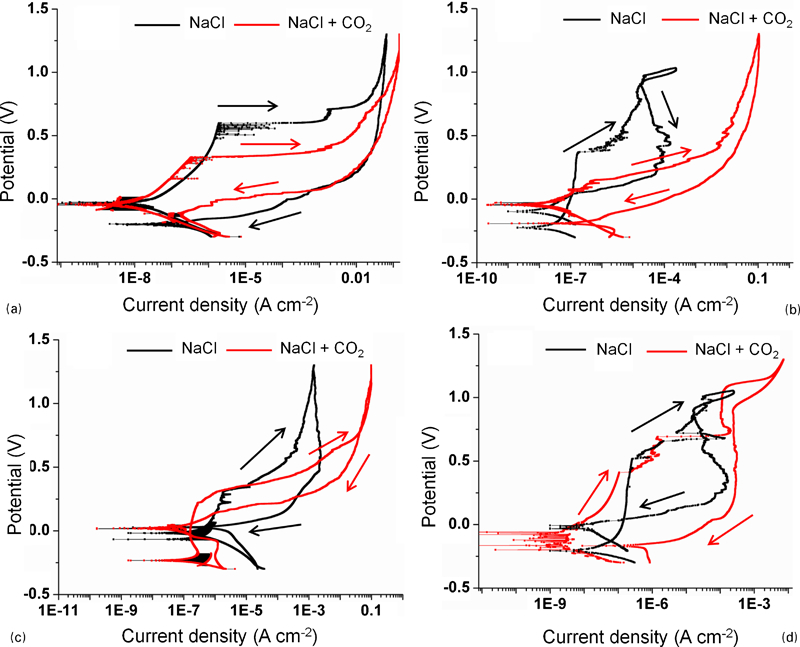
Polarisation curves obtained at 0·333 mV s−1 in mild and harsher conditions for test samples:
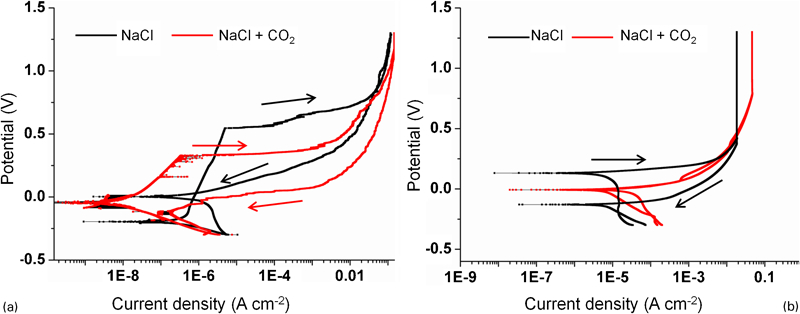
Polarisation curves obtained at 0·333 mV s−1 in mild and harsher conditions for a parent Inconel 617 and b unprotected mild steel substrate
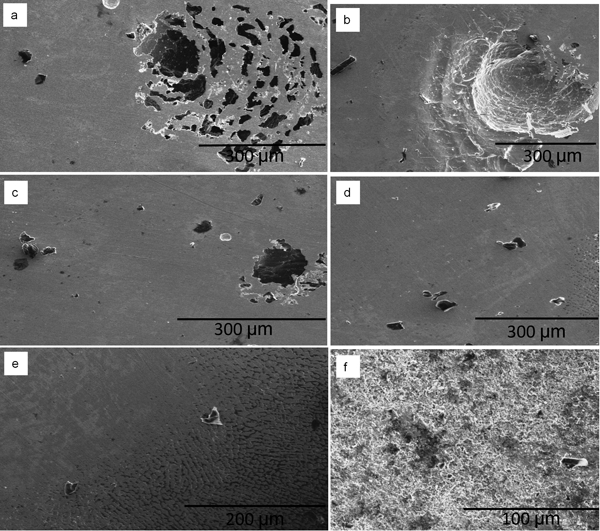
The pitting potentials were found as the point at which the gradient of the current density against potential rises sharply after the passive region on the first part of the anodic curve scanning in the positive potential direction. No such measurement could be made for the mild steel, which does not show a passive region, and corroded at a very high uniform rate. The pitting potentials for each sample (measured versus the SCE reference electrode) in each solution are given in Table 4.
Pitting potential of samples versus SCE reference electrode
The clad Inconel seems to behave slightly better than the parent material in one case [high power (HP), tested in mild conditions: NaCl eletrolyte]. However, there is some inherent variability in cutting and polishing samples before polarisation test, and small variations should not be considered as statistically significant. There are significant differences between some samples, with pitting potentials varying from 0·15 (LP) to 0·41 (LM) in NaCl+CO2 electrolyte. The values do not follow the same pattern as the corrosion rates (Fig. 7), indicating that different factors govern these two indicators of corrosion resistance.
The samples with greater polarisation potential (indicating that more oxidising conditions are needed to initiate stable pitting) were HP and LM. These are the samples with highest overall dilution (Table 3) and lie to the bottom right of Fig. 5, so they were produced at conditions that gave high penetration, a low cooling rate and microstructure that was less fine than the other tested samples. Intuitively, these do not appear to be the best combination of factors, but it must be remembered that pitting corrosion is highly sensitive to the influences of inhomogeneity in a sample, and in particular the presence of second phase particles or inclusions.32 Comparing the surface profiles of the samples gives an indication as to why these samples may have performed better: the higher power and lower mass led to a smoother, more continuous surface with fewer surface discontinuities and less acute corners at track boundaries (Fig. 3). Higher power may also have led to more complete vaporisation of any surface contaminants, although this was not definitively established.
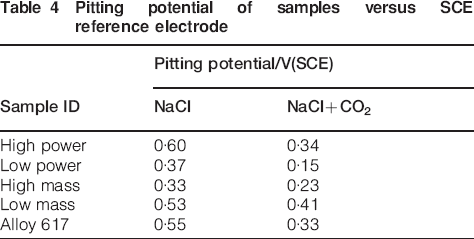
Images were taken from all the samples after the polarisation scan in NaCl+CO2 to further establish the type of damage caused by the high anodic polarisation. These images are shown in Fig. 10. For all laser clad samples, the original surface is largely free from attack, with only pitting present. In the case of the parent 617 material (Fig. 10e), the pitting is accompanied by evidence of some intergranular corrosion. In stark contrast to these samples, the mild steel shows uniform corrosion with complete removal of the original surface during the time of the polarisation experiment.
Images of samples after anodic polarisation to +1·3 V(SCE) in NaCl brine acidified with CO2:
Despite all the corrosion that was observed, it must be noted that for all the samples tested, even under harsher conditions with CO2 saturated solution, the pitting potentials were well above the corrosion potential, and so no spontaneous pitting would be expected. It is only because the samples were polarised to highly anodic potentials as part of the test procedure that the pitting behaviour was observed. Overall, the results indicate that Inconel would indeed provide a very effective surface barrier to corrosion.
Conclusion
Machining swarf of Inconel 617 with non-spherical morphology was laser clad onto mild steel substrate to study its viability to produce corrosion resistant layers. Based on the work reported above, the following conclusions can be made.
Inconel 617 machining swarf can be reduced into a form suitable for laser cladding using standard cladding procedure and equipment by a simple reduction process. As far as tested, the process relationships established with gas atomised powder still hold true.
Coherent protective clad layers with minimal porosity and good metallurgical bonding at the layer/substrate interface were produced. All layers comprised a matrix of fcc austenite; the clad produced with LM feedrate alone contained a different structure, possibly a topologically close packed phase or carbide.
The microstructure of the layers was observed to be columnar dendritic with pockets of equiaxed, cellular and sectioned dendrites in the upper parts of the layers.
The coating displayed similar pitting potentials and corrosion behaviour to the parent 617 alloy.
The results confirm the viability of using laser clad waste Inconel 617 machining swarf as a protective coating material for harsher industrial environments. This offers a lower cost solution than the gas atomised powders conventionally used with this process.
Footnotes
Acknowledgements
The authors would like to thank the British Council for providing financial support under the PMI2 connect programme and Dr W. Ul Haq Syed of Department of Mechanical Engineering, College of Electrical and Mechanical Engineering, NUST, Pakistan, for collaboration within that programme. We also thank M. Faulkner and G. Harrison of School of Materials, University of Manchester, for SEM/XRD equipment assistance.