
Abstract
The influences of chemicals used in the Cr electrodeposition bath on the brightness and efficiency of Cr coating were studied using fractional factorial design of experimental method. Cr coating defects that emerged during the coating were investigated using a scanning electron microscope (SEM). Analysis of variance test was performed to check the accuracy of each effect in the statistical studies. The statistical results show that boric acid enhances the efficiency and thickness of Cr coating the most. The stability of Cr coating is dependent on two parameters: pH and Cr+3 ion concentration in the Cr III bath. SEM images and energy dispersive spectroscopy measurements showed that the blackness and dullness defects on Cr coating are due to the emergence of chromium (III) sulphide (Cr2S3) and fast hydrogen evolution on Cr coating.
Introduction
Chrome (Cr) coatings are most widely used industrially for increasing the corrosion and wear resistance of materials. 1 The most commonly used Cr coatings are performed in hexavalent chromium (Cr VI) bath containing H2SO4 or F as catalyst. This process is prohibited in the United States, Japan, China, Europe and the other many states due to the toxic effect of hexavalent Cr. 2 In recent years, trivalent Cr (Cr III) baths are used as an alternative to hexavalent chromium baths because the toxic effect of Cr III ion is much less than the Cr VI one. 3 However, Cr III ions make a stable complex with aqua, which hinders the reduction of Cr III ions.4,5 This stable complex can be broken using organic complexing agents.
In the scientific studies conducted to date, many organic complexing agents have been tried, some of which are formic acid, urea, acetate, glycine and malonic acid. 6 In our previous study, a new Cr III bath was created using saccharin together with malonic acid and compared to the Cr VI bath. The corrosion resistances of Cr coatings obtained from the Cr III bath were very similar to Cr VI bath, but the thickness was over twice as great as the Cr VI bath. 7 This indicates that the efficiency of Cr III bath is much higher than the Cr VI bath. The task of organic complexing agents in the Cr III bath is to facilitate the reduction of Cr III ions to Cr0. Organics make a complex with Cr III ions and extend the bond distance between Cr and H2O, which impairs the stability of the Cr–H2O complex. 8 Unstable Cr complex approaches to the cathode surface easier. The second factor that obstructs the coating is the electrochemical reaction of hydrogen [H2 (g)] evolution. H2 evolution takes place at the cathode surface9–11 and prevents the Cr coating, thus decreasing the efficiency significantly.
In our previous study, it was shown from electrochemical measurements that saccharine shifts the reduction potential in the negative area effectively and hinders the H2 (g) evolution. Although the scientific studies, to date, move the performance (efficiency, appearance, etc.) of Cr III bath to a better point compared to Cr VI, it is not still widespread at the desired level industrially. The most important reason of this is that the performance of Cr III bath is more sensitive to the working conditions (temperature, pH, etc.) and the concentration change of the chemicals used in the Cr III bath than Cr VI. In addition, the main and interaction effects of chemicals are not known. That is why the fabrication of stable product is difficult and the bath problems take place too much. Because of this, in this study, the main and interaction effects of chemicals and pH used in Cr III bath on brightness and thickness were studied statistically. The conditions increasing the bath stability were determined. The reason of Cr coating defects that emerged during the coating in the Cr III bath was investigated using scanning electron microscope (SEM)–energy dispersive spectroscope (EDS) instrument, and the morphology, roughness and composition of the coating were inquired.
Experimental
Instruments and methods
Cr coatings were carried out using OEM PRT 446 1617 model rectifier. The morphology and composition of Cr coating were analysed with JEOL Model JSM 6301 FXV SEM instrument equipped with IXRF EDS (20 kV). The thickness and brightness of Cr coatings were determined using Fischerscope XDL-B X-ray fluorescence and Novo-Gloss Trio Glossmeter 12 instruments respectively. The surface roughness of Cr coating was measured using Mahr Perhen Perthometer model profilometer.
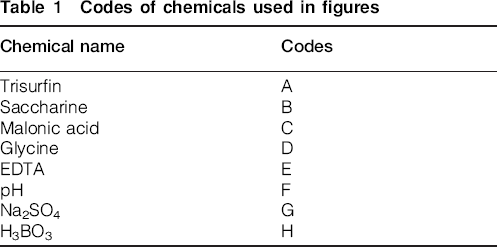
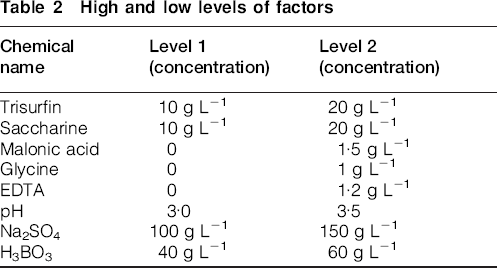
The chemicals used in the Cr III bath were presented in Table 1. The codes in Table 1 were used in tables and figures for a better and clearer identification. The two different concentrations of A, B, G and H chemicals were tested in the design of experimental studies. The effects of the presence/absence of complexing agents (C, D, E) in the bath on the brightness and the thickness were investigated. In addition, how the pH of bath affected the bath stability was inquired. The concentration range of chemicals and the pH range used in the Cr III bath were summarised in Table 2.
Codes of chemicals used in figures
High and low levels of factors
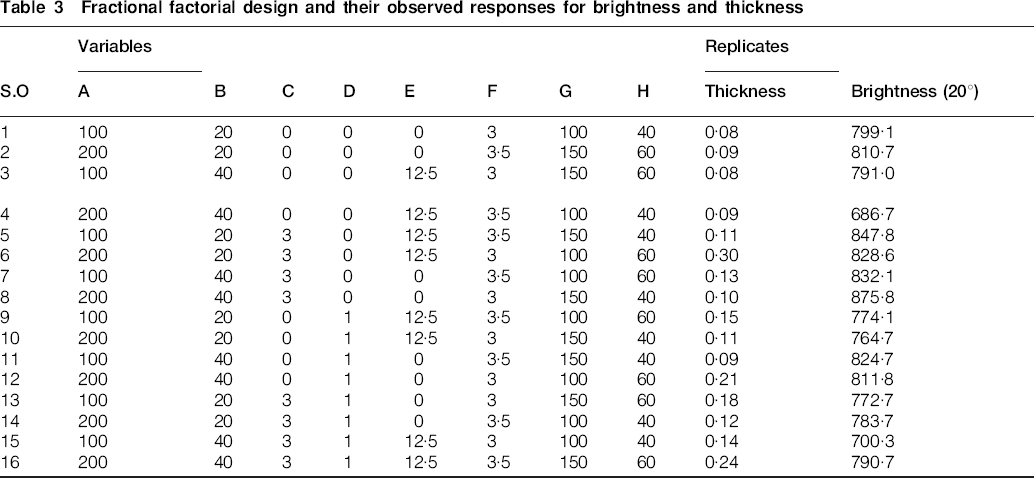
In the experimental studies, the fractional factorial experimental design method was used to decrease the cost and the number of experiments. Thus, the number of experiments was reduced from 256 to 16. Each experiment was repeated thrice. The results and design of the experiments were presented in Table 3. Minitab 14 software was used to statistically evaluate the results of the studies. Analysis of variance (ANOVA) test was preferred to check the accuracy of each effect in the statistical studies.
Fractional factorial design and their observed responses for brightness and thickness
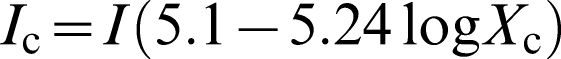
Cr coatings were performed in a Hull cell at a current density of 2 A dm−2 for 10 min. Brass cathode and the Ti/IrO2 coated anode were used. Brass cathode has a surface area of 100 cm2. The measurements of brightness and thickness were done at the point shown in Fig. 1. The current density of this region was calculated using the equation presented in equation (1), and the value is 10·2 A.

Measurement point for brightness and thickness
Chemicals
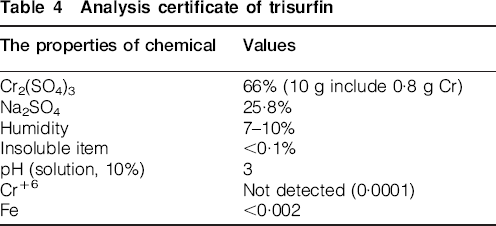
Trisurfin [chromium sulphate, Cr2 (SO4)3] was supplied from Türkiye Şişe ve Cam Fabrikaları Company. The analysis certificate of product was presented in Table 4. Sodium sulphate (Na2SO4), ethylenediaminetetraacetic acid (EDTA) and boric acid (H3BO3) were supplied as analytical grade from Merck Co. Saccharin and malonic acid of technical grade obtained from Wuhan Rison Tradin Co. Ltd were used without further purification.
Analysis certificate of trisurfin
EDS analysis of Cr coating on mat surface (Cu and Zn comes from substrate)
Results and discussion
Investigation of parameters affecting brightness and thickness
Figures 2–6 indicate the main and interaction effects of chemicals added to the Cr III bath on the brightness and the thickness. The circles positioned near the line show the ineffective constituents in the Cr III bath. The others (square points) show the statistically significant constituents used in the Cr III bath. The square shaped points at the right side of the line express an increase in brightness and thickness, while the ones at the left side of the line show a decrease in brightness and thickness. The points in the rightmost and leftmost exhibit the maximum impact on brightness and thickness. ANOVA method was used to determine the effect degrees of the constituents. It is supposed that if p value is <0·05, the effect of constituent at 95% confidence interval (or 5% error) is important. Otherwise, it is thought that the constituent is not statistically important.
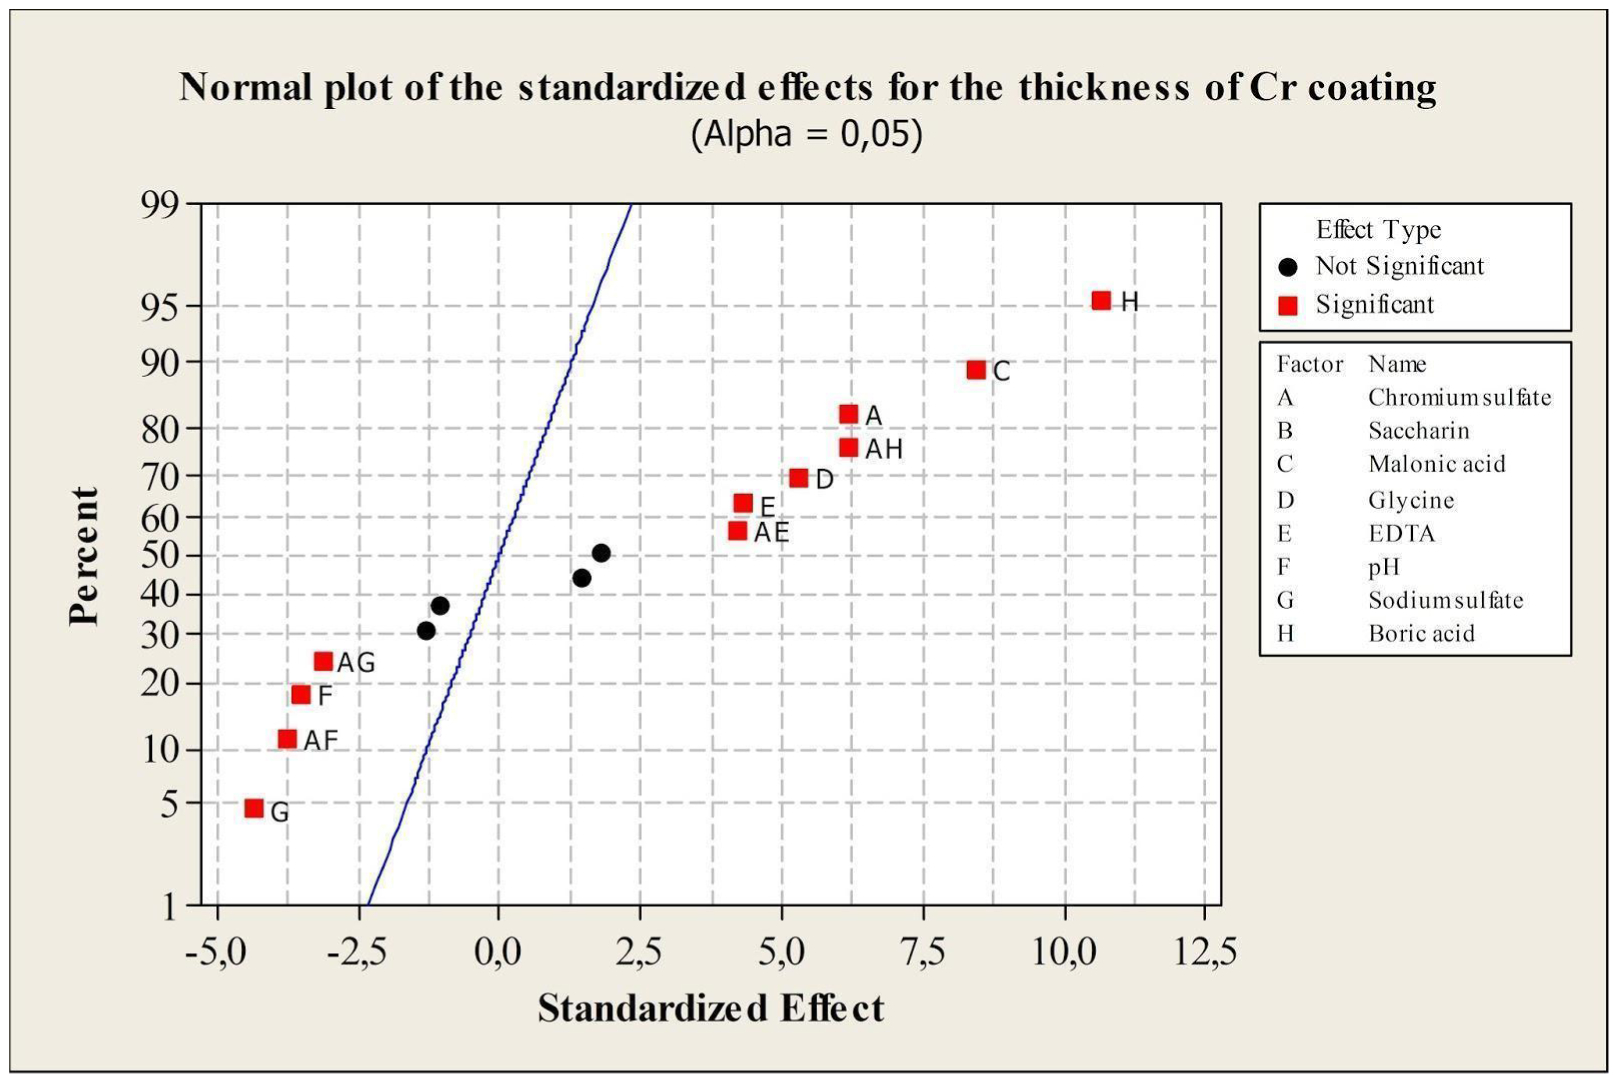
Normal probability plot of standardised effects on thickness
Figure 2 indicates that the most increase in the thickness of Cr coating was observed when the concentration of boric acid was increased. The other effective chemicals on the thickness increase were malonic acid and chromium sulphate respectively. Boric acid interacted with Cr2(SO4)3 (A). Therefore, the interaction between boric acid and chromium sulphate (AH) should be taken into consideration.
Figure 3 shows the interaction between boric and chromium sulphate. While the concentration of boric acid was increased to 60 g L−1 in the presence of 20 g L−1 chromium sulphate, the thickness of Cr coating increased over 0·20 μm. However, in the presence of 10 g L−1 chromium sulphate, the thickness increased to 0·14 μm the most (Fig. 3). For higher thickness, the concentrations of chromium sulphate and boric acid in the Cr III bath must be kept at ∼20 and 60 g L−1 respectively.
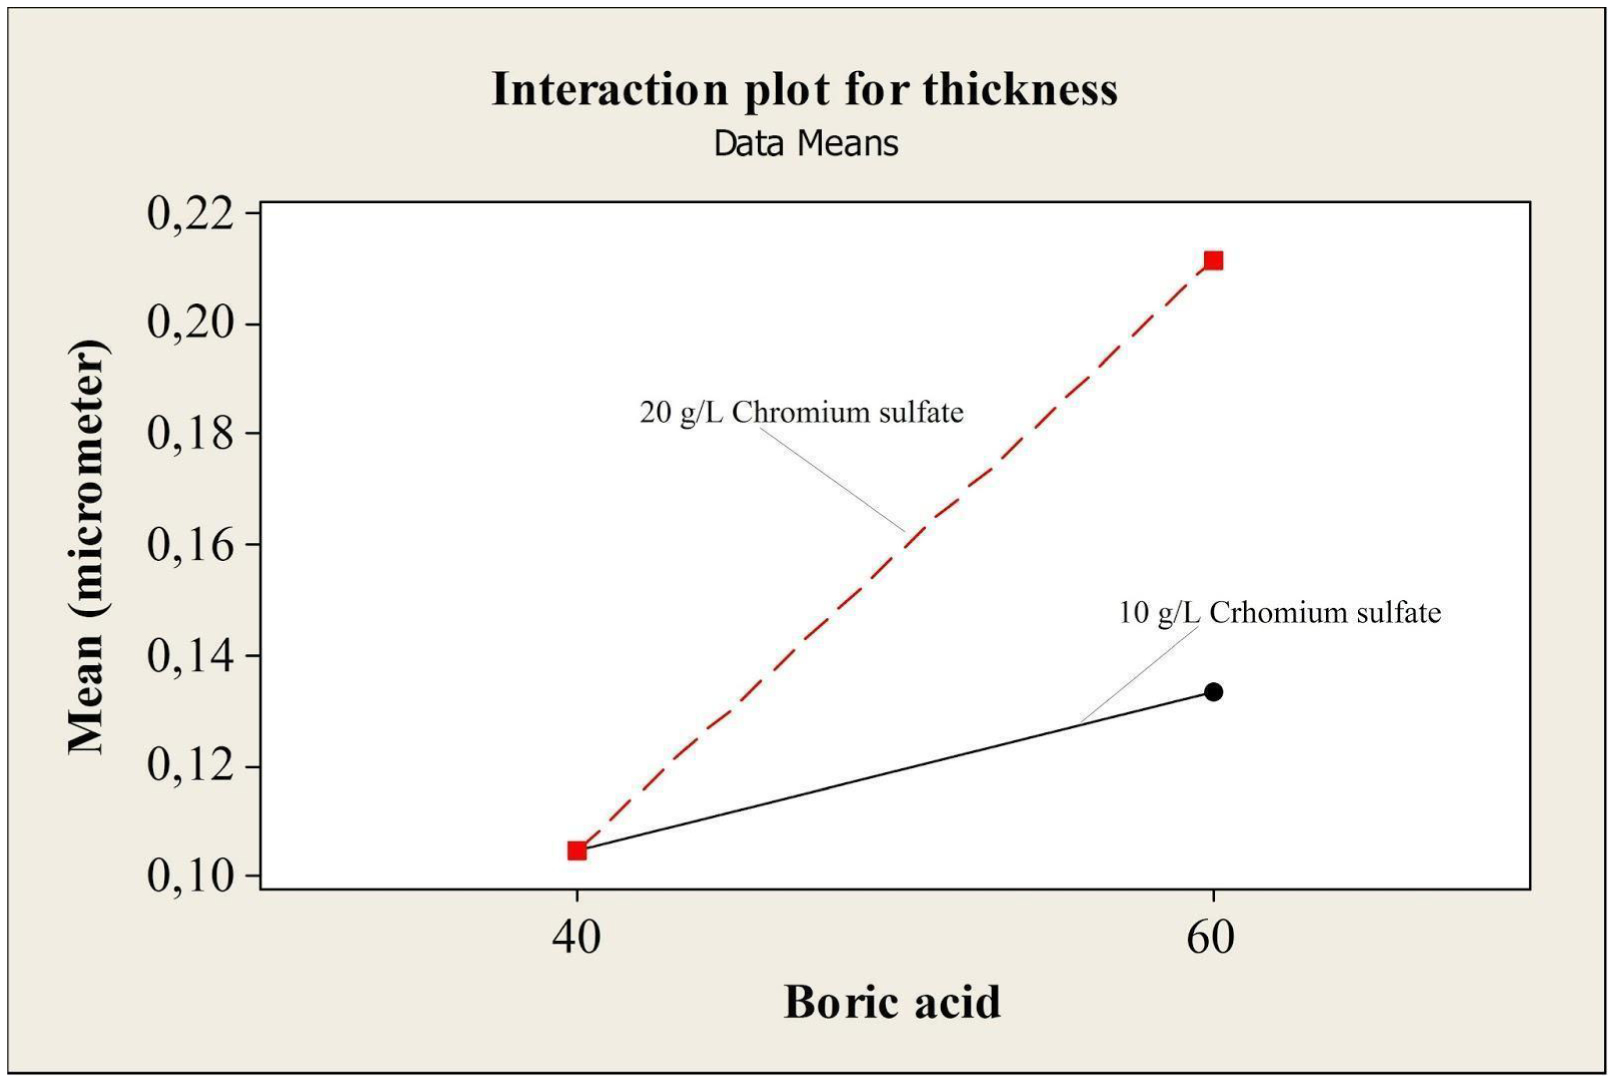
Plot of interaction effects of variables, chromium sulphate and boric acid (AH) on thickness
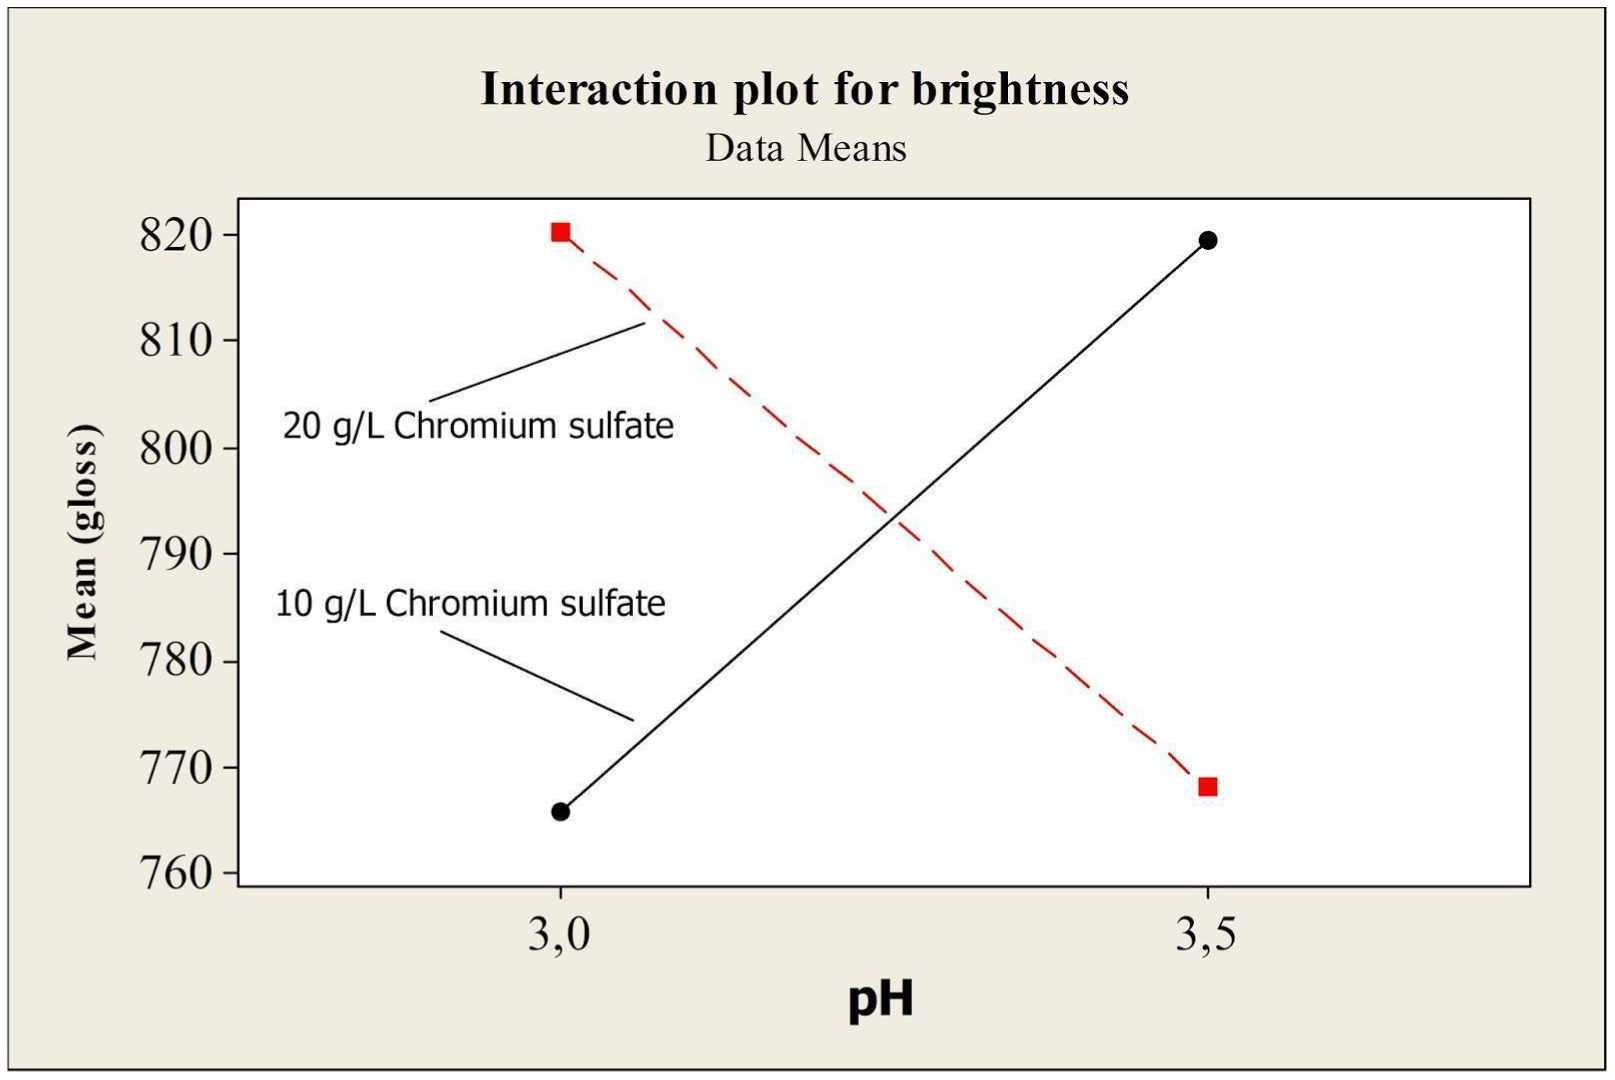
Figure 4 shows the effects of the bath composition changes on the brightness of the coating. The presence of E in the Cr III bath decreased the brightness of the coating. The other factor decreasing the brightness is the interaction between Cr and pH (AF). Figure 5 shows the interaction between Cr and pH. As seen in Fig 5, to keep the brightness high, pH should be kept at 3·0 and the concentration of chromium sulphate should be 20 g L−1.
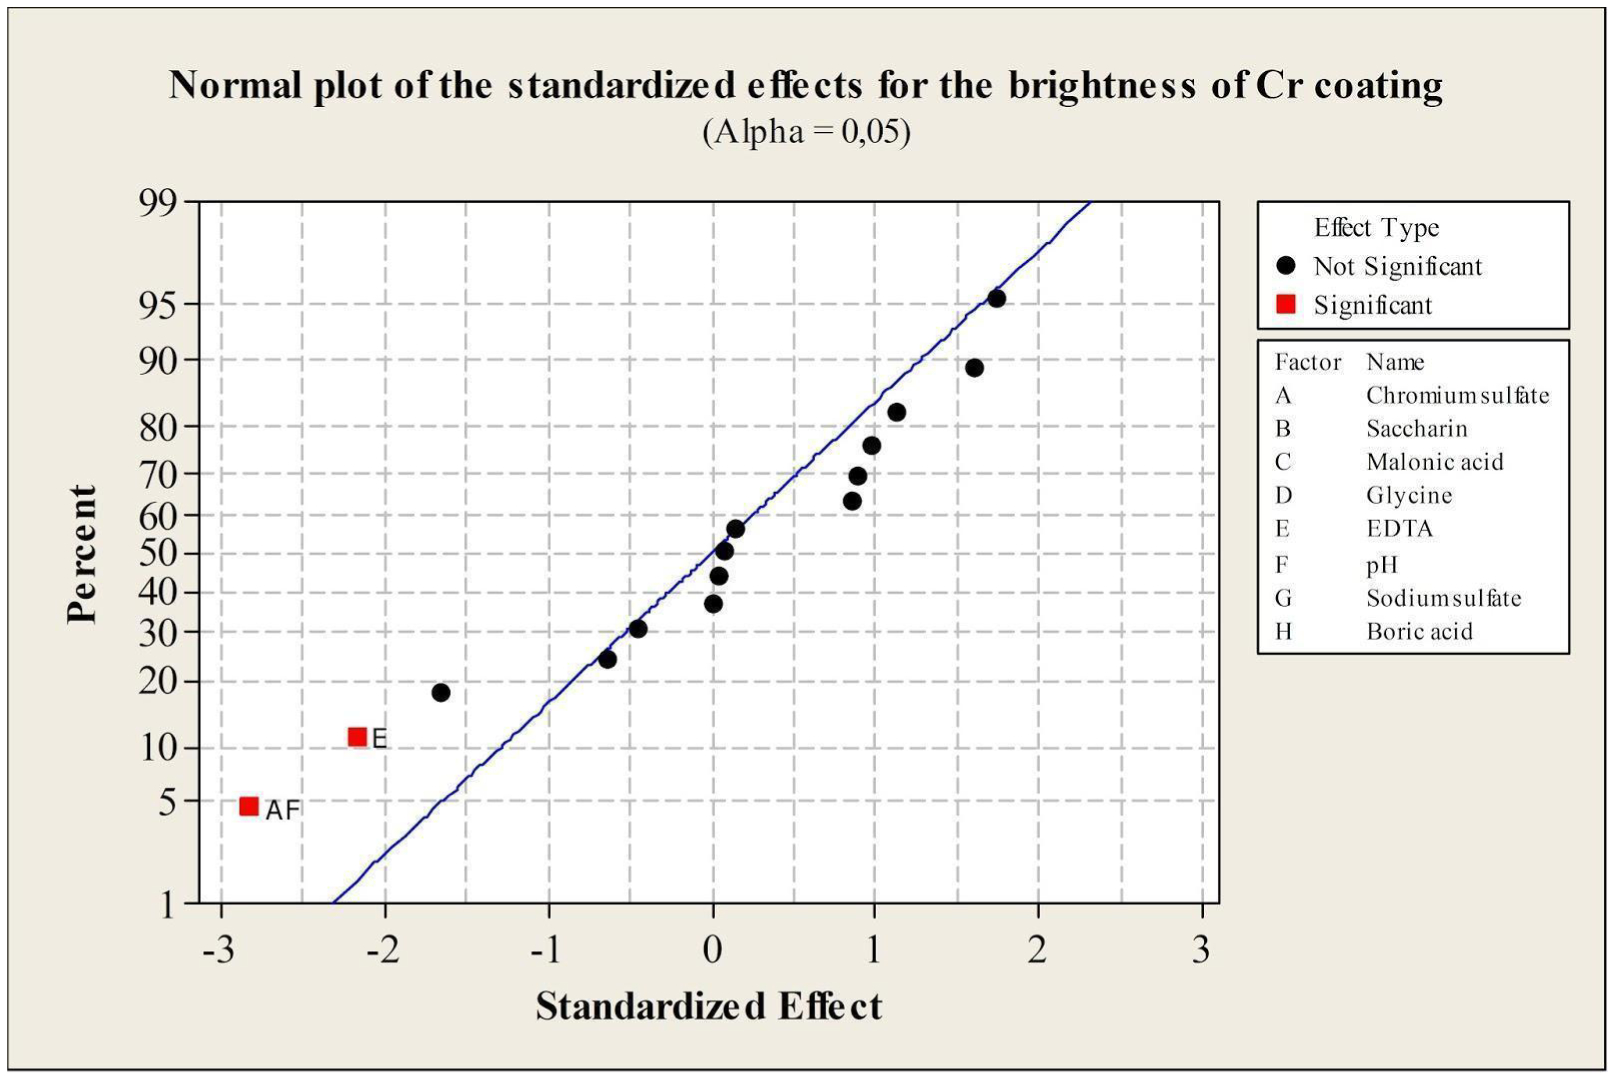
Normal probability plot of standardised effects on brightness
Plot of interaction effect between chromium sulphate and pH (AF) on the brightness
Another important issue of consideration is that the constituents (A, G and F) at the left side of the line (Fig. 2) decrease the thickness of Cr coating. Because of this result, they should not be preferred to be in the Cr III bath. However, chromium and sodium sulphate are needed for Cr supply and the conductivity of the Cr III solution. Optimum conditions of these constituents must be determined not to decrease the thickness of Cr coating. Therefore, the examination of interactions between chromium sulphate and pH (AF), and chromium sulphate and sodium sulphate (AG) are important. The interaction graphs of constituents are presented in Fig. 6a and b. As seen in Fig. 6a, the highest thickness was obtained when the pH and chromium sulphate were at 3·0 and 20 g L−1 respectively. It is important that pH value must not exceed 3·0. Otherwise, the thickness decreased significantly. As shown in Fig. 6b, it was observed that Cr thickness decreased significantly with increasing Cr concentration when sodium sulphate surpassed 100 g L−1 in the Cr III bath.
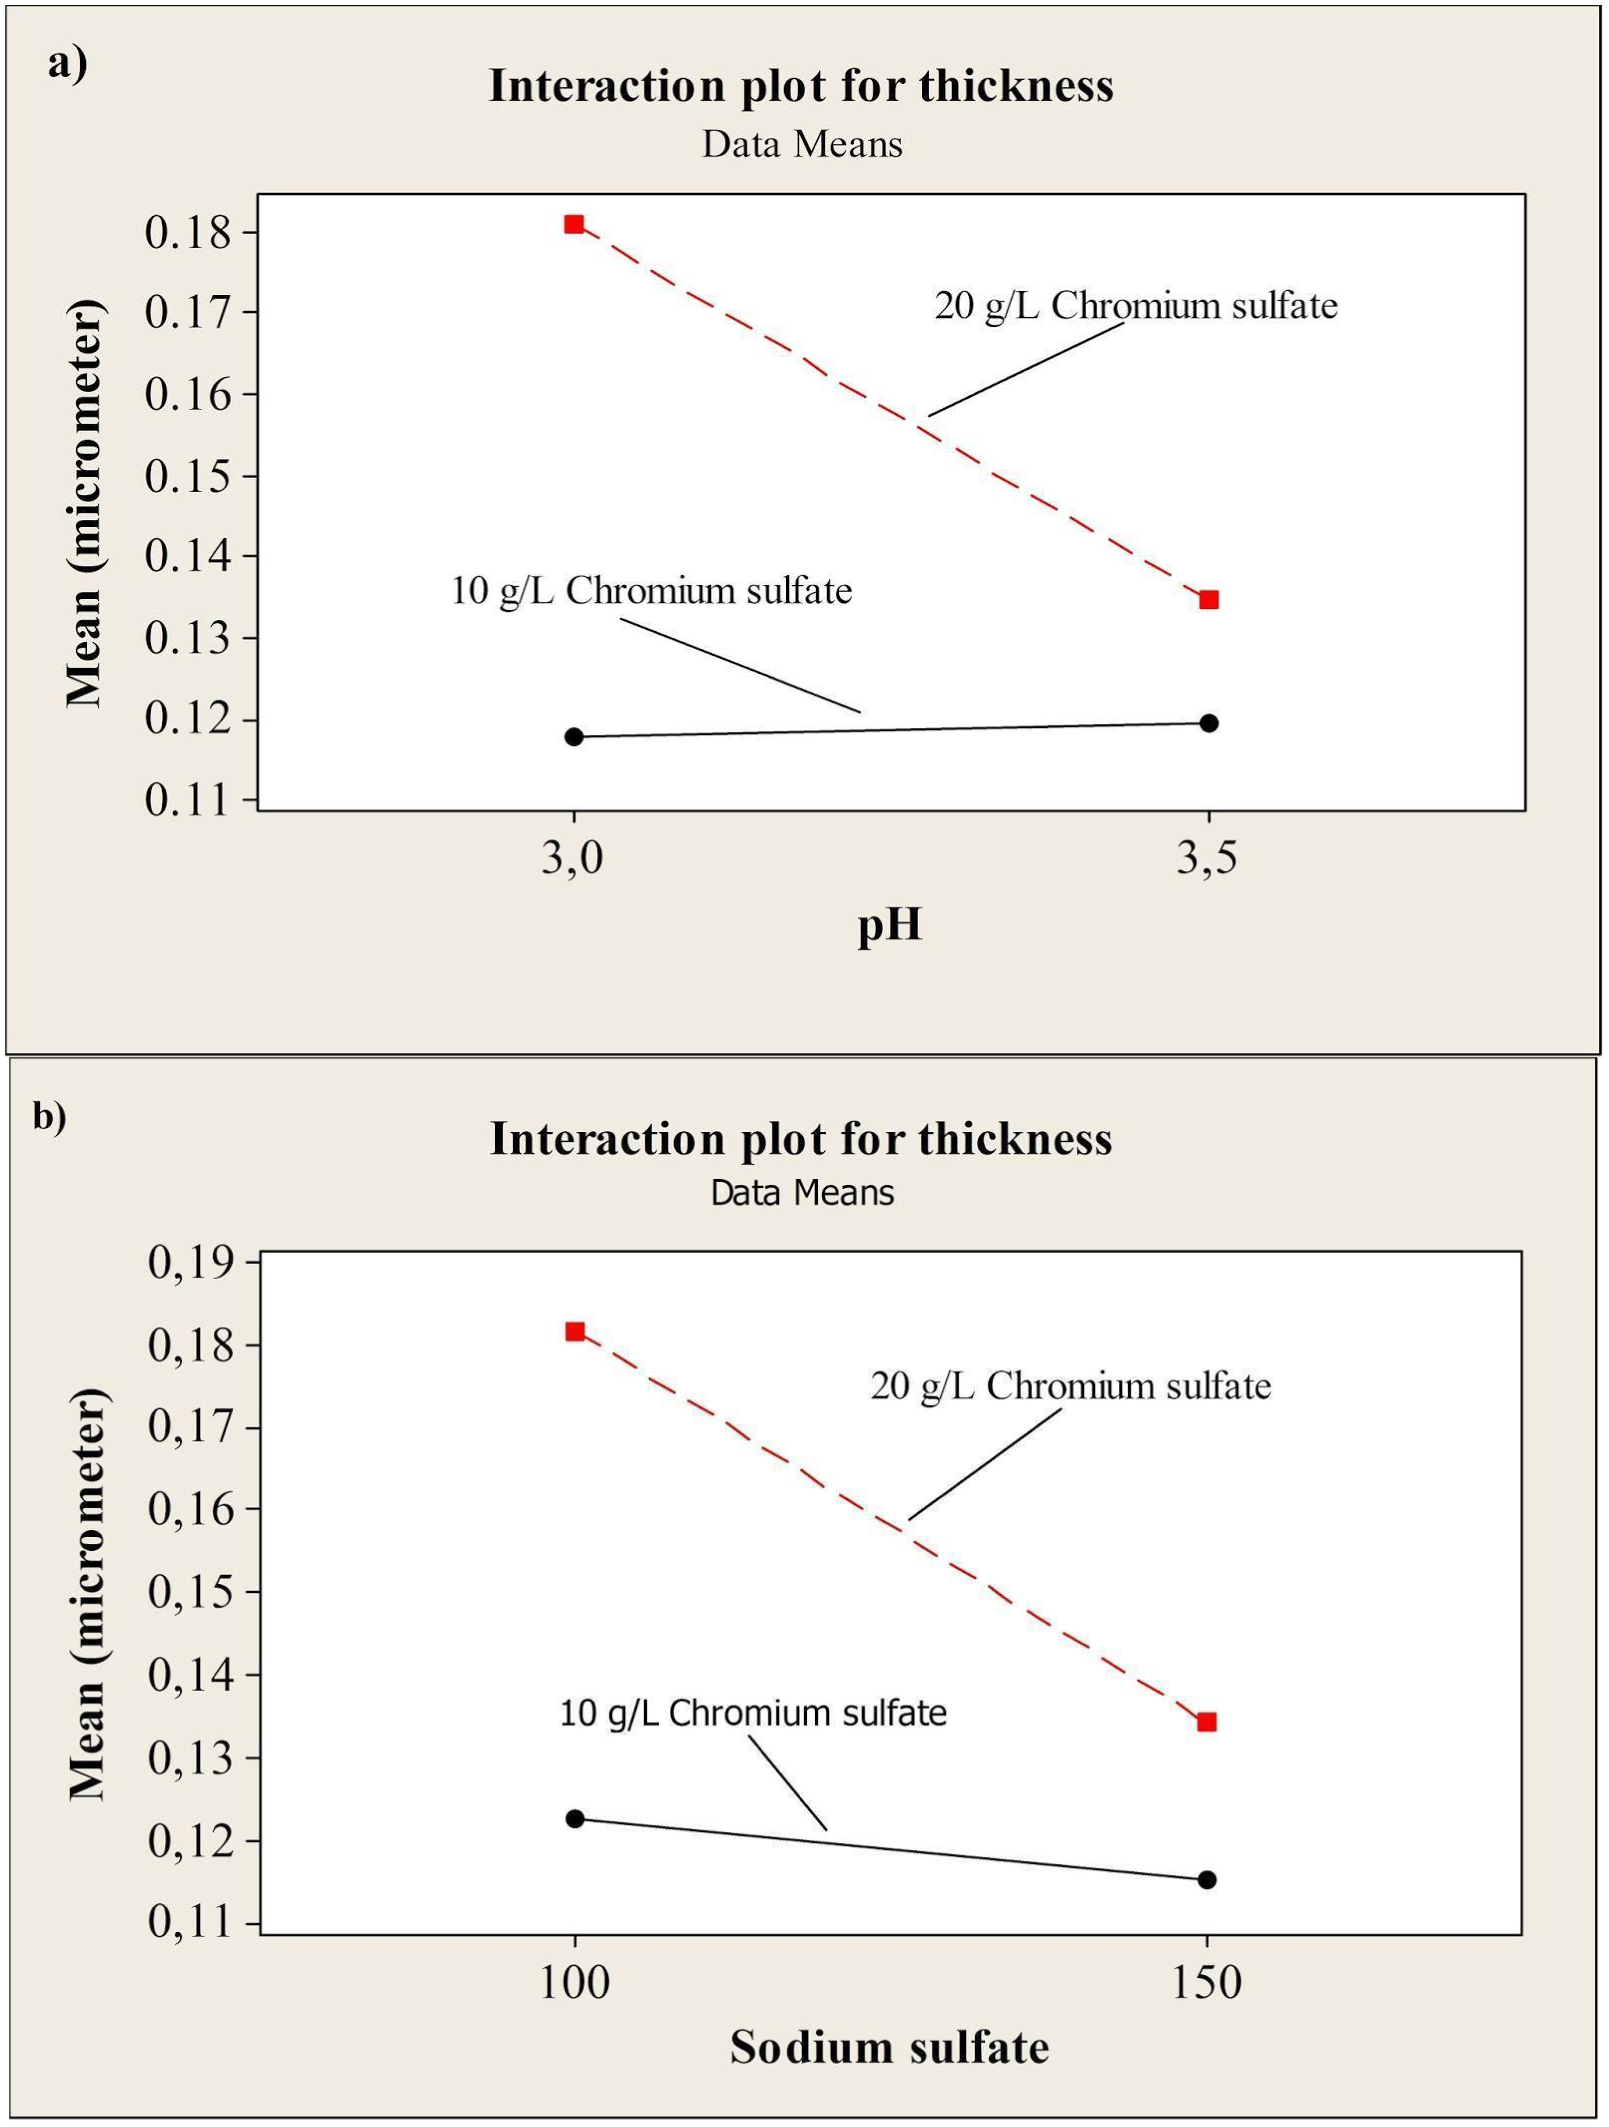
Plots of interaction effects of variables a chromium sulphate and pH (AF) and b chromium sulphate and sodium sulphate (AG) on thickness
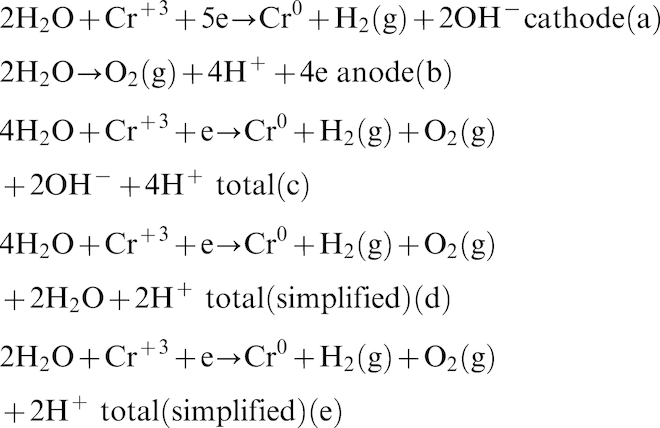
When sodium sulphate concentration increased, hydrogen gas outlet at the cathode increased significantly. This is because sodium sulphate makes a reaction with water according to equations (2) and (3), which facilitates the electrochemical reaction of water. An increase in the speed of electrochemical reaction of water increases the H2 gas outlet at the cathode surface (equation (3)). The concentration of OH− ion increases at the same time because of the reactions taking place in equations (2) and (4).


Characterisation of coating defects
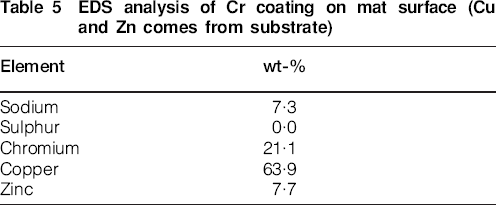
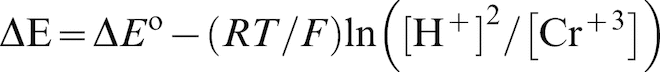
During the experimental studies, coating defects (blackness, dullness) were formed on the surface of Cr coating. To investigate the reason of these defects, SEM images were obtained and coating constituents of these regions were analysed with EDS instrument. Figure 7 and Table 5 show the SEM images of matt surfaces on Cr coating and chemical composition respectively. As seen in Fig. 7, blisters (Fig. 7a) and perpendicular deep stripes (Fig. 7b) in the matte surface were observed. The reason of this is considered to be the hydrogen evolution. H2 gas trapped in the Cr coating and the fast hydrogen evolution in the high current density region led to blistering of the coating (Fig. 7a) and the formation of upward deep stripes (Fig. 7b). The emergence of this kind of defects in the baths having a low efficiency and high rate hydrogen evolution is remarkable. These kinds of structures cause the Cr coating to appear dull. The second reason of dullness may be Na because ∼7·3wt-% Na was obtained in these regions. The high amount of Na is considered to lead to deteriorating crystal structure because Na enters the crystal structure, which may cause the surface mat to appear.
SEM images of mat surfaces formed on Cr coating at a low current density region and b high current density region
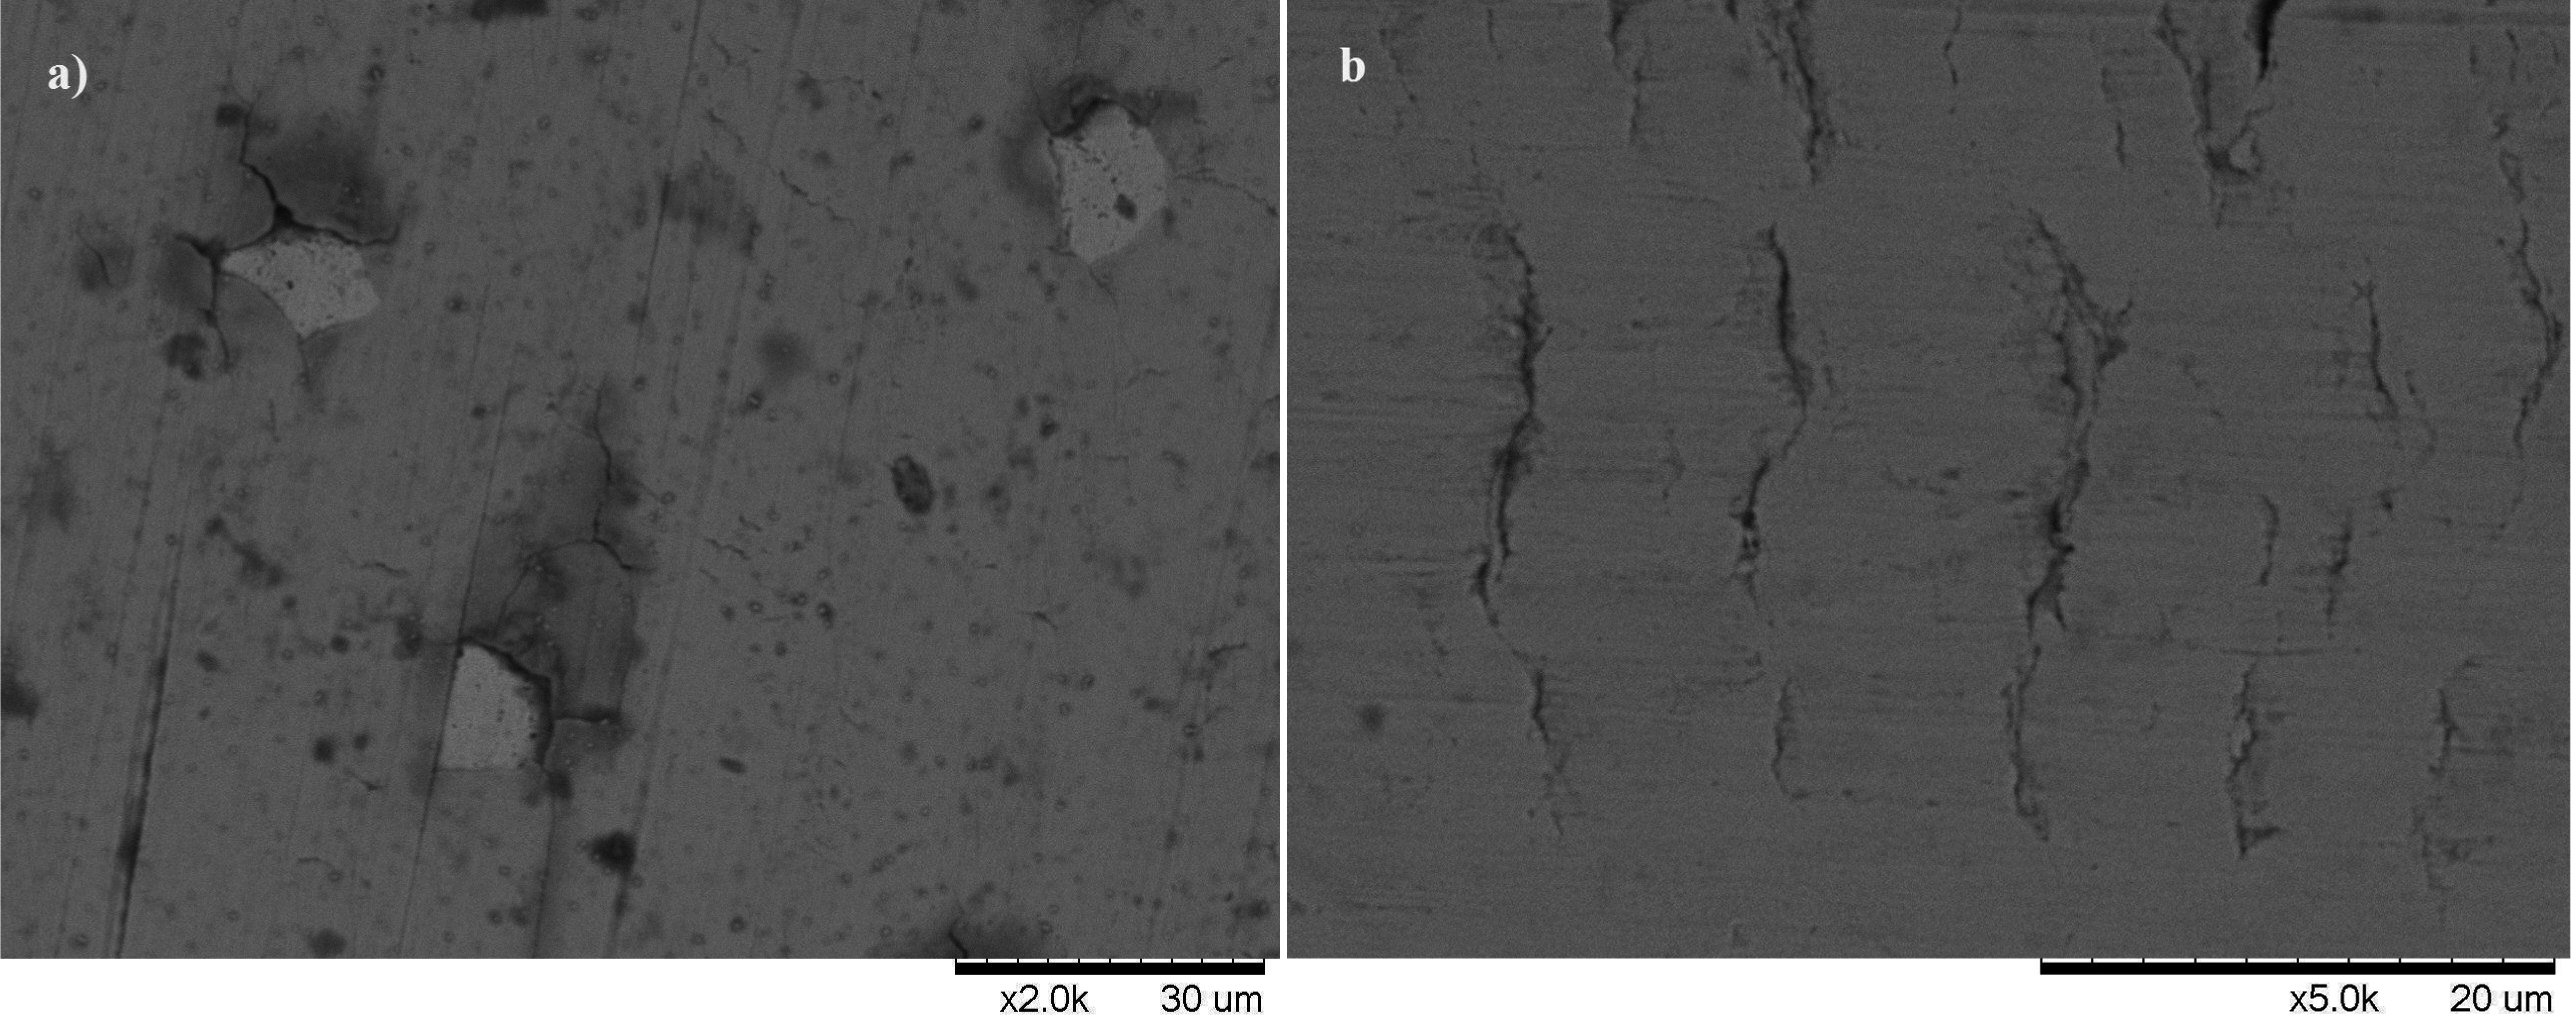
The other most common defect is the blackness on the coating. Figure 8 shows SEM images obtained from the black regions on the Cr coating. After a careful examination of SEM images, it is considered that tiny particles on the surface are Cr(OH)3 and to be formed due to the high pH on the cathode. The black regions are considered to be the transformation of Cr(OH)3 into Cr2S3. 13 In the EDS measurements taken, the sulphur quantity in the Cr coating is ∼4 wt-%. The high sulphur in Cr coating confirms the formation of Cr2S3. This defect took place at a high pH and high concentration of chromium sulphate. When the pH and boric acid are kept at 3·0 and 60 g L−1 respectively, this defect was lost. Boric acid hinders the pH rise, thus preventing the formation of Cr(OH)3 and Cr2S3 on the cathode. It is considered that the sulphur is coming from saccharine added to the Cr III bath.
SEM images of black surfaces formed on Cr coating (a and b show different regions)
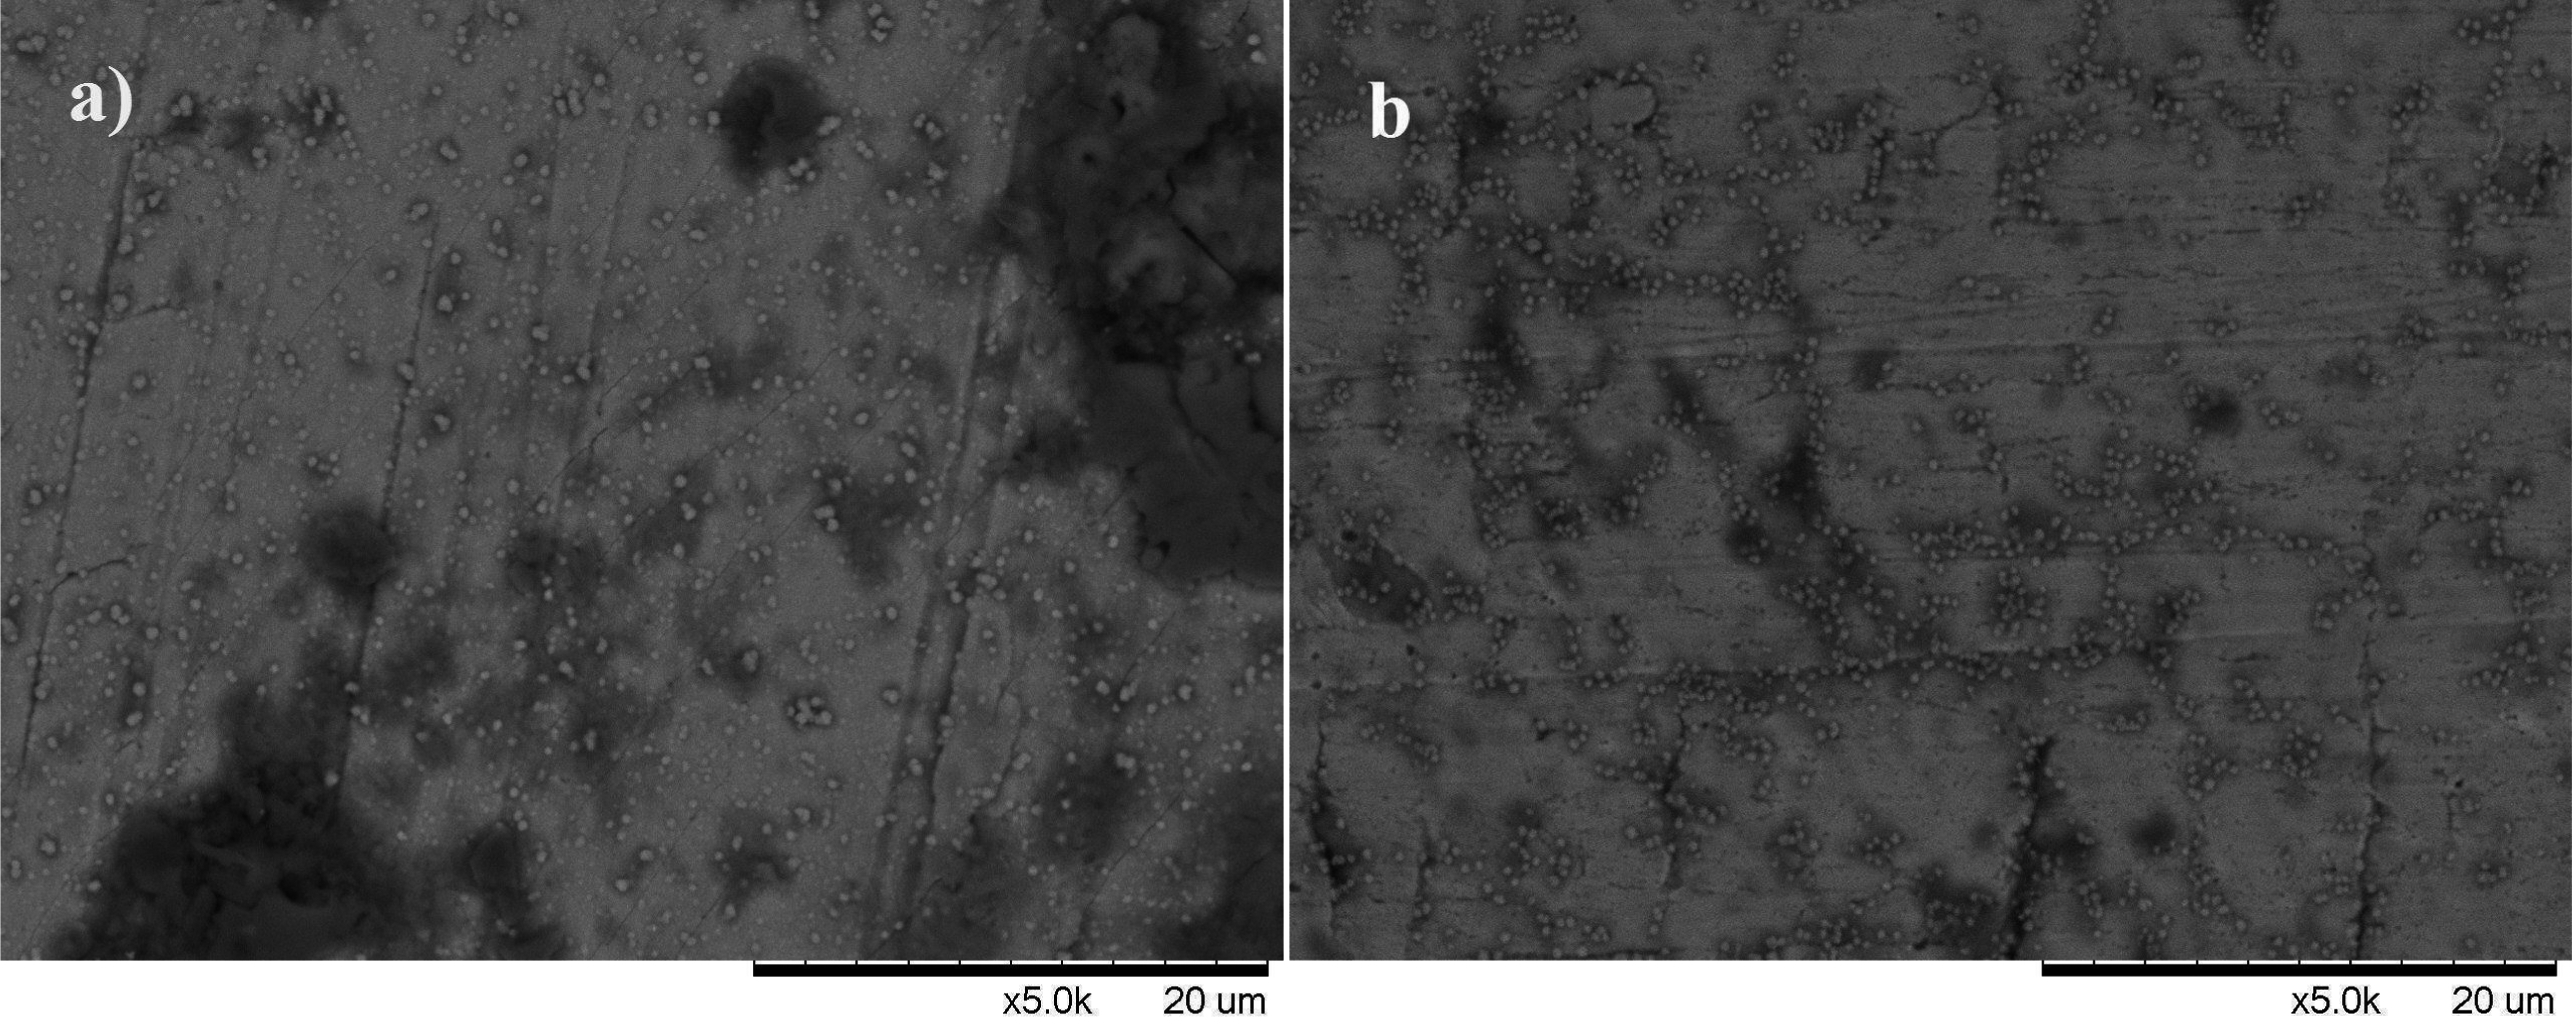
The other defect taking place in the coating is dullness becoming at the edges of coated parts. SEM images of this region are presented in Fig. 9. Because current density is much higher at the surface edges of the coating parts, H2 evolution took place much faster in these regions. Fast gas evolution causes the deterioration of the surface. As seen in Fig. 9a and b, it causes the formation of upward slits on the surface in these regions. In addition, fast hydrogen evolution accelerates the formation of OH− ions, which cause the formation of Cr(OH)3 pittings on the surface. In the second stage, it is considered to turn Cr(OH)3 pittings into Cr2S3 structure at the interphase conditions. In these regions, the quantities of sulphur and sodium were determined as 2·3 and 2·7% respectively.
SEM images obtained at edge of Cr coating (a and b show different regions)
Besides the SEM images of matt and bright zones occurring on the surface of Cr coating, roughness measurement was performed and Ra values were compared. The Ra values exhibited that the Ra values (0·0319 μm) of mat surface were higher than those of the bright surface (0·0291 μm). These values indicate that matt surfaces are rougher than bright surface. It is considered that this roughness takes place due to fast H2 evolution.
Conclusion
In this study, the effects of the chemicals used in the Cr III bath on the brightness and thickness of Cr coating were investigated using experimental design method. In addition, the emergence of coating defects during the Cr coating was characterised using SEM images. The obtained results were interpreted using statistical methods. The following results were obtained in our experimental study:
When the concentration of boric acid was increased, the coating thickness and thereby the bath efficiency were increased, whereas boric acid did not affect the brightness statistically.
To increase the coating thickness, boric acid must be kept at ∼60 g L−1 when the concentration of chromium sulphate is 20 g L−1.
The presence of EDTA in the Cr III bath decreased the brightness but did not affect the thickness. Therefore, it is convenient that this complexing agent should not be used in the Cr III bath.
Fast hydrogen evolution led to blistering of the coating and decreased the coating efficiency and caused the coating dullness.
As a result, the stability of Cr coating is dependent on two important parameters: pH and Cr+3 ion concentration. These two factors change in the bath rapidly, so their controls are very important. If these two factors are under control, the coating defects can be prevented. The most effective method that keeps the pH under control is to use a buffer like boric acid.