
Abstract
Different Cr–TiO2 nanocomposite photoelectrodes were fabricated by in situ anodisation of titanium in a single step process using potassium chromate as the chromium source. The morphology and structure were characterised by field emission scanning electron microscopy, X-ray diffraction and energy dispersive X-ray spectroscopy. Optical properties were investigated by UV–Vis diffuse reflectance spectra. The visible light photocatalytic activity of the Cr–TiO2 nanocomposite photoelectrodes was evaluated by measuring the degradation of rhodamine B dye under visible light irradiation. The results showed that Cr–TiO2 nanocomposite electrodes have excellent photocatalytic performance. Cr–TiO2 nanocomposite produced using 5 mM K2CrO4 exhibited better photocatalytic activity than did the pure TiO2 and Cr–TiO2 nanocomposite fabricated using other chromium concentrations. The anodisation process developed in this study is facile, reproducible and inexpensive and can be easily scaled up, thereby pioneering the fabrication of high performance photocatalysts with promising environmental applications.
Introduction
Nanostructured titanium dioxide thin film is a technologically important material because of its unique photoelectrochemical properties and good chemical stability, which can be used in many high tech applications including water splitting for solar energy conversion, dye sensitised solar cells, environmental remediation, coating materials for self-cleaning windows and photocatalytic processes.1–7 In recent years, many researchers have devoted themselves to the synthesis of TiO2 with different morphologies. However, the main disadvantage of TiO2 as a photoanode is related to poor absorption of sunlight due to its wide band gap (ca. 3·2 eV). Its wide band gap limits its efficiency in most of the photocatalytic processes because only ultraviolet (UV) is utilised for the creation of photoexcited charge carriers. As UV light is only 4% of the solar spectrum, it is highly desirable to tailor the band gap of TiO2 in such a way so that it can absorb light in the visible region, which accounts ∼45% of the solar energy. 8 Therefore, many groups are investigating how to narrow the band gap of TiO2 to maximise the utilisation efficiency of solar energy and increase the yield of the electron hole pair, which is the key factor for the TiO2 applications. One effective approach is to dope different elements into TiO2, including metal or non-metal elements. 9 Recently, there has been an upsurge of interest in doped TiO2 coatings with transition metals.7,10–13 Doped transition metal ions exhibit an isomorphic replacement of Ti4+ ions in TiO2 and decrease the band gap energy, enabling TiO2 to absorb visible light. Furthermore, doped ions can be used as electron or hole trapping centres to improve the separation efficiency of photo induced electron hole pairs of TiO2. 7 Some researchers have reported that Cr doped TiO2 can improve its visible light response. Chromium has been reported as an effective doping metal to modify TiO2 for enhancing its photocatalytic activity.7,14
In this study, TiO2 modified with different amounts of chromium (Cr–TiO2 nanocomposite) was synthesised by a single step anodisation of titanium substrate in an organic bath containing fluoride ion ethylene glycol (EG) having various amounts of potassium chromate. The influences of chromium on the properties of Cr–TiO2 nanocomposite electrode were systematically studied by means of experimental investigation. The morphology and structure were characterised by scanning electron microscopy (SEM), energy dispersive X-ray spectroscopy (EDX) and X-ray diffraction (XRD). Optical properties were investigated by UV–Vis diffuse reflectance spectra. The effect of the quantity of chromium coupled to TiO2 on the visible light photocatalytic activity of the Cr–TiO2 nanocomposite was investigated by degradation of rhodamine B (RhB). RhB is one of the most common xanthene dyes for textile industry. It is famous for its good stability as dye laser materials, and it is also used as biological stain. RhB is highly soluble in water and organic solvent. This compound is now banned from use in foods and cosmetics because it has been found to be potentially toxic and carcinogenic. So, the photodegradation of RhB is important with regard to the purification of dye effluents. 15 The chemical structure of RhB is given in Fig. 1.
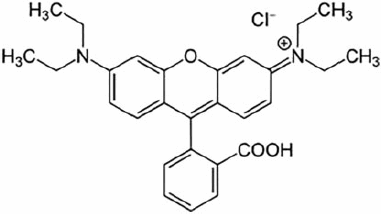
Structure of RhB
Experimental
All chemicals were of analytical grade without further purifying before experiment, and solutions were prepared with distilled water.
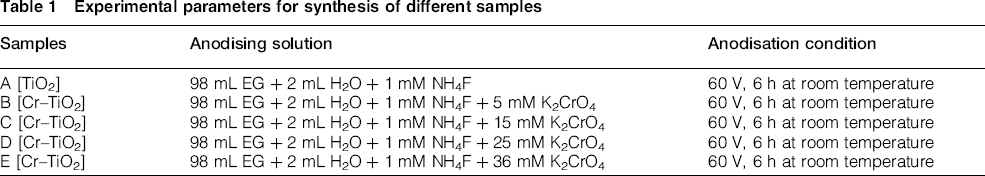
Cr–TiO2 nanocomposite was synthesised by anodic oxidation of titanium in a solution of EG (98 mL) containing 1 mM ammonium fluoride and 2 mL distilled water, followed by the dissolution of different concentrations of potassium chromate (K2CrO4). Before anodising, a piece of titanium sheet (99·99% purity, 1 mm thick) was cut into desired dimension and the titanium electrodes were first mechanically polished with different emery type abrasive papers (with the following grades: 60, 80, 600, 1200 and 2500), rinsed in a bath of distilled water and then chemically etched by immersing in a mixture of HF and HNO3 acids for 30 s. The ratio of components HF/HNO3/H2O in the mixture was 1:4:5 in volume. The last step of pretreatment was rinsing with distilled water. The anodisation experiments were carried out using a conventional two-electrode system with titanium foil as anode and graphite foil with ∼12 cm2 geometric area as cathode respectively. A controlled dc power source (ADAK, PS405) supplied the required constant voltage, and a digital multimeter (Senit, DT-9208A) measured the anodisation current. Anodisation was carried out in mentioned solutions under a constant voltage of 60 V for 6 h at room temperature (25°C). After anodisation at constant potential, the as formed samples were annealed in oxygen atmosphere at 400°C for 2 h, with a ramp of 1°C min− 1 to obtain crystalline Cr–TiO2 nanocomposite. The concentration of potassium chromate in anodising solution was 0, 5, 15, 25 and 36 mM respectively. The as prepared films were marked as A, B, C, D and E corresponding to the gradually increased concentration of K2CrO4. Table 1 summarises the experimental conditions for five different samples. A schematic of the pretreatment method of titanium sheets and process of producing hierarchical Cr–TiO2 nanocomposite on titanium is shown in Fig. 2.
Experimental parameters for synthesis of different samples
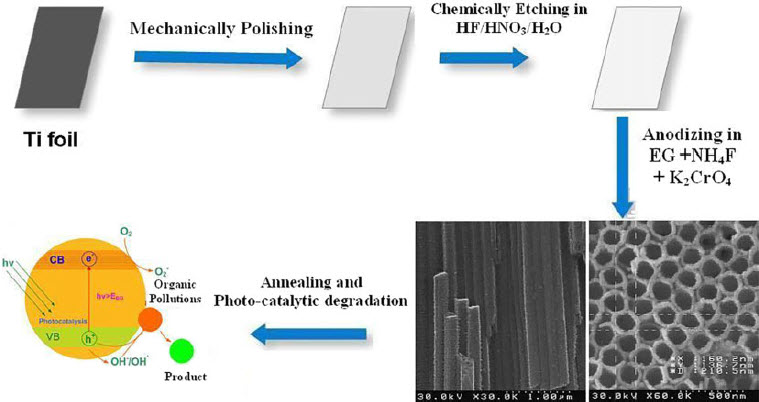
Schematic presentation of pretreatment method of titanium sheets and process of producing Cr–TiO2 nanocomposite on titanium foils
The surface morphology of all samples was characterised by field emission scanning electron microscopy (FE-SEM, Hitachi S-4160, Japan), and the elemental composition was estimated by EDX. The crystalline phases were identified by XRD (Philips X'Pert). Diffraction patterns were recorded in the 2θ range from 20 to 90° at room temperature. The optical absorption of the samples was determined using a diffuse reflectance UV–Vis spectrophotometer (JASCO V-570). The values of the band gap energy (Eg) were calculated using the following equation:

Photocatalytic activities of all the samples were evaluated by degradation of the aqueous RhB under visible light irradiation. The photocatalytic reaction was carried out in a single compartment cylindrical quartz reactor. A 200 W xenon lamp was used as a light source with a 420 nm cutoff filter to provide visible light. The luminous intensity of the xenon lamp was 100 mW cm− 2. One hundred per cent of the light was transmitted by the quartz glass as the xenon lamp shone on the samples. A fan was used to cool down the reactor tube. The actual experiments were performed at room temperature. The initial concentration of RhB was 2 mg L− 1. The volume of the solution was 50 mL. Before illumination, the photocatalyst sample was immersed in quartz reactor containing RhB and magnetically stirred for 2 h in the dark to ensure the establishment of an adsorption–desorption equilibrium between the photocatalyst and RhB. Then, the solution was exposed to visible light irradiation under magnetic stirring for 2 h. At each 10 min intervals, 5 mL solution was sampled and the absorbance of RhB was measured by a UV–Vis spectrophotometer.
Results and discussion
The FE-SEM of the as prepared samples was illustrated in Fig. 3. Figure 3 shows the top view of the samples formed by anodic oxidation in an EG–H2O electrolyte containing NH4F and different concentrations of potassium chromate, which clearly shows the formation of films on the surface of titanium. In Fig. 3a and b, A and B samples displayed vertically ordered nanotube arrays that the surface of them was open. It can be seen that the structure of the two samples consists of a layer of tubes with a diameter in the range of 90–150 nm and wall thickness of 20–40 nm. In Fig. 3c, no nanotubes formed. Porous films were formed instead (sample C). It can be said that when the potassium chromate concentration in solution anodising increased to 15 mM (Fig. 3c), the formed nanotube array becomes very non-uniform, implying that an appropriate concentration of potassium chromate is important for the structure of nanotube arrays. FE-SEM images of D and E in Fig. 3d and e show that a compact film, without porosity, was formed on the surface of titanium. As the consequence of this morphological investigation, it was found that two samples showed a tubular shape, one sample showed a non-uniform (porous) shape and, in two of the samples, a dense film was formed. So, it can be said that the composition of the anodising electrolyte determines the surface morphology.
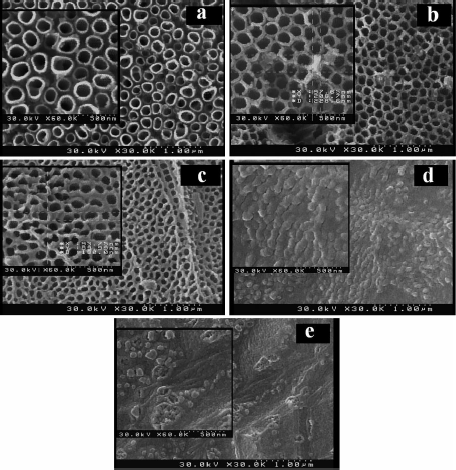
SEM top view images of samples formed by anodic oxidation in EG electrolyte containing different concentrations of potassium chromate: a 0 mM (sample A); b 5 mM (sample B); c 15 mM (sample C); c 25 mM (sample D); e 36 mM (sample E)
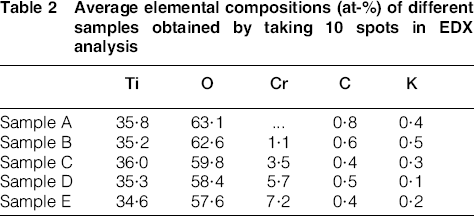
Figure 4 shows the XRD pattern of Cr–TiO2 nanocomposite film (sample B) annealed at 400°C. It can be seen that the fabricated film exhibited characteristic features of anatase TiO2, but no characteristic peak attributed to chromium oxide or Cr component can be found in the XRD patterns, implying that Cr is incorporated into the crystal lattice of TiO2, or chromium is highly dispersed and its size is very small.18,19 It has been considered that metal dopants can be conveniently incorporated into TiO2 lattice when their ionic radii are identical or nearly identical to that of the Ti4+ cation. 19 Since the ion radius of chromium ion is much close to that of Ti4+, it is easy for Cr ion to substitute Ti4+ into TiO2 lattice.18,19 Because chromium oxide reflections were not observed in the diffraction patterns, EDX spectra of films were examined and EDX data of sample B were present in Fig. 5. It was seen that the film mainly consisted of Ti, O and Cr, the contents of whom were present in Table 2. The EDX data of sample B show a peak ∼0·4 and 0·5 keV, and another intense peak appears at 4·5 and 4·9 keV for Ti. The peaks due to chromium are clearly distinct at 0·5, 0·6 and 5·4 keV. These results confirm that Ti, O and Cr exist in the catalyst structure. The occurrence of traces of contaminants such as carbon and potassium from precursors is also observed.
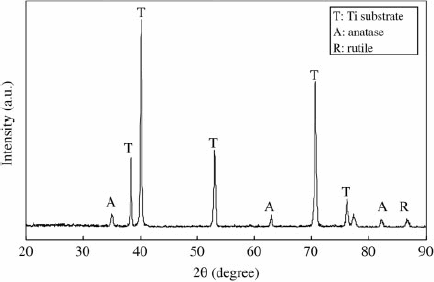
XRD pattern of Cr–TiO2 nanocomposite (sample B) annealed at 400°C
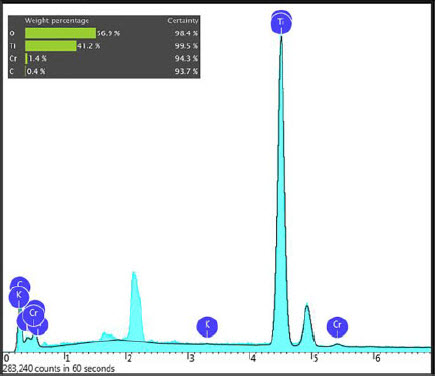
EDX spectrum of Cr–TiO2 nanocomposite (sample B) annealed at 400°C
Average elemental compositions (at-%) of different samples obtained by taking 10 spots in EDX analysis
Regarding the UV–Vis spectra recorded data, the absorption edge of sample E was closer to the visible light region than that of other samples. The results of band gap energies are shown in Fig. 6. The incorporation of Cr extended the ability of TiO2 to respond to higher wavelengths. Concerning the band gap energy (Eg) values, there was a visible shift in the absorption edge for sample E (Eg = 2·15 eV) compared to sample D (Eg = 2·30 eV), sample C (Eg = 2·71 eV), sample B (Eg = 2·82 eV) and sample A (Eg = ∼3·2 eV). These results were in agreement with previous reports that show that the visible shift in the absorption edge of the Cr–TiO2 catalyst depends on the synthesis method, the nature of the precursors and the calcination temperature of the samples. 20 These findings can be attributed to the fact that the conduction band of the Cr–TiO2 film was reformed in the presence of chromium ions.

Plot of (
)1/2 versus hυ employed to calculate band gap values of different Cr–TiO2 nanocomposites; inset: plot of (
 )1/2 versus hυ employed to calculate band gap values of undoped TiO2 sample
The photocatalytic degradation efficiency using catalysts A–E was evaluated under visible light irradiation based on the percent of degradation of an initial concentration of 2 mg L− 1 RhB in an aqueous solution. The first RhB degradation experiments were conducted under visible light irradiation to evaluate direct photolysis without the addition of any catalyst. The concentration of RhB remained nearly constant after 120 min of irradiation. Thus, no obvious degradation of RhB was observed in this time period. In addition, a dark control experiment was conducted, indicating that the adsorption of RhB onto the surface of the catalyst in the absence of visible light radiation was negligible. The photocatalysis results indicated that the photocatalytic process was very effective in the removal of RhB, and it was observed that the degradation of RhB was enhanced using Cr–TiO2 catalyst. Figure 7 shows photocatalytic activity of different samples that were followed through degradation of RhB as a function of irradiation time with visible light. Under the irradiation of visible light, undoped TiO2 sample showed almost no photocatalytic activity, but the Cr doped samples showed photocatalytic activity. Figure 7 shows that sample B exhibited better photocatalytic activity than other samples under Xe illumination. In addition, it can be seen that the photocatalytic activity of Cr–TiO2 samples is higher than that with undoped TiO2 sample. The higher photocatalytic activity of Cr–TiO2 samples can be attributed to the combined effect of several factors: the Cr doping, the one-dimensional nanostructure and the increased light harvesting ability (capability to absorb visible light and higher light absorption compared to undoped TiO2 nanotubes). According to literature, it can be said that chromium element can induce more effective visible light harvesting, which is caused by photoexcitation of the extrinsic absorption band of the catalyst. The extrinsic absorption comes from the photoionisation of original or newly formed defects and the excitation of surface states. Furthermore, the extrinsic absorption can create oxygen vacancies to enhance the photocatalyst ability of the Cr–TiO2 nanocomposite. 9 Such absorption requires less energy to activate. Thus, Cr–TiO2 probably generates more free charge carriers to induce surface chemical reactions than pristine TiO2 under visible light irradiation. Therefore, the photocatalytic activity of Cr–TiO2 samples is larger than that of undoped TiO2 sample in our study. However, the unique one-dimensional nanostructure of the nanotubes also contributes to its high photocatalytic ability. The one-dimensional morphology allows for electrons to move axially along the length of the nanotubes, providing direct and faster electron transport to the back to the contact, while photogenerated holes are separated and collected over relatively short distances in an orthogonal direction. Nanotubes are believed to have exceptional electron transport properties and have been considered as alternatives to nanoparticles. It has been reported that TiO2 nanotubes can reduce intercrystalline contacts between grain boundaries, and its stretched grown structure to the specific directionality makes a slightly favourable contribution to the electron transport and the significant improvement of electron lifetime by the degraded charge recombination through experiencing the less frequent trapping/detrapping events.9,20,21 For this reason, photocatalytic activities of nanotubes (sample B) are greater than those of nanopores (sample C) and compact (samples D and E) structures. In addition, the nanotube architecture has a large internal surface area and can be easily filled with liquid, thus enabling intimate contact with electrolyte. In other words, the surface area of the nanotubes is higher than the nanoporous (B>C) and the surface area of nanotubes and nanoporous is higher than the compact films (B and C>D and E). Therefore, we can expect such behaviour in photocatalytic activity of samples
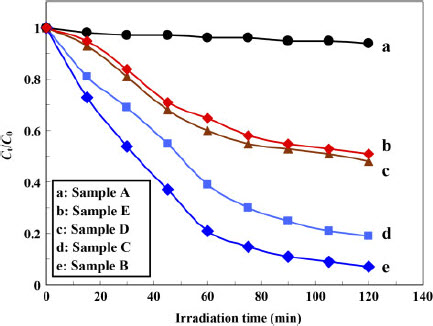
Photocatalytic degradation of RhB over different samples under Xe light irradiation
The stability of a photocatalyst was also important to its practical application for it can be regenerated and reused. We investigated the cyclic stability of sample B by monitoring the catalytic activity during successive cycles of use. As shown in Fig. 8, after a four-cycle experiment, the catalyst (sample B) exhibited similar catalytic performance without significant deactivation, revealing its high stability after multiple reuses.
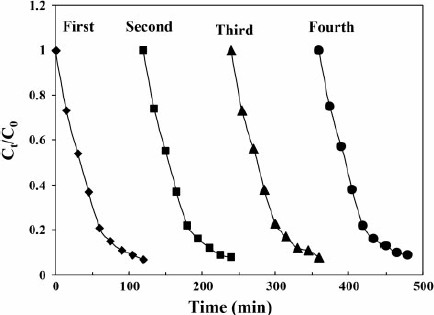
Photocatalyst stability test of Cr–TiO2 nanocomposite (sample B)
Conclusions
In summary, we prepared different Cr–TiO2 nanocomposite photoelectrodes utilising a facile and novel anodisation process in a single step process using potassium chromate as the chromium source. The morphology, crystal phase, chemical composition and photocatalytic activity of the prepared samples were evaluated using various characterisation techniques. The elemental components of the coatings are Ti, Cr and O. The Cr–TiO2 nanocomposites are mainly composed of anatase. Cr–TiO2 nanocomposites have excellent photocatalytic performance. Sample B exhibited better photocatalytic activity than did other samples. In addition, this photocatalyst showed good stability and it could be recycled several times without significant loss of its activity. Since the Cr–TiO2 nanocomposite electrodes can be easily removed and replaced after the photocatalytic reaction, avoiding the filtration step after photoreaction or the immobilising process required for photocatalyst particles, the operation in the photoreactor becomes much easier from an engineering point of view.