
Abstract
In this paper, Mn–TiO2 nanocomposite films were successfully fabricated by the anodising of pure titanium plates in a non-aqueous electrolyte solution containing manganese ions. For the first time, potassium permanganate was used as the Mn source in anodising process. The morphology, structure and composition of these nanocomposite films were characterised by scanning electron microscopy, X-ray diffraction, energy dispersive X-ray spectroscopy, elemental mapping and UV–Vis absorption spectrum respectively. Characterisation of the as prepared films indicated that potassium permanganate concentration in anodising solution significantly influenced the morphology of the surface, structure and photocatalytic activity of these films. So, to access a specific morphology, a proper concentration of KMnO4 is required. Photocatalytic activity of samples was evaluated by testing the water splitting. The Mn–TiO2–1 nanocomposite exhibited better photocatalytic activity than did the bare TiO2 film and other Mn–TiO2 nanocomposites.
Introduction
Depletion of non-renewable fossil fuels and global warming problem have made hydrogen an ideal future energy source due to its high energy content and zero emission of greenhouse gases. Currently, the majority of hydrogen demands are sourced from steam reforming of natural gas; however, this process does not mitigate dependence on fossil fuels and generates large amount of carbon dioxide. Alternatively, photocatalytic water splitting has been considered as one of the most promising approach for renewable hydrogen production, ever since the discovery of photoelectrochemical water splitting at a TiO2 electrode by Fujishima and Honda, due to its environmental friendliness and potential contribution to future energy needs.1,2 Various researches have shown that TiO2 is an ideal photocatalyst due to its relatively high reactivity and chemical stability under the irradiation of light.3–9 However, the application of TiO2 is limited by the fast recombination rate of the photogenerated electron–hole pairs and the high band gap (3.2 eV), which diminishes its absorption in the visible light range of the solar spectrum.10,11 To efficiently utilise solar energy, many efforts have been devoted to extending the spectral response of TiO2 to the visible spectrum by dye sensitisation, metal complex sensitisation, coupling with a small band gap semiconductor and doping transitional metal ions or non-metal atoms, and so on.12–19 Unlike most of the metal dopant, manganese doped TiO2 has generated considerable interests as a photocatalyst, showing optical response in the visible region. Different methods were used to prepare Mn doped TiO2, but most of these methods were multistage, time consuming and expensive, and their reproducibility was weak.20–24 Therefore, a simple, facile and inexpensive method of synthesising Mn doped TiO2 is necessary. Until now, very less research has been done to introduce manganese into the TiO2 nanotube array by anodising process. To the best of our knowledge, report on the preparation of Mn–TiO2 nanotube composite films by single step anodisation is lacking. In addition, to our knowledge, the quantity effect of manganese doped in TiO2 nanotubes for H2 generation in photocatalytic activity has not been reported. In the present study, we report a simple approach to fabricating Mn–TiO2 nanotube composites by a single step anodising of titanium substrate in a non-aqueous bath containing dimethyl sulphoxide (DMSO) fluoride electrolyte and various amounts of potassium permanganate (KMnO4). For the first time, we used KMnO4 as the manganese source. The TiO2 nanotube films with different amounts of manganese were obtained by controlling the concentration of KMnO4 in anodising electrolyte. The morphology and structure were characterised by scanning electron microscopy (SEM), energy dispersive X-ray spectroscopy (EDX) and X-ray diffraction (XRD). Optical properties were investigated by UV–Vis diffuse reflectance spectra.
Experimental
All the chemicals used were of analytical grade without further purifying before experiment, and solutions were prepared with distilled water.
Mn–TiO2 nanotube composites were synthesised by anodising of titanium in a proper electrolyte. Before anodising, a piece of titanium sheet (99.99% purity, 1 mm thick) was cut into desired dimension and the titanium electrodes were first mechanically polished with different emery type abrasive papers (with the following grades: 400, 800, 1000, 1500 and 2000), rinsed in a bath of distilled water and then chemically etched by immersing in a mixture of HF and HNO3 acids for 30 s. The ratio of components HF/HNO3/H2O in the mixture was 1:4:5 in volume. The last step of pretreatment was rinsing with distilled water. The anodising process was carried out in an electrolytic cell using a titanium foil as anode and platinum foil with ∼14 cm2 geometric areas as cathode. Anodising was performed in a solution of DMSO and HF, followed by the dissolution of different concentrations of potassium permanganate. The temperature of the electrolyte was maintained during the anodising process at (25 ± 1)°C. Anodising was performed for 6 h at a constant potential of 40 V using a controlled DC power supply source (ADAK, PS405). A schematic of the pretreatment method of titanium sheets and process of producing Mn–TiO2 nanocomposite films on titanium is shown in Fig. 1. After anodising, the as formed samples were annealed in oxygen atmosphere at 430°C for 2 h (5°C min− 1) to obtain crystalline samples that lead to composites films with varied weight loading percentage of manganese. In the present work, we compare the photocatalytic performance of bare TiO2 and Mn–TiO2 films with different quantity of manganese referred to as Mn–TiO2–1, Mn–TiO2–2 and Mn–TiO2–3. Table 1 summarises the experimental conditions for four different samples.
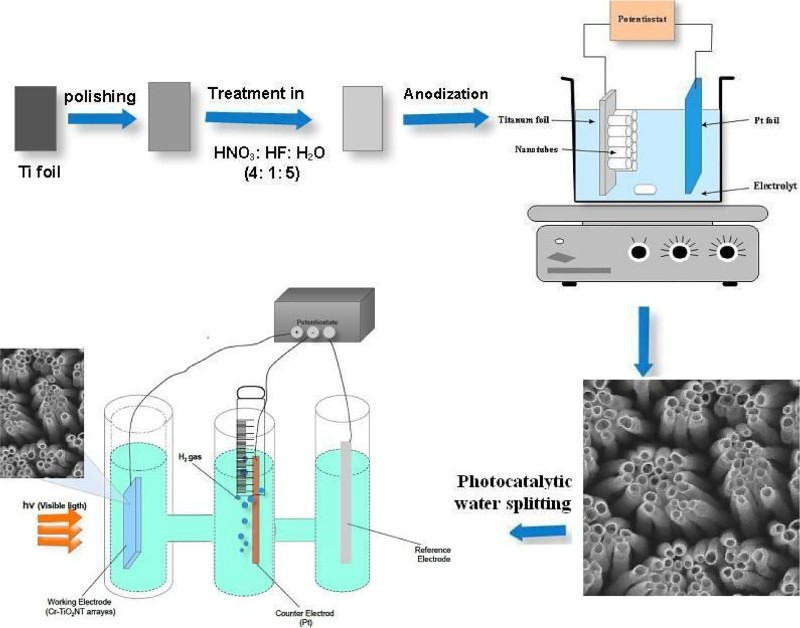
Schematic presentation of pretreatment method of titanium sheets and process of producing Mn–TiO2 nanocomposite films on titanium foils
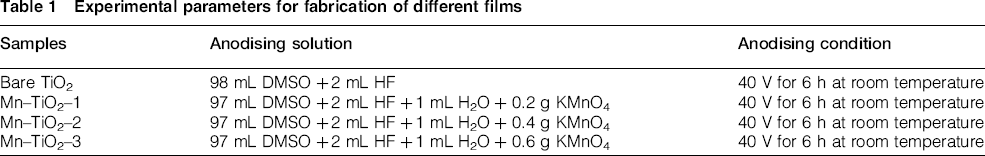
Experimental parameters for fabrication of different films
The surface morphologies of all samples were characterised by field emission SEM (FE-SEM, Hitachi S-4160, Japan), and the elemental composition was estimated by EDX. Elemental mapping was conducted by energy dispersive spectroscopy. The crystalline phases were identified by XRD with Equinox 3000 diffractometer (Inel, France). Diffraction patterns were recorded in the 2θ range from 20 to 80° at room temperature. The optical absorption of the samples was determined using a diffuse reflectance UV-visible spectrophotometer (JASCO V-570).
Photocatalytic water splitting to generate hydrogen was carried out in a three-branch quartz cell. A 200 W xenon lamp was used as the light source. The luminous intensity of the xenon lamp was 100 mW cm− 2. The Mn–TiO2 and bare TiO2 sample was fixed in the cell containing 1.0 M NaOH (pH 13.6) solution facing the lamp. Hydrogen evolution was measured for 360 min, and H2 gas was collected using the water displacement technique. A schematic diagram of the experimental set-up for photocatalytic water splitting was shown in Fig. 1. A Pt coil served as the cathode. The cathode was inserted into a burette where the hydrogen was collected via electrolyte displacement. The volume of hydrogen was measured by directly reading the variation of the electrolyte level in the burette for various times.
Results and discussion
Figure 2 shows top view FE-SEM images of Mn–TiO2–1, Mn–TiO2–2 and Mn–TiO2–3 respectively, which clearly shows formation of films on the surface of titanium. In Fig. 2a and b, different samples displayed nanotube arrays, in which the surface of them was open. In Fig. 2a, highly ordered and vertically aligned nanotubes were formed on the Ti substrate. The average pore diameter of these nanotubes as calculated from SEM images is 70–100 nm, and wall thickness is 20–30 nm. In Fig. 2b, a combined structure of nanotubes and nanopores was formed. It seems that a porous structure is emerging on the surface of the nanotubes. In Fig. 2c, no nanotubes formed. Porous films were formed instead (Mn–TiO2–3). It can be said that when the potassium permanganate concentration in anodising solution increased to 4 g L− 1 (Fig. 2c), the formed nanotube array becomes very non-uniform, implying that an appropriate concentration of dopant is important for the structure of nanotube arrays. From the cross-sectional view of Mn–TiO2–1 sample in Fig. 2d and e, it can be seen that the formed nanotubes are parallel aligned, opened on top and have a length in the range of 7–8 μm.
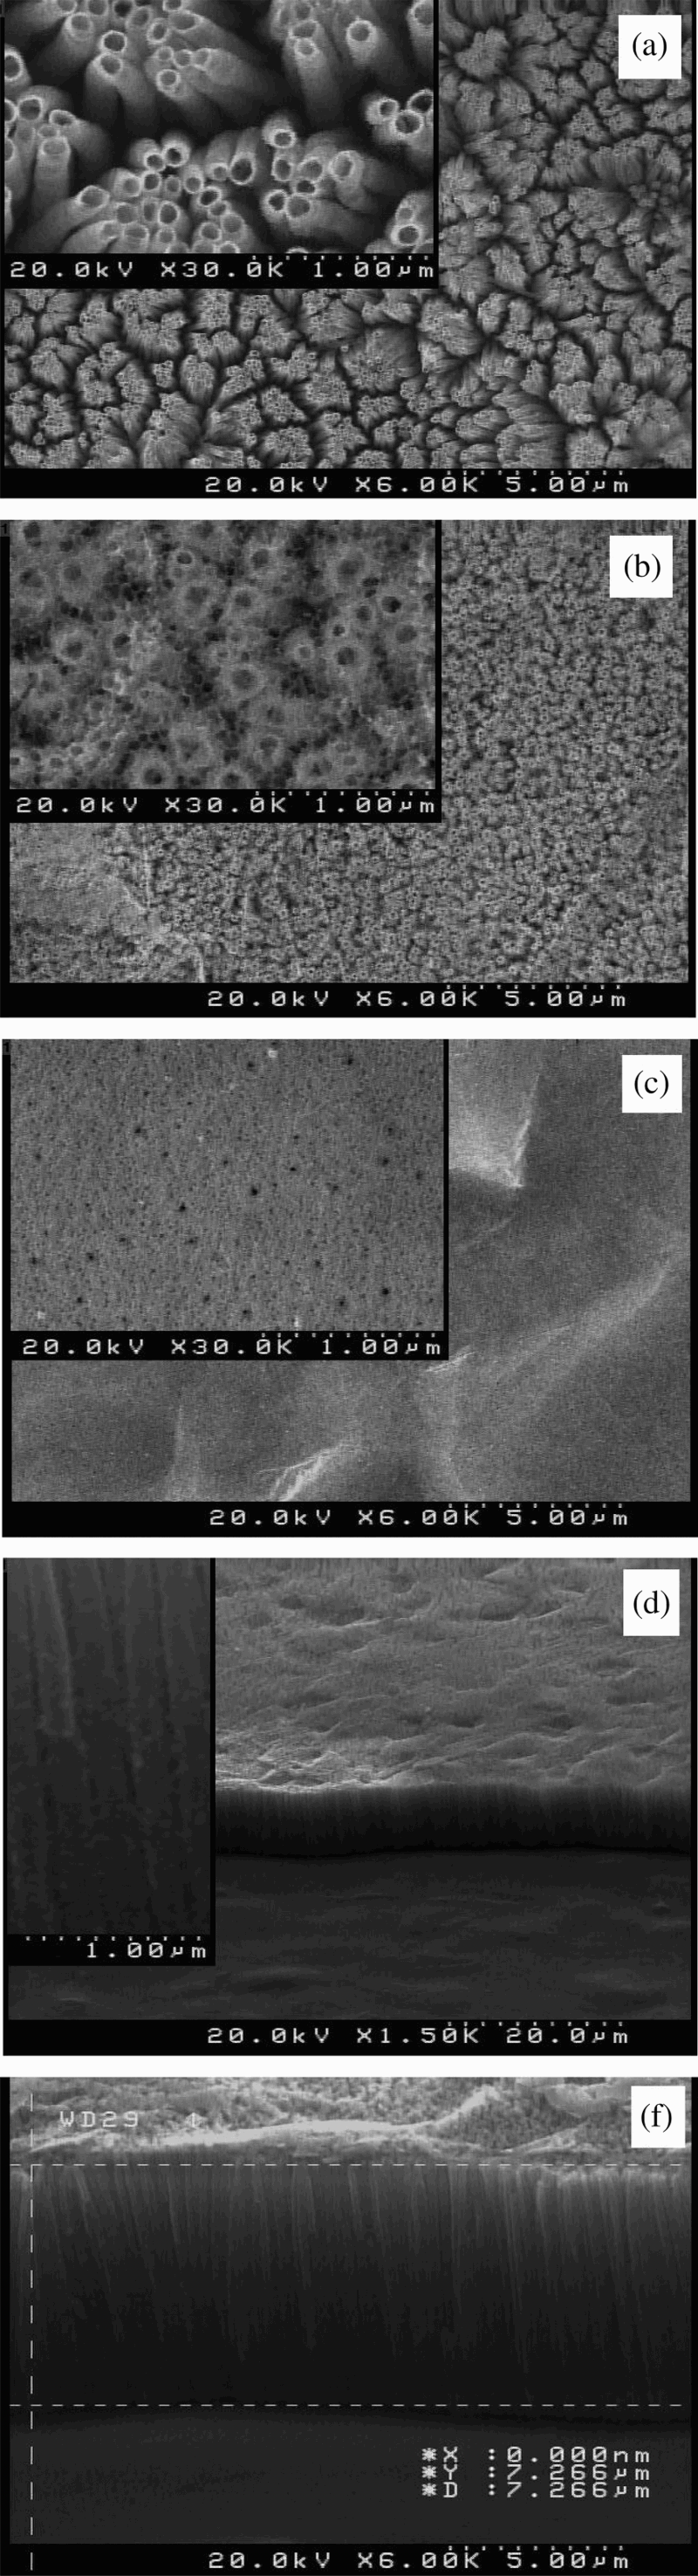
SEM top view images of Mn–TiO2 with different magnification: a Mn–TiO2–1; b Mn–TiO2–2; c Mn–TiO2–3; d, e cross-sectional image of Mn–TiO2–1 with different magnifications
The XRD patterns of Mn–TiO2 film are shown in Fig. 3. Diffractions that are attributable to anatase TiO2 are clearly observed in the calcinated sample. The Ti peaks were due to the titanium substrate. XRD pattern of the synthesised Mn–TiO2 shows the diffraction peaks of both MnO2 and TiO2, and two diffraction peaks of MnO2 are found in this sample.
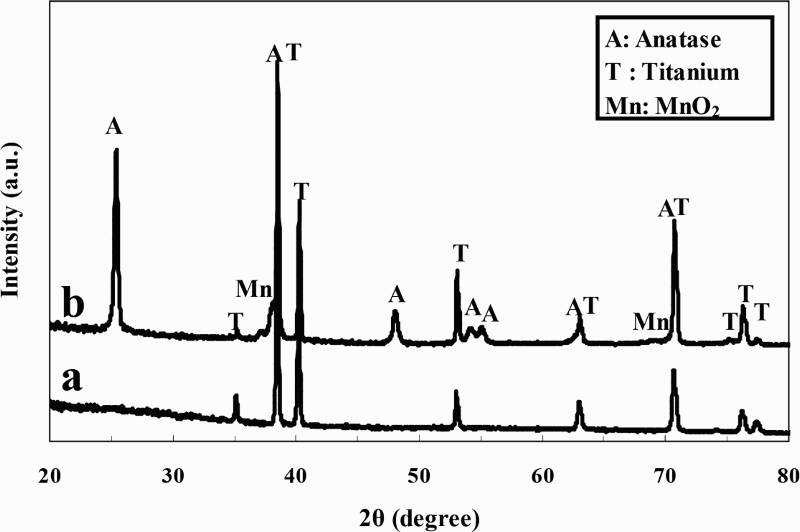
XRD patterns of Mn–TiO2 sample: a as prepared; b annealed at 430°C
The elemental compositions of the as prepared Mn–TiO2 sample were studied by EDX and energy dispersive X-ray mapping, and the results are displayed in Fig. 4. The data confirm that the samples are composed of Ti, Mn and O. The occurrence of traces of contaminants such as the fluorine, sulphur and potassium from precursors is also observed. The elemental maps demonstrated that O, Ti and manganese are homogeneously distributed on the surface of the sample.
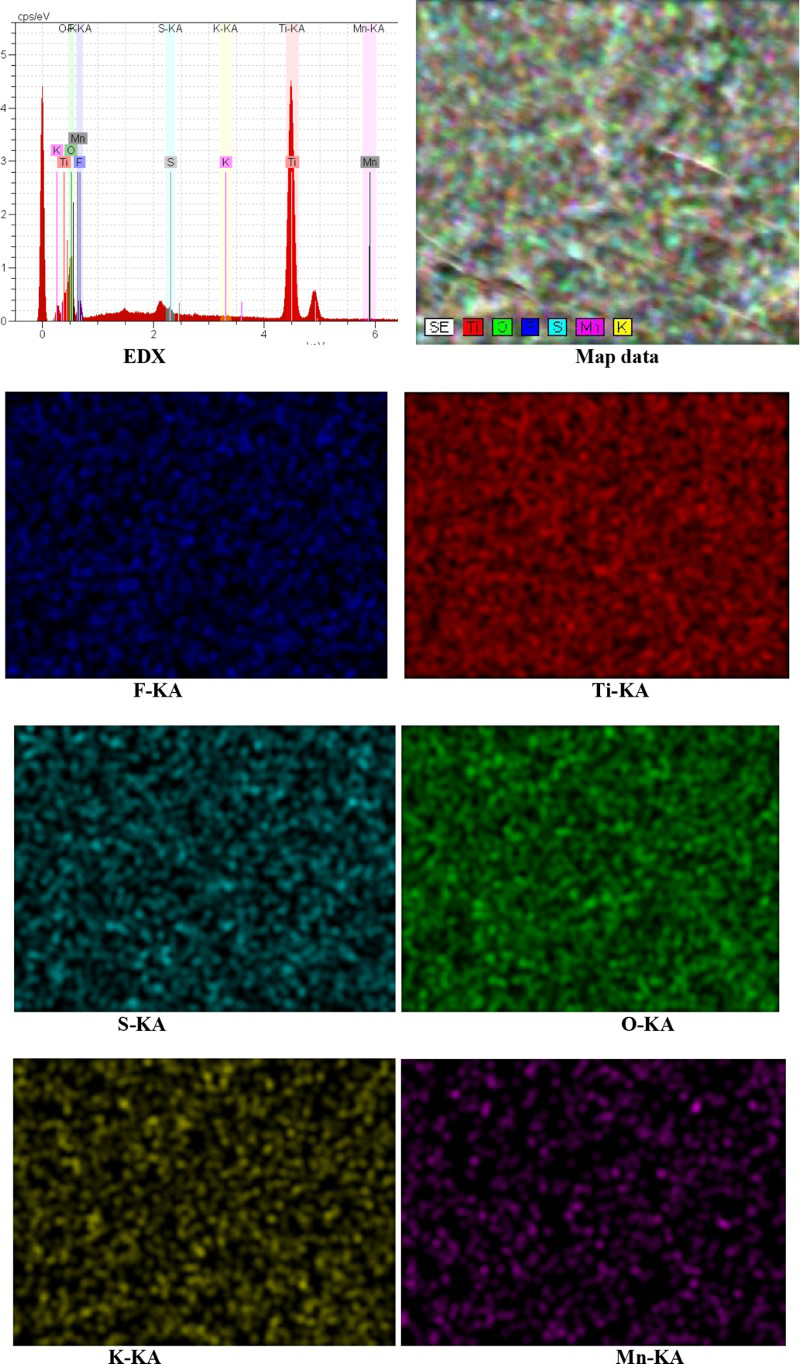
EDX spectra and EDX mapping of MnTNT sample, indicating spatial distribution of different components on surface of MnTNT sample
The optical properties of different samples were studied. Figure 5 shows the optical band gap energy of bare TiO2 and Mn–TiO2 samples annealed at 430°C respectively. The reflectance data, reported as F(R) values, have been obtained by application of the Kubelka–Munk algorithm. The band gaps of the samples have been deduced from the Tauc plot. Figure 5 is the plot of [F(R)hυ]½ versus photon energy. The extrapolation of [F(R)hυ]½ to the abscissa at zero F(R) provides the band gap energy as ∼3.22 eV for bare TiO2 and the band gap energies of ∼ 3.0, 2.90 and 2.72 eV for Mn–TiO2–1, Mn–TiO2–2 and Mn–TiO2–3 respectively. It can be seen that compared with bare TiO2, all of the Mn–TiO2 samples exhibit a red shift of absorption edge and band gap decrease with the increase of manganese concentration. These results indicate that the doping of Mn in TiO2 films decreases the band gap.

Plot of
versus hυ employed to calculate band gap value of different samples
The primary purpose of this work is to investigate the activities of TiO2 modified with different amounts of Mn through water splitting over these samples. Figure 6 shows the amount of hydrogen generated as a function of time using bare TiO2 and Mn–TiO2 samples under Xe light illumination. Control experiments indicated that no appreciable hydrogen production was detected in the absence of either light irradiation or photocatalyst, suggesting that hydrogen was produced by photocatalytic reactions on samples. In all catalysts, hydrogen evolves steadily over extended periods of time. It can be found that Mn–TiO2–1 sample performed the highest photocatalytic activity under light irradiation. The total amount of H2 that evolved on the Mn–TiO2–1 sample was 96 μL cm− 2 after 6 h, which is ∼1.3 times higher than that on the sample Mn–TiO2–2 (74 μL cm− 2), 2.1 times higher than that on the sample Mn–TiO2–3 (45 μL cm− 2) and 5 times higher than that on the bare TiO2 sample (19 μL cm− 2).
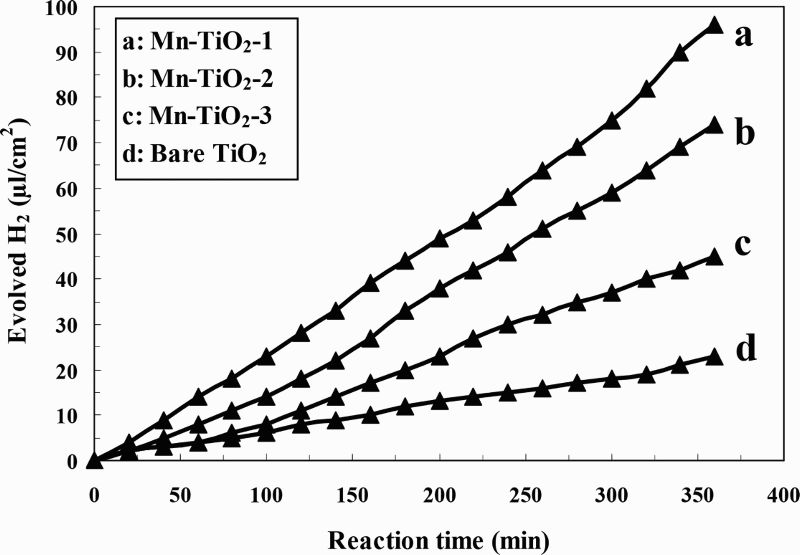
H2 production by water splitting over different samples under irradiation
Conclusion
The major conclusions from the present work are as follows:
Undoped TiO2 and Mn doped TiO2 films were successfully synthesised using single step anodisation method. Potassium permanganate was used as the manganese source in anodising process. SEM analysis showed that potassium permanganate concentration in anodising solution significantly influenced the morphology of these films, so by changing KMnO4 concentration, nanotubes, nanopores and porous films are created on the titanium surface. The thickness of the films is ∼ 7–8 μm. XRD, EDX and energy dispersive X-ray mapping analysis showed that the films contain pure anatase, suggesting that Mn is incorporated in the TiO2 films and confirming that the samples are composed of Ti, Mn and oxygen. UV–Vis spectroscopy data show that the band gap decreases with increasing manganese concentration. The photocatalytic testing of these films through solar water splitting revealed that Mn doping can significantly improve the H2 production amount of these materials.