
Abstract
The electroless copper plating using sodium hypophosphite as the reductant and sodium citrate as the chelating agent was studied by gravimetric and electrochemical measurements. The effects of temperature, pH, boric acid, citrate, hypophosphite, nickel catalyst and copper concentration were tested. A chemical model was defined to determine the composition of all ionic species in the bath solution. The kinetics of the electroless copper deposition was interpreted on the basis of the dehydrogenation of the reductant, mixed potential theory and in the ionic speciation of the bath. Scanning electron microscopy, X-ray microanalysis by energy spectroscopy dispersion and X-ray diffraction applied on surfaces show that the deposits are composed by binary (Ni–Cu) and ternary alloys (Cu–Ni–P) and that their crystallinity depends on phosphorus content.
Keywords
Introduction
Autocatalytic metal ion reduction systems, including electroless copper plating solutions, are broadly used to produce articles for decorative and functional purposes, i.e. for deposition of metal coatings on dielectrics, 1 printed circuit boards, 2 conductors of complex shape or non-conductor surfaces.3,4 The physicochemical characteristics of autocatalytic deposits are closely dependent on the composition of the baths and the respective operating conditions.5–6 Hence, the interest of research performed about the kinetic phenomena arising at the metal/solution interface.7–9
Most of commercially electroless copper baths use (i) formaldehyde, 10 as the reducing agent; (ii) sodium potassium tartrate (called as ‘Rochelle salt’), sodium citrate or ethylenediamine tetraacetic acid, as complexing agents; (iii) boric acid as a buffer; (iv) oxygen or thiourea, as additives for stabilising the system; and (vi) cyanide or proprionitrille, as additives for accelerating the reaction.
Formaldehyde baths produce high quality copper with excellent electrical and mechanical properties at low cost and are widely available. However, formaldehyde has been listed recently as a hazardous material. So, some promising processes replacing formaldehyde by other reducing agents have been proposed, such as using hypophosphite,11,12 dimethylamine borane,13,14 hydrazine, 15 glyoxylic acid, 16 Co(II), 17 Fe(II), 18 sodium bisulphite and sodium thiosulphate. 19 Among these, the plating process based on hypophosphite has attracted considerable attention because of its low price, good bath stability and relatively easy to control plating conditions.
The hypophosphite ion does not exhibit reactivity on Cu surface, even though hypophosphite has highly negative electrode potential. Thus, this process is built through the use of small amount of Ni or Co ions added as the catalyst.
The use of complexing agents in the baths aims to control the effective availability of copper ion in the desired cathodic reaction. The stability of the bath, grain size and the composition of the binary Cu–Ni or ternary Cu–Ni–P alloys depends on the ionic speciation of the solution, i.e. the resulting complexes of copper ion and the ligand. Coordination numbers of Cu and stereochemistry of their each complex are in standard, 4 with tetrahedral and with quadrate, and 6 with distorted octahedral. However, on the structural reason is difficult to distinguish these three structures.20,21
The goal of this work is to establish a chemical model to calculate the detailed ionic composition of plating baths and show how it can help to explain the kinetics, morphology and crystallinity of copper–nickel alloys from electroless process using hypophosphite as reductant. We are aware that his is the first time that this approach is performed.
Experimental
Chemicals and solutions
The standard bath solution consists of 0·024M CuSO4·5H2O, 0·27M NaH2PO2·H2O, 0·052M Na3C6H5O7·2H2O, 0·50M H3BO3 and 0·002M NiSO4·6H2O, pH adjusted to 9·0 and temperature 65°C. All chemicals were reagent grade, and deionised water was used to prepare the solutions.
Plating procedure
A stoppered test tube (90 mL) containing 70 mL of copper plating solution was placed in a thermostatic container ( ± 0·5°C accuracy). This volume of the bath was considered to be enough to guarantee a system in steady state during 30 min of deposition. The alkalinity of the solutions was evaluated with accuracy ± 0·02 pH units using a Cryson 2002 apparatus. All assays were performed in static conditions.
Aluminium (99%) wire 1·5 mm in diameter and ∼3 cm long, and area ∼1·4 cm2, was used as a substrate for deposits of Cu–Ni alloys. The samples before be introduced into the plating solution were pretreated according to the following operative sequence: clean up with acetone; alkaline degreasing (30 g L− 1 Na2CO3, 8 g L− 1 Na2SiO3, T = 80°C, t = 2–4 min); acid pickling (HNO3 50% v/v, T = 40°C, t = 2 min); and washing with deionised water.
The metal deposition was determined from the difference between the initial weight of the sample to the value obtained at the end of each test, after appropriate rinsing, immersion in ketone and drying.
Electrochemical procedures
The electrochemical experiments were performed in one-compartment cell with three electrodes connected to Autolab model PGSTAT20 potentiost/galvanostat with pilot integration controlled by GPES 4.4 software. The working electrode rod (1 cm diameter) was aluminium, copper or nickel 99%. The electrodes were mechanically polished with abrasive paper (1200-grade) and rinsed with water before each electrochemical experiment. Platinum was used as auxiliary electrode, and potentials were measured versus an Ag/AgCl (1·0M KCl) reference electrode.
Microscopy, spectroscopy, and X-ray diffraction analysis
The scanning electron microscopy (SEM) images and the analysis by energy dispersive X-ray spectroscopy (EDS) were made with a FEI Quanta 400FEG, fitted with an EDAX Genesis X4M microanalysis probe.
The X-ray observations were performed on ABS substrates (1·5 cm × 1·5 cm × 0·3 cm) with copper deposits obtained for different ratios of total concentration of Ni2+ to (Ni2+ + Cu2+) in solution.
ABS samples were subjected to a pretreatment before submitting them to the metallisation process, according to the following procedure: (i) degreasing in alkaline solution – 20 g L− 1 Na2CO3+10 g L− 1 sodium gluconate+30 g L− 1 Na3PO4+1·5 g L− 1 sodium dodecyl (ester) sulphate, at 65°C with stirring for 10 min; (ii) washing in water at 65°C with stirring for 5 min; (iii) etching with chromic solution to provide hydrophilic and microroughened surface – 375–425 g L− 1 H2CrO4+180–220 ml L− 1 H2SO4 (98%), at 65–70°C with stirring for 12–15 min; (iv) washing with water at 25°C with stirring for 6 min; 5) conversion of Cr (VI) to Cr (III) in 30 g L− 1 NaHSO3 solution, at 25°C with stirring for 2–3 min; (vi) washing in water at 25°C with stirring for 4 min; (vii) preactivation in HCl (30%) solution with stirring at 25°C for 4 min; (viii) sensitisation in 10 g L− 1 SnCl2+60 ml L− 1 HCl (37%), at 30–32°C with moderate stirring for 5 min; (ix) washing with water at 25°C with moderate stirring for 1–2 min; (x) activation to produce catalytic sites that will enable chemical deposition of nickel or copper in 0·5 g L− 1 PdCl2+20 mL L− 1 HCl (37%) at 40°C for 5 min; (xi) washing with water at 25°C with moderate agitation for 4 min; (xii) post-activation or acceleration in a 50 g L− 1 H2SO4 (98%) at 25°C with moderate stirring for 2–4 min; (xiii) washing in water at 25°C with moderate stirring for 4 min.
The X-ray diffraction (XRD) spectra was carried out in a PANalytical X'Pert Pro MPD equipped with a X'Celerator detector and secondary monochromator (Cu Kα = 0·154 nm, 40 kV, 30 mA; data recorded with 0·017 step size, 100 s/step). The species identification was performed trough the HighScore Plus software with the ICDD database. Rietveld refinement with PowderCell software (CCP14, Federal Institute for Materials Research and Testing) was used to calculate lattice parameters and crystallite size from the XRD diffraction patterns.
The content of copper, nickel and phosphorus inside the deposit was determined directly on the coating by SEM/EDS, and also by atomic absorption spectroscopy using a Perkin Elmer Model 5100PC after dissolving the same in nitric acid solution.
Autocatalytic process according to mixed potential theory
A chemical deposition process is an example of a system with more than one electrochemical reaction, i.e. in addition to the main reactions occur simultaneously other reactions called secondary or parasites. The main reactions are the oxidation of the reductant R and the reduction in the metallic ions Mn+ in question


The cathodic and anodic phenomena, in the absence of convection, will be interpreted as exclusively being controlled by diffusion or activation.
In diffusional control, the current is independent of potential and takes the form 23
If the concentration of the electroactive species on the metal interface is null, equation (6) takes the form of so called limiting current
The electrode potential is then function of the control system of electrochemical phenomena. In a system where the cathodic reaction is controlled by diffusion and the anodic reaction by activation, the surface potential established is as follows


Chemical model to copper plating system
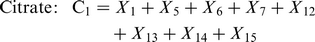
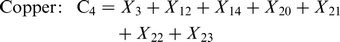
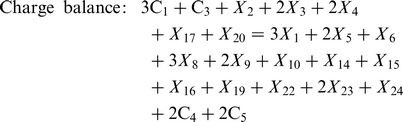
The chemical model proposed for the determination of the composition of the copper plating solutions, 25 species, includes 19 correlations, equations (11) to (29) listed in Table 1, and the following material and charge balances
Chemical equilibrium in copper plating solutions*
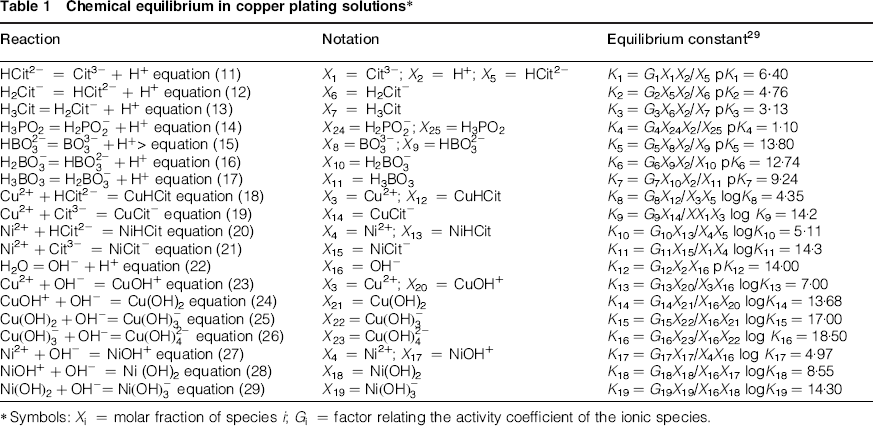
Symbols: Xi = molar fraction of species i; Gi = factor relating the activity coefficient of the ionic species.


The activity coefficients of the ionic species necessary for to know the factors Gi, Table 1, were calculated from the modified Debye–Hückel equation utilising the modifications proposed by Robinson and Guggenheim and Bates
24


Results and discussion
Morphology and crystallinity
The morphology varies significantly with operating conditions. Figure 1a shows a rough structure composed of granules with different shapes and sizes, where it is possible to distinguish copper crystals. Increasing the concentration of citrate decreases the particles size, Fig. 1b–d, and for the higher concentration, Fig. 1e, it is possible to see pits related with the hydrogen evolution. This suggests a copper deposition under diffusion control by limiting current. The growth of the copper layer is perpendicular on the surface. Meanwhile, the deposit acquires a rough structure of cauliflower-like agglomerates particles when increases the nickel content in the bath, Fig. 1f, which seem to mean an amorphous structure. This is confirmed by the XRD patterns of the films deposits obtained at different nickel copper ratio in the bath, Fig. 2. At low Ni/Cu ratio in the deposit, the structure is crystalline appearing three peaks at 2θ values of 43·5, 50·6 and 74·2° corresponding to (111), (200) and (220) planes of copper, according to the standard powder diffraction card of JCPDS. 26 The (111) is the preferred orientation plane of face centred cubic (fcc) crystals of both copper and nickel leading to more compactness (close packed) in the deposit. With the increase in Ni/Cu ratio in the deposit, the (111) peak slightly deviates to higher 2θ values and broads, which means a higher Ni content and a more amorphous structure. This can be explained with the increase in the phosphorus content in the matrix. In fact, it has been shown in some studies that the phosphorus content of the deposit controls the structure of the Ni–Cu–P alloys, which becomes amorphous for contents >8·7%. 27
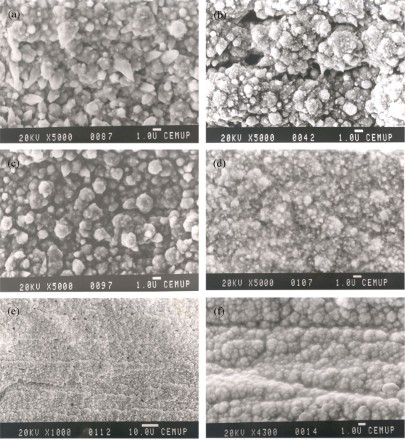
Images (SEM) of copper deposits from standard solution with following alterations: a [NiSO4] = 0·004M; b [Na3C6H5O7] = 0·04M; c [Na3C6H5O7] = 0·08M; d [Na3C6H5O7] = 0·16M; e [Na3C6H5O7] = 0·18M; f [NiSO4] = 0·035M and [CuSO4] = 0·005M
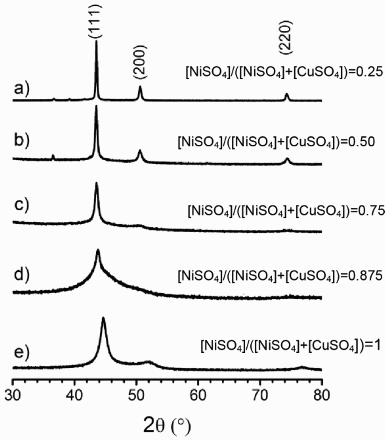
X-ray diffraction patterns of Cu–Ni–P alloys for different ratios between [NiSO4] and ([CuSO4]+[NiSO4]): a 88·53Cu–10·57Ni–0·9P; b 77·56Cu–19·54Ni–2·9P; c 44·36Cu–49·14Ni–6·5P; d 29·55Cu–62·65Ni–7·8P; e 90·8Ni–9·2P
Effect of electroless time
The thermodynamic and kinetic feasibility of an electroless process requires the adsorption of the reducing agent on the substrate surface in order to promote its oxidation. The materials able to do this interaction are the so called catalytic materials, such as nickel, cobalt, gold and palladium. 28 In the case of aluminium substrate, the nickel deposition is initiated by galvanic displacement giving rise to the catalytic surface on which, thereafter, the Cu–Ni electroless deposit develops. The adherence of the deposit is poor, but it is adequate for the intended kinetic study.
The thickness of the Cu–Ni deposits on aluminium progresses linearly during the maximum time of 60 min, as seen in Fig. 3. So, the solution composition is not significantly affected during this time, i.e. there is no interference of composition on the phenomena of charge transfer at the solution/metal interface, for anodic and cathodic areas. The analysis of nickel content of deposits shows an average value of 4·67% in the interval between 20 and 50 min. Therefore, all the trials have been performed during 30 min. The phosphorus content is about 0·3–0·4%.
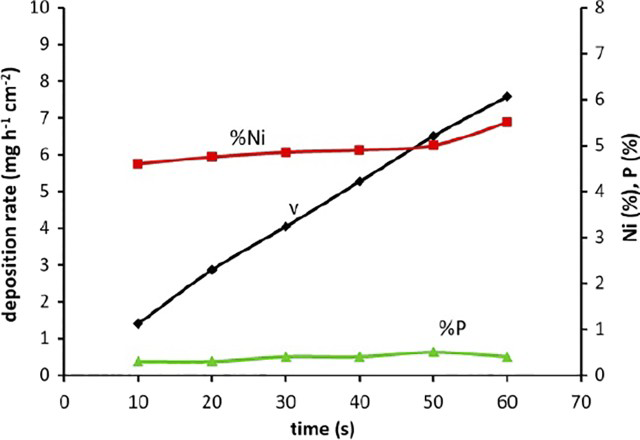
Influence of time on deposition rate and alloy composition, for standard bath composition
Effect of nickel catalyst
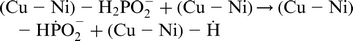
Figure 4 shows the effect of formal concentration of catalyst on the deposition rate and coating composition. An increase in overall rate with increasing nickel content in deposit can be seen. Attending to the ΣCu and ΣNi function profile, it is concluded that the reaction is controlled electrochemically. In terms of mechanism and designating the active centres by (Cu–Ni), the controlling step of hypophosphite oxidation passes by dehydrogenation on the surface with the formation of a radical8,29

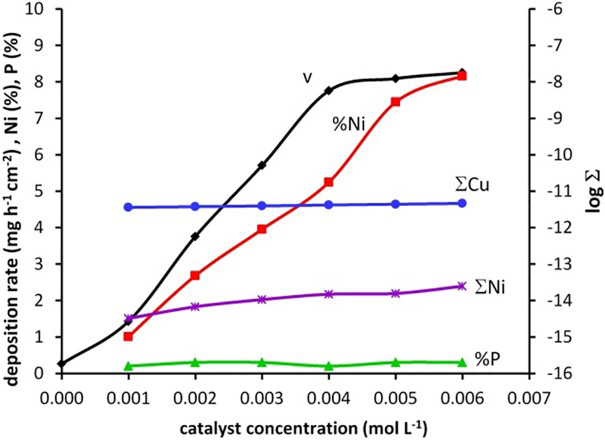
Influence of catalyst concentration on deposition rate, ionic speciation of copper and nickel positive ions and alloy composition for standard bath composition


Effect of pH
Figure 5 shows that the reaction rate increases with pH, an effect of concentration on the step of hypophosphite oxidation, equations (42) or (45). Although a reduction on the concentration of solvated species Ni2+ and Cu2+ with alkalinity occurs, an effect of ionic distribution in the bath composition, the reaction rate increases with the pH range with a small increase in nickel content in the alloy. As the concentrations ΣCu and ΣNi increases, it must be admitted that the deposition rate depends on all positive ions in solution. Thus, removal of the hydroxyl ion in the metallic complexes takes place simultaneously with the step of charge transfer

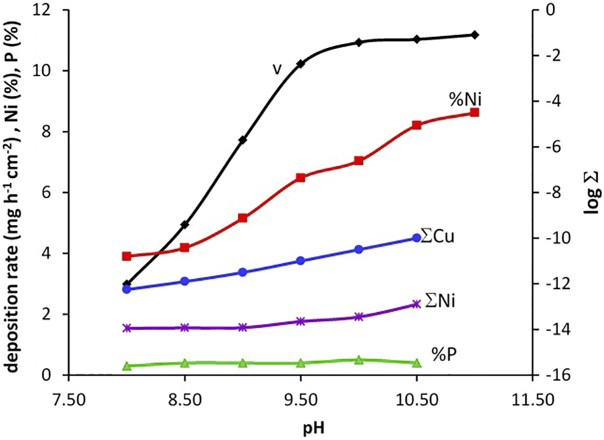
Influence of pH on deposition rate, ionic speciation of copper and nickel positive ions and alloy composition for standard bath composition with [NiSO4] = 0·004M

Effect of hypophosphite
Figure 6 shows a linear dependence between the concentration of the reductant and the deposition rate. However, for higher reducing agent concentrations of 0·4M the global reaction rate tends to a plateau indicative of a diffusional control for cathodic reaction: v = 9·40 mg cm− 2 h− 1; ΣCu = 36·88 × 10− 13 M; ΣNi = 12·84 × 10− 15 M; and Cu–6·95Ni–0·45P composition alloy. Considering the Faraday equation and alloy composition, the limiting current density for copper deposition is jL(Cu) = 7·34 mA cm− 2. The surplus negative charge in the substrate will be consumed in the hydrogen evolution.
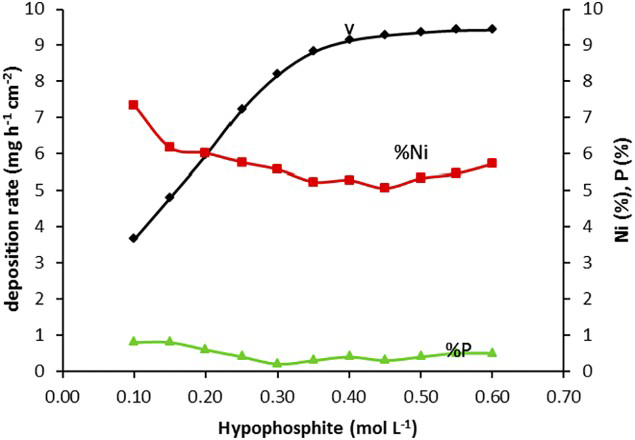
Influence of hypophosphite concentration on deposition rate and alloy composition for standard bath composition with [NiSO4] = 0·004M and pH 9·5

Effect of citrate
The observation of Fig. 7 shows that the deposition rate presents a plateau for the concentration of citrate < 0·05M, which means that the limiting current density is identically to that observed in the trials related with the effect of the reductant agent, jL(Cu) = 7·34 mA cm− 2, while for higher values the rate decreases with the concentration of citrate. This behaviour is explained by the dual effect of citrate, i.e. in reducing concentrations of ΣCu and ΣNi and in the number of active centres, since there is a decrease in the nickel content in the deposit. Thus, the deposition rates for citrate concentrations higher than 0·05M correspond to systems operating under diffusional control for the cathodic reaction.
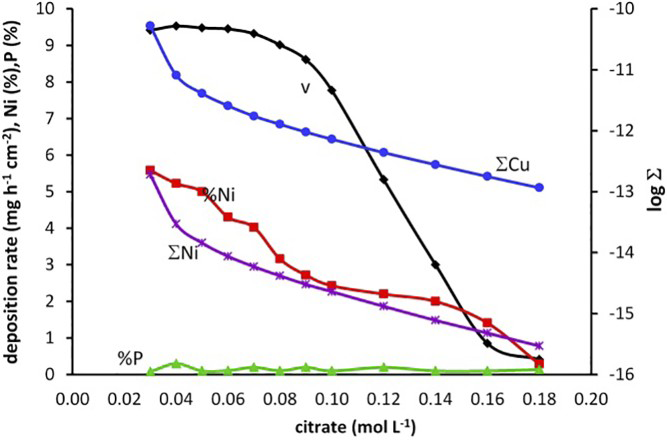
Influence of citrate concentration on deposition rate, ionic speciation of copper and nickel positive ions and alloy composition for standard bath composition with [NiSO4] = 0·004M, [NaH2PO2] = 0·40M and pH 9·5
Effect of boric acid
The influence of boric acid on the deposition rate is synthesised in Fig. 8. The results allow saying that the action of the buffer is manifested in the ionic speciation and composition of the deposit. The deposition rate initially increases due to the creation of more catalytic centres until to reach the limiting current iL. From this position in the system, the rate decreases with the concentration of boric acid due to decreased concentrations of ΣCu and ΣNi, which is consistent with the interpretation realised for the citrate. Eventually some specific action of the buffer on the substrate surface may also occur.9,31
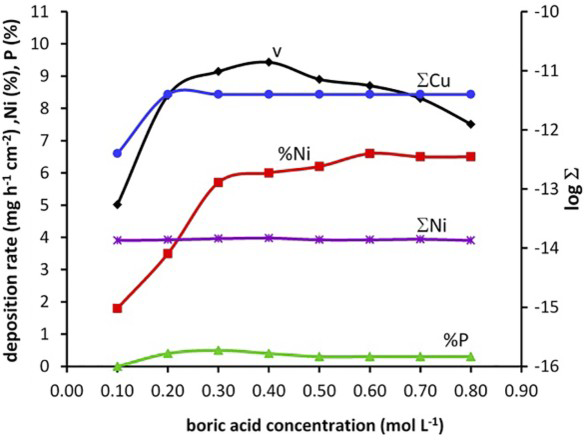
Influence of boric acid on deposition rate, ionic speciation of copper and nickel positive ions and alloy composition for standard bath composition with [NiSO4] = 0·004M, [NaH2PO2] = 0·40M and pH 9·5
Effect of copper concentration
The influence of the concentration of copper in the overall growth of the deposit thickness, Fig. 9, confirms the diffusional control of the cathodic reaction. The sudden drop in rate to the 0·045M concentration is a natural consequence of reducing the number of catalytic centres, and as such, the potential of the system will depend mainly on the anodic polarisation.
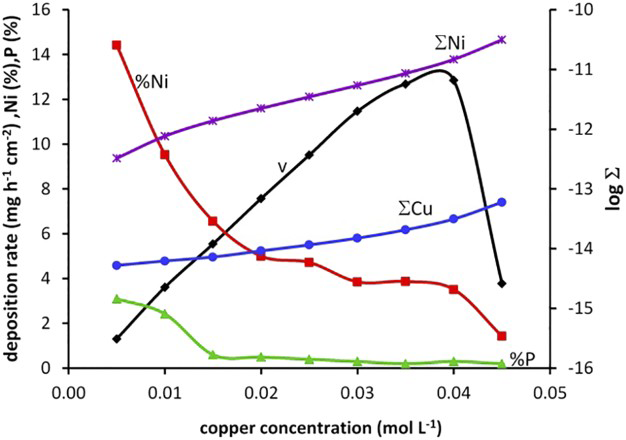
Influence of copper concentration on deposition rate, ionic speciation of copper and nickel positive ions and alloy composition for standard bath composition with [NiSO4] = 0·004M, [NaH2PO2] = 0·40M and pH 9·5
Effect of concentration ratio between [NiSO4] and ([CuSO4]+[NiSO4])
Figure 10 shows the effect of the mole fraction of nickel to total nickel and copper concentration in the bath, on the overall deposition rate. The negative slope of this correlation is consistent with the information contained therein: decrease in ΣCu, increase in ΣNi and increasing contents of Ni and phosphorus in the coating.
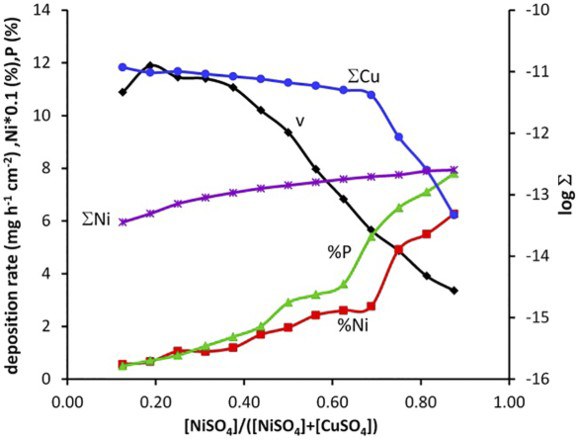
Influence of ratio between catalyst and amount of catalyst plus metal on deposition rate, ionic speciation of copper and nickel positive ions and alloy composition for standard bath composition with [NiSO4]+[CuSO4] = 0·04, pH 9·5 and [NaH2PO2] = 0·40M
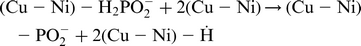
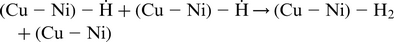
Experimentally, it has been found that increased nickel content in the bath promotes the release of hydrogen and the codeposition of phosphorus according to the following reaction:
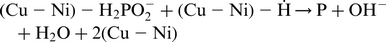
The equilibrium phase diagrams of Ni–P or Cu–P exhibit basically no solid solubility of phosphorus in nickel or copper at ambient temperatures. The alloy is mainly pure copper, α-(Cu–Ni) phase and the possible intermetallic Ni3P and Cu3P.32,33 During electroless plating, there are no ideal conditions to formation the intermetallic compounds, since a movement of large numbers of atoms by surface diffusion will be necessary in order to achieve the correct stoichiometry of three nickel or copper atoms to one phosphorus atom. This movement cannot occur before the next layer of atoms has been placed down; thus, the phosphorus atoms are trapped not uniformly between nickel or copper atoms, resulting in supersaturation. Only a restricted area can have the correct ratio of nickel atoms to the phosphorus atoms, the remainder being copper–nickel alloy. The entrapment of phosphorus makes impossible the development of fcc lattice extended over large surfaces. If the fcc structure cannot be maintained at all, the structure is considered to be amorphous. The results of XRD, Fig. 2, confirm that deposits having higher phosphorus contents are amorphous.
Despite the decrease in ΣCu, but given that ΣNi increases as well as the nickel content in the deposit with the molar fraction of nickel to the total content of copper and nickel, the decrease in deposition rate should be attributed to reduction in the active centres on surface due the presence of phosphorus atoms.
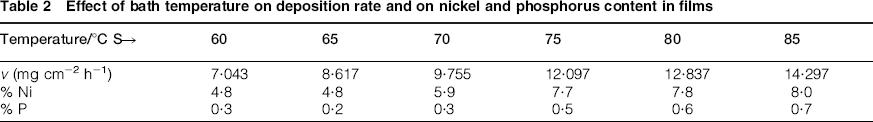
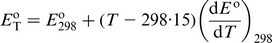
Effect of temperature
Table 2 shows the effect of temperature on the global deposition rate. The analyses of these results according to Arrhenius equation reveal activation energy of 6·6 kcal mol− 1, i.e. a system under mixt control: the anodic reaction under electrochemical control and the cathodic reaction under diffusion control.
Effect of bath temperature on deposition rate and on nickel and phosphorus content in films
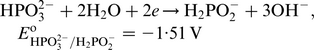
Potential of electroless deposition
Monitoring the potential of the aluminium wire through the deposition proved the existence of two stages: (i) the first, when the potential initially acquires a very negative corresponding to aluminium solubilisation and consequently copper and nickel deposition by galvanic displacement; (ii) the second, when the potential tends to a more positive value stabilising according to the operating conditions, being around − 0·997 V versus Ag/AgCl (1·0M KCl) for standard bath composition. Li and Kohl 34 have observed that the steady OCP for copper deposition from a similar bath composition is between − 0·981 and − 1·064 V versus SCE.
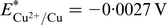
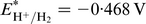
According to the electrochemistry, the standard reduction potential of copper, nickel, phosphite and hypophosphite are shown as follows
35


 ;
;
 ;
;
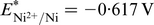 ;
;
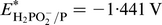 ;
;
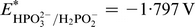 .
.
It is therefore now possible to draw a diagram of Evans that shows the application of the theory of mixed potential for electroless copper deposition, Fig. 11. Clearly, the deposition of phosphorus cannot be explained by the electrode reaction (56), since its open circuit potential is lower than the deposition potential at which the system operates. Thus, reaction (52) is more consistent, i.e. the formation of phosphorus from a radical reaction: the hydrogen radical in the active centres of the Cu–Ni interacts with hypophosphite and promotes the alloying of P into Cu–Ni.
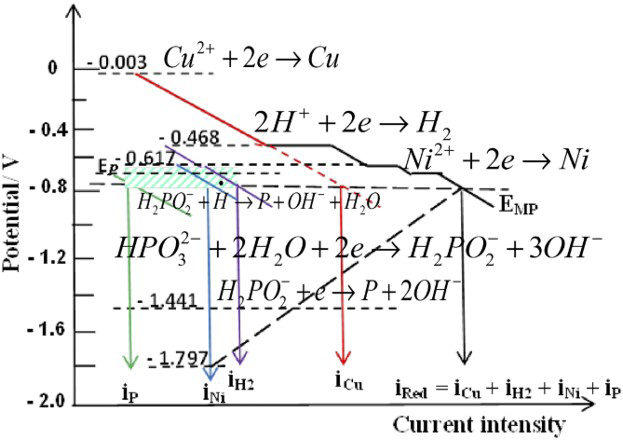
Sketch of diagram of Evans for electrode reactions according to theory of mixed potential
Conclusion
A chemical model based on reversible reactions has been established to determine ionic speciation into copper plating baths. The values of ΣCu and ΣNi, associated with the alloy composition and microstructure allow interpreting the effect of the plating parameters on the kinetics of copper deposition.
The effect of pH on the deposition rate shows that the cathodic reaction has to be extended to the cationic complexes of copper and nickel with the hydroxyl ions. The linear slope of the deposition rate decreases for pH >9·5.
The action of the hypophosphite shows that the cathodic reaction is controlled by diffusion and that the maximum deposition rate is 9·40 mg cm− 2 h− 1 for the following conditions: 0·024M CuSO4·5H2O, 0·40M NaH2PO2·H2O, 0·052M Na3C6H5O7·2H2O, 0·50M H3BO3, 0·004M NiSO4·6H2O, pH 9·5 and temperature 65°C.
Increasing the formal concentration of nickel into the bath increases the nickel content in the alloy as also the deposition rate, which means that the oxidation of hypophosphite is under electrochemical control. Meanwhile, the concentration of copper also increases the deposition rate showing a diffusion control for the cathodic reaction. The calculated activation energy of 6·6 kcal mol− 1 ratified this mixt control of the system. However, for the ratios [NiSO4]/([NiSO4 + CuSO4]) higher than 0·2, despite increasing the ΣNi and nickel content in the alloy, the deposition rate is successively lower. This is due to the increase in phosphorus content in the alloy that poison the active centres. Its microstructure becomes amorphous for phosphorus content higher than 6·5%.
The operating potential of the system for the standard composition of the bath is − 0·997 V versus Ag/AgCl (1·0M KCl), but the open circuit potential for the deposition of phosphorus from phosphite, according to ionic speciation of the plating bath is − 1·441 V versus NHE. This confirms the electrocatalytic oxidation of hypophosphite by dehydrogenation. Thus, the deposition of phosphorus in the Cu–Ni–P alloy can be explained by the interaction of an H atom removed from P–H bond with a new molecule of hypophosphite.
Footnotes
Acknowledgements
We acknowledge the Portuguese Science and Technology Foundation (FCT) for funding the Researcher Center LAB2PT, and the UME/UTAD and RNME in the person of Professor P. B. Tavares by X-ray analysis. This work was dedicated to Professor Jazelia Costa.