
Abstract
In this paper, the feasibility of the production of Fe–WC nanocomposite by mechanical alloying was investigated. The raw materials containing ferrotungsten and carbon black with tungsten carbide were milled in a planetary ball mill and sampled after different time periods. Studies showed that in samples containing ferrotungsten and carbon black, milling for long times did not lead to the synthesis of tungsten carbide. However, with the addition of 1 wt-% tungsten carbide to the raw materials as nucleation, tungsten carbide was produced after 75 h of milling and was stable in longer time periods. After 125 h of milling, all the raw materials disappeared, and iron emerged in the form of ferrite. From the broadening of the X-ray diffraction peaks, the crystalline size of the synthesised tungsten carbide was estimated in nanoscale. Increasing the milling time results in smaller crystalline size; however, the mean strain increased.
Introduction
Owing to the unique physical and mechanical properties of metal matrix composites, nowadays, the use of these materials in aerospace, automotive industries and wear resistance applications is growing.1 Among used carbides as reinforcement materials, TiC and WC enjoy the special place.2 Nevertheless, due to the low toughness of TiC, attempts have been made to replace TiC with WC as the reinforcement phase in metal matrix composites.3 The WC is a ceramic with high melting point, excellent hardness, low wear coefficient, high chemical stability and oxidation wear resistance. Furthermore, unlike other ceramics, WC benefits from good toughness. 4 4,5
Usually, the used matrix for WC reinforcement is cobalt;6 however, due to the possibility of heat treatment and welding, machinability, lower density, better mechanical properties, higher melting point, non-toxicity, lower price and availability, iron can be a suitable alternative to cobalt. This composite can be used in applications such as ball heading and free fall mould. 3 7 3,7,8
Conventional methods for the production of this composite are casting,1,9–11 surface methods such as sputtering, 8 12 8,12,13 high velocity oxygen fuel, 14 14,15 plasma16 and laser 17 17,18 and also powder metallurgy.19 Alternatively, one of the new methods is mechanical alloying (MA). Mechanical alloying is an ideal procedure for the production of nanoscale powders. Because of the high amount of defects formed during this process, the mechanical properties of the synthesised powder are unique. 20 20,21 Co–WC and Fe–TiC (in the previous authors’ paper) nanocomposites have been synthesised via MA, 22 22,23 but Fe–WC nanocomposite has not been produced by MA so far. For the first time, in this paper, it has been tried to produce this composite from cheap raw materials like industrial ferrotungsten (used in casting industries for alloying) and carbon black through the MA method.
Experimental
The raw materials used in this research included industrial ferrotungsten with mean particle size of 5 μm and chemical composition illustrated in Table 1, amorphous carbon black as the carbon source with purity of >99% and mean particle size of 0·5 μm and tungsten carbide with purity of >99% and mean particle size of 1 μm. The only visible phases in ferrotungsten observed in the X-ray diffraction (XRD) patterns were Fe3W3C and W with card numbers of 041-1351 and 001-1203 respectively. The raw materials were mixed and milled in a high energy planetary ball mill at the stoichiometric ratio according to reaction (1), and the samples were extracted after different time periods, i.e.

Chemical composition of used ferrotungsten

To determine the present phase type and also to calculate the crystalline size by Williamson–Hall method,
23
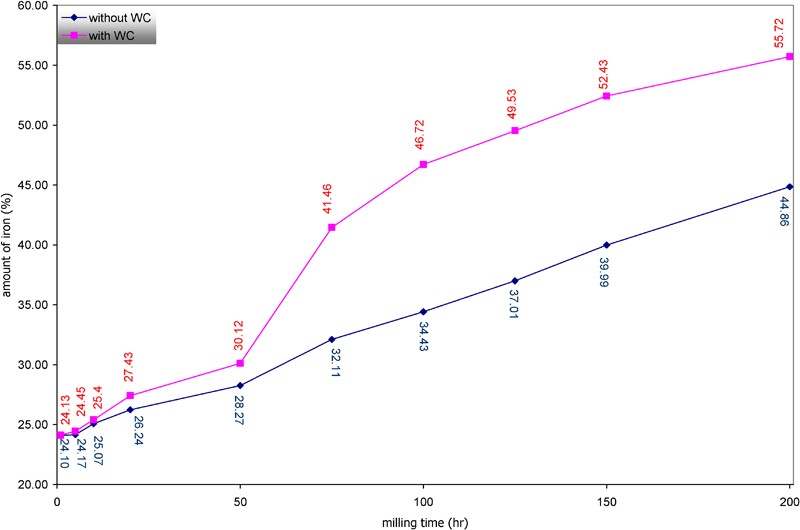
23,24 an XRD instrument (Siemens model) was utilised using Cu Kα with a wavelength of 1·5405 Å and voltage and current of 30 kV and 25 mA respectively. In order to calculate the full width at half maximum, PANalytical X'Pert HighScore software was used. X'Pert HighScore uses the pseudo-Voigt profile function, which is the weighted mean between a Lorentz and a Gauss function, i.e.
For the calculation of unit cell parameters, the modified Nelson–Riley technique was used.25 In addition, to study the microstructure of the material, scanning and transmission electron microscopes (TEM and SEM) with a voltage of 25 kV were used. Finally, for diagnosing the possibility of entrance elements into the system, inductively coupled plasma (ICP) method was applied.
Results and discussion
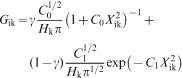
The XRD peaks of samples containing ferrotungsten milled for different time periods are shown in Fig. 1. As it is obvious in Fig. 1a, before 30 h of milling, the only visible phases are W and Fe3W3C. As noted, since the source of carbon was amorphous, the carbon peak cannot be seen in the diffraction pattern. However, even if the carbon was not in amorphous form, due to the egregious differences between the mass absorption coefficients of the three materials, the possibility of detecting the carbon peaks would be very weak (MACW = 172·07 cm2 g−1 and MACC = 4·30 cm2 g−1 and
 = 201·14 cm2 g−1). Increasing the milling time resulted in the broadening of the peaks and a slight decrease in the intensities, which indicates a reduction in the crystalline size as a result of longer milling time. Owing to the decrease in the peak intensity, tungsten peaks were situated in the background and were not visible (Fig. 1b). This phenomenon continued until the time of 200 h, at which all of the phases were amorphous, and only the mound of the strongest peak of Fe3W3C existed. This treatment has also been reported in other systems.20
X-ray diffraction pattern samples containing ferrotungsten and carbon at a 1–30 h and b 50–200 h (*: Fe3W3C; +: W)
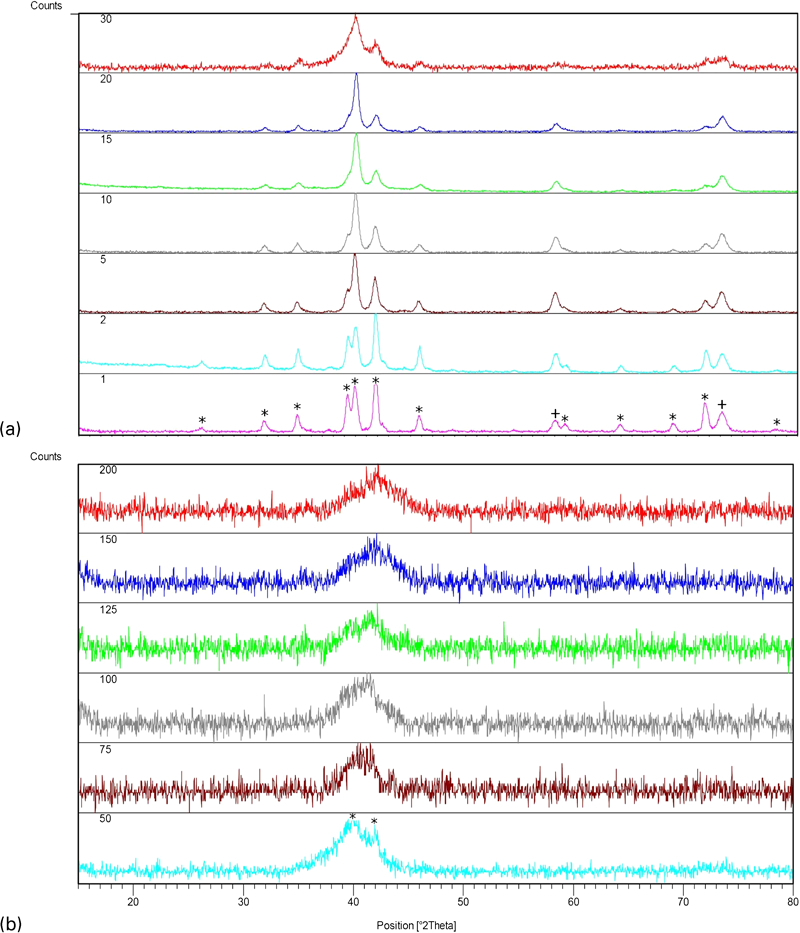
In order to produce the WC phase with the same raw materials, 1 wt-%WC was used as an additive. The XRD patterns of the samples containing the primary WC are illustrated in Fig. 2. As it is observed in Fig. 2a, like the previous system, up to 50 h of milling, the phases were stable, and the only visible phases were W and Fe3W3C. Similar to the previous system, one can see that by increasing the time of milling, the broadening of the peaks was increased slightly. As expected, since the mass adsorption coefficient of WC is smaller than W (MACWC = 161·78 cm2 g−1), the intensity of the peaks and consequently the area under the peaks of the specimen containing WC were smaller than the first system. Moreover, as shown in Fig. 2b, milling up to 50 h could lead to the synthesis of monocarbide tungsten partially with primary Fe3W3C at 75 h of milling time. By increasing the milling time to 125 h, Fe3W3C peaks were eliminated completely, and iron peaks appeared in the form of ferrite. This process continued until 200 h of milling time, where WC and α-Fe existed in the pattern. This phenomenon can be attributed to the following causes. The formation of tungsten carbide from tungsten and carbon can be divided into three stages: nucleation, growth of these nucleation (grain growth) and finally grains reaching each other and stopping their growth. In the system containing WC, it can be said that all or part of the first mentioned stage has happened, so the transition time of raw materials to products should have been reduced.26 The presence of the ceramic phase accelerates the rate at which the milling process reaches completion. Therefore, the presence of WC particles increases local deformation, which improves the particle welding process. In addition, the higher local deformation imposed by reinforcement particles increases the deformation hardening, which itself helps the fracture phenomenon. The small hard brittle particles in the matrix act as small milling agents, which leads to reducing the steady state milling time.27
X-ray diffraction pattern samples containing ferrotungsten, carbon and tungsten carbide at a 1–30 h and b 50–200 h (*: Fe3W3C; +: W; ˆ: WC; \/: Fe)
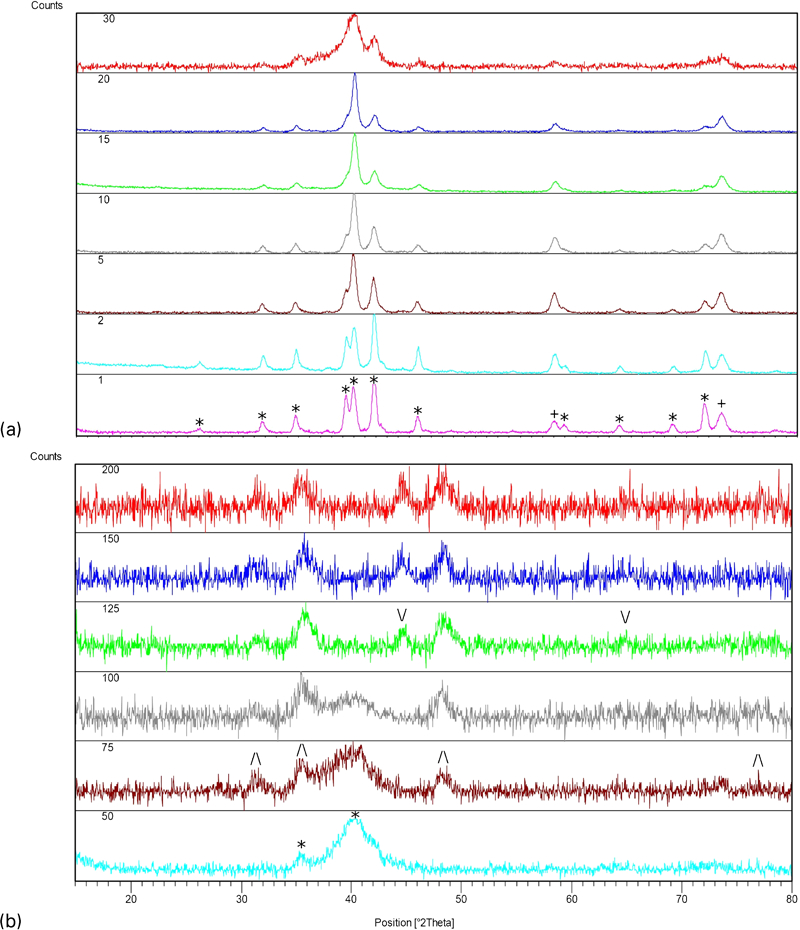
The amount of visible phases can be estimated from the XRD patterns in Fig. 2b and also from xpowder (version 2004·04·45 pro.) software. This analysis in XPowder works on the basis of the reference intensity ratio values. It determines the estimated mass fractions of the identified phases. This method is known as the normalised reference intensity ratio method. The normalisation used in this method assumes that the sum of all the identified phases is 100%. This means that there are neither unidentified crystalline phases nor an amorphous phase present in the sample. The ratios of the amount of iron/tungsten carbide in the system containing primary WC were 0·6772, 1·1008 and 1·2272 at 125, 150 and 200 h of milling time respectively. According to the ratio of iron/tungsten in primary ferrotungsten (Table 1), the maximum of this ratio can be 0·2609. In other words, if all of tungsten reacted with carbon, the percentage of WC and Fe in the final component would be 70·31 and 20·60 respectively. As can be seen, this ratio has grown sharply, which indicates an inclement wear in milling cup and the entrance of iron from balls and into raw materials. The amount of iron in each system calculated by ICP is illustrated in Fig. 3. As expected, by increasing the milling time, the amount of the entered iron into both systems is enlarged. Regarding Fig. 3, two points are significant. First, in the system containing WC, the rate of wear is higher than the first system, which can be attributed to the high hardness of WC in the primary component. Second, in each system, the ascending slope of iron amount is almost uniform, but in system containing primary WC, after 50 h of milling time, the slope showed a sudden rise, and this trend remained unchanged in longer milling times. It can be attributed to the gradual production of WC, and it increased the wear rate in the system until the milling time of 200 h, at which the amount of iron rose to 56 wt-%. Comparing these amounts with the numbers obtained by the XRD peaks shows a difference in the results (the ICP results are higher than the XRD ones). This difference may be due to the amount of iron dissolved in the tungsten carbide network. Iron atom is smaller than tungsten atom (RW = 2·020 Å and RFe = 1·720 Å). The solution of iron in carbide tungsten network and the partial replacement of iron atoms in the tungsten locations make the network compacted, and according to Bragg's equation, X-ray is diffracted at higher angle (or higher sin θ). In other words, all the peaks are shifted to higher angles. This treatment is shown in Fig. 4. For the determination of the synthesised WC unit cell parameters, peaks of (100) and (101) were used. In Fig. 5, the Nelson–Riley curve is illustrated. In order to eliminate the XRD instrument error, a standard sample was prepared from the WC that was used as the addition to the raw materials. The crystallographic information of these materials is listed in Table 2. As can be seen in the table, increasing the milling time resulted in a decrease in the lattice parameters a and c and the volume of unit cell, indicating the fact that iron atoms were situated in the tungsten location in the carbide network. The amount of solved iron in WC can be calculated by Vegard's law.24 In this method, the volume change resulted from the replacement of all the solved atoms instead of solvent atoms. The basic system with an ideal system is assumed, and a linear equation determines the change in volume caused by the amount of solved atoms in the solvent network. Since, unlike the h-WC phase, h-FeC does not exist, graphical methods (AutoCAD version 2007) and crystallographic relations were utilised to determine the unit cell parameters of h-FeC. The results are shown in Fig. 6a. Using Fig. 6b, the equation demonstrating the volume change as a function of the amount of solved iron in the WC network is

Changes in iron amount versus milling time in different samples
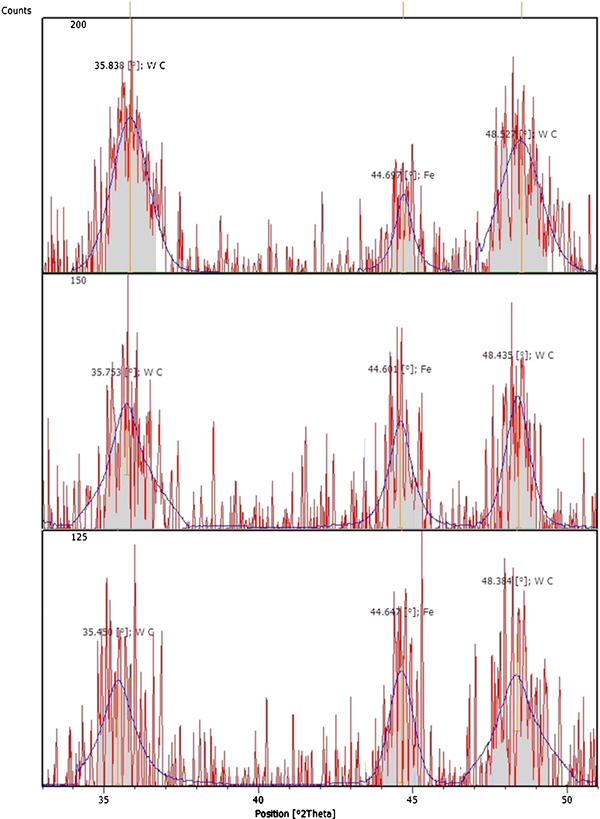
Fitted curve on XRD pattern samples containing WC and shifting of these peaks at 125, 150 and 200 h of milling time
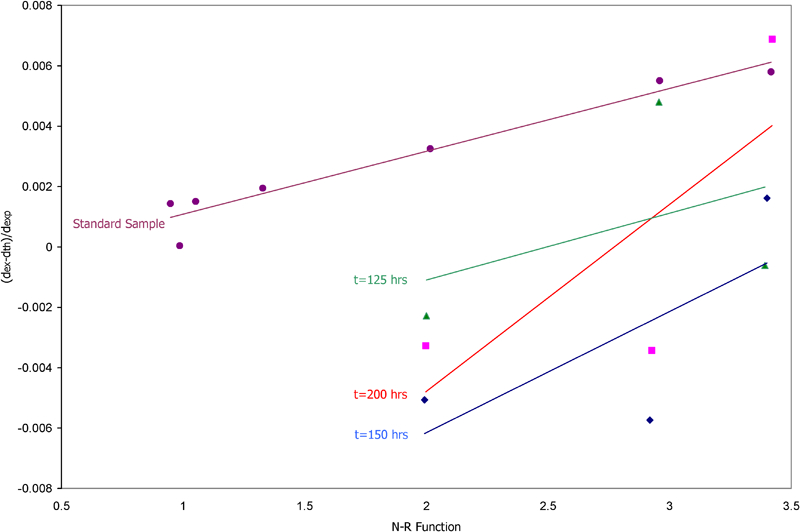
Changes of fractional error in lattice spacing d versus Nelson–Riley function
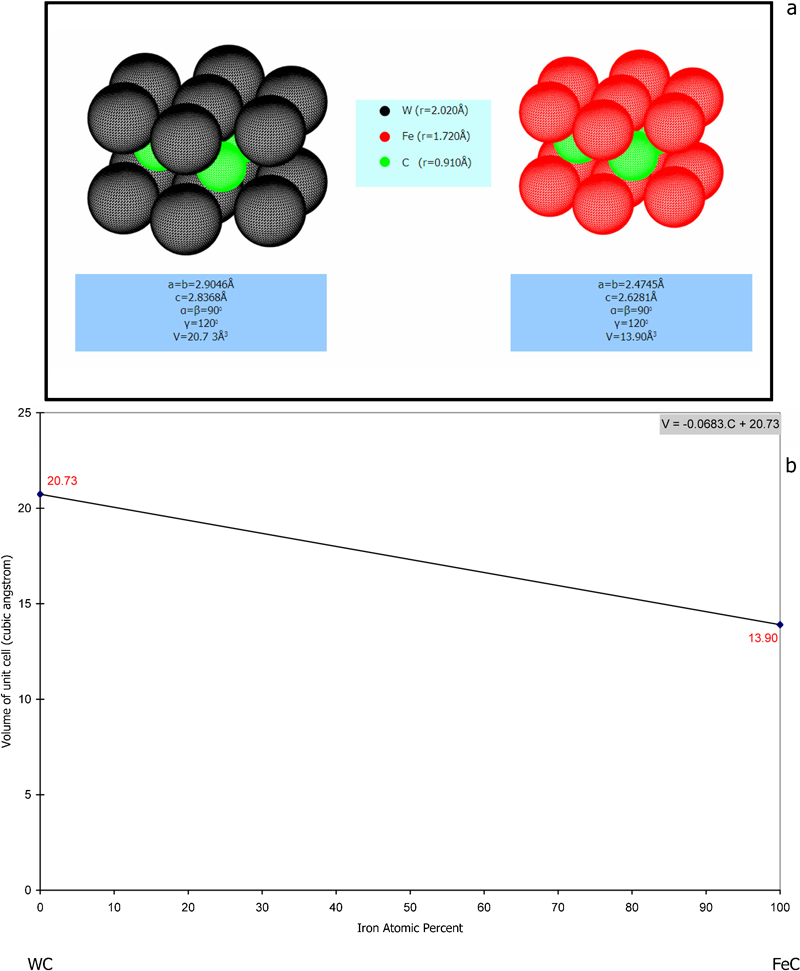
a graphical determination of unit cell parameters in h-WC and Fe–WC systems and b Vegard's law curve for determination of solved iron amount in WC network
Unit cell parameters, volume cell of tungsten carbide, crystalline size and mean strain in system contains primary WC
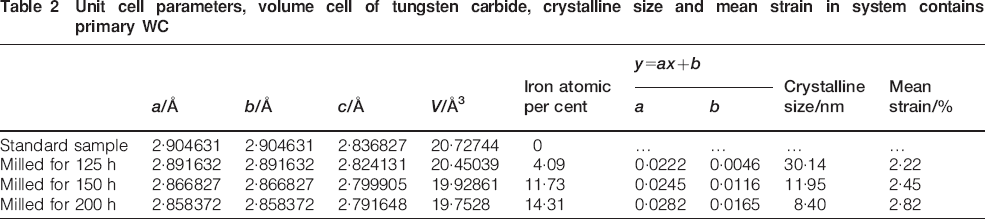
Figure 7 shows the SEM images of the sample with primary WC milled for different times. The milled powders after 1 h (Fig. 7a) contain very large particles. The particle sizes decrease with increasing milling time. These agglomerates consist of very fine particles that are cold welded together due to the very hard plastic deformation. As the milling time increases, the powder particles become finer and more homogeneous in their sizes. Finally, as seen in Fig. 7d, the powders have very small size and narrow range of distribution.
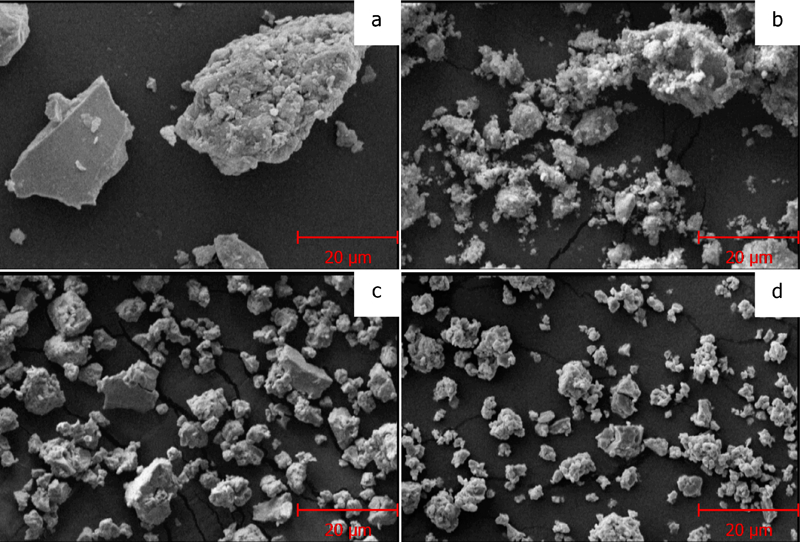
Morphological evolutions of ball milled powders for a 1 h, b 5 h, c 50 h and d 200 h in sample with primary WC
In Fig. 8, the Williamson–Hall curve for the determination crystalline size and mean strain of synthesised WC phase is shown. The results of this figure are listed in Table 2. As can be seen in Table 2, this carbide had a nanometre scale (8–30 nm), and by increasing the milling time, the crystalline size is reduced, and the mean strain is increased. The TEM microstructure of the sample with primary WC milled for 200 h is presented in Fig. 9. This micrograph also confirms the nanometre scale of the particles. In addition, it confirms the results of the Williamson–Hall method. Since the synthesised tungsten carbide with iron had very small crystalline size and high thermodynamic stability, this material can be used as a master alloy in the iron matrix to improve the mechanical properties.21
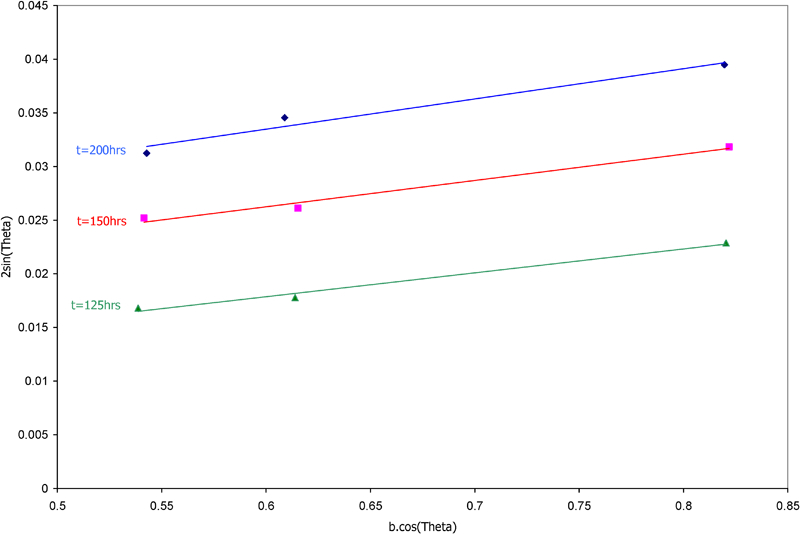
Williamson–Hall curve for determination of crystalline size and mean strain of synthesised WC phase
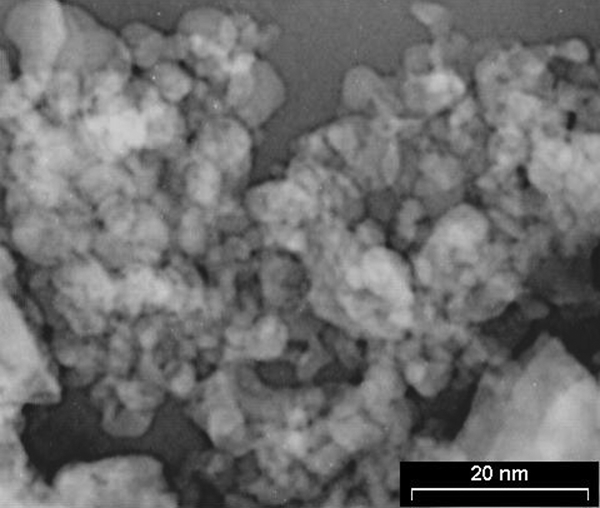
Image (TEM) of sample with primary WC milled for 200 h
Conclusion
The WC reinforced iron based nanocomposite was successfully produced from industrial ferrotungsten and carbon black with 1 wt-% tungsten carbide via MA after 125 h of milling time. This achievement was not attained in the system without primary WC addition. This phenomenon can be attributed to the introduction of WC, which acted as small ball mills that help the milling process. The existence of primary WC as small nucleation could be another reason for this phenomenon. By increasing the milling time, the amount of iron was increased as well. The rate of this amount was intensified after the appearance tungsten carbide in the system containing primary WC. Some of this iron was dissolved in the carbide network, and the rest was free. In addition, by increasing the time of milling, the synthesised carbide crystalline was fine and in the nanometre scale (8–30 nm), and the mean strain of the system was increased, which can be attributed to the deformation of networks and errors in the calculations of the amount of solved iron in the carbide system.