
Abstract
Magnetic ceramics of the type of spinel nanoferrites of Co1−xCuxFe2O4 with Cu concentrations of x = 0·00, 0·25, 0·50, 0·75 and 1·00 were prepared by chemical co-precipitation method. X-ray diffraction results confirmed the formation of a single spinel ferrite structure with crystallite size in the range of 20–63 nm. Scanning electron microscopy and EDS were used to study the morphological and compositional changes taking place with varying Cu concentration. DC electrical resistivity, activation energy and drift mobility are strongly influenced by both Cu concentration and temperature. Resistivities of the prepared magnetic ceramics were found to decrease with the increase in Cu concentration to follow Verwey mechanism. The semiconductor behaviour of the prepared nanoparticles was confirmed from the standard Arrhenius relation of resistivity versus temperature. The dielectric constants were measured in the frequency range of 100 Hz–3·0 MHz and are explained by the Maxwell–Wagner interfacial type of polarisation.
Introduction
Ferrites are magnetic ceramics containing complex oxide materials with the formula MFe2O4, where M is the divalent transition metal cation or a combination of divalent metal cations, such as Fe, Co, Cu, Mn and Ni.1 An important class of magnetic ceramics is known as spinel ferrites, which possess unique physical, spectroscopic, electrical and magnetic properties. These properties arise from the distribution of metal cations of various oxidation states, i.e. from the available tetrahedral sites (ST) and octahedral sites (SO) in the spinel lattice.2 Although spinel ferrites are well studied materials, with the advent of nanotechnology, interest is renewed to synthesise a wide range of nanosize particles as well as study their structural, electrical and magnetic properties.3, 4 Conventionally, preparation of such ferrites is carried out by solid state physical reaction method such as mechanical activation, mechanochemical synthesis and mechanical alloying.5 In the physical procedure, oxides or carbonates are mixed by grinding followed by annealing at the high temperature of ∼1500°C.6 This process has limitations, such as reliability, requirement of high reaction temperature, larger particle size, heterogeneity and requirement of more time. On the other hand, solution based processes in aqueous and non-aqueous media such as sol–gel, hydrothermal/solvothermal, sonochemical microemulsion and co-precipitation can yield nanocrystalline ferrite particles with good homogeneity and stoichiometry.7, 8 Among these techniques, chemical co-precipitation method perhaps offers many advantages over others due to its relatively simple reaction procedure, lesser cost, better homogenous mixing of constituents and good control over the stoichiometric compositions, microstructures, density, void free, particle size and shape and chemically stable characteristics.9, 10 Transition metal ferrite nanoparticles with a wide variety of compositions, ranging from ternary metal oxides to mixed metal oxides containing two or even three different divalent metal ions, have been prepared using the co-precipitation technique.9, 10 Several investigators including our research group have employed co-precipitation method to develop a variety of nanostructured ferrites.11, 12 Current work is also a continuation of our previous research efforts and describes in detail the synthesis by co-precipitation and compositional, structural, and electrical characteristics of nanosize particles of Co1−xCuxFe2O4 spinel ferrites of varying Cu concentrations with x = 0·00, 0·25, 0·50, 0·75 and 1·00.
The work reported here is important and novel in many aspects. First, there are recent reports that describe the use of magnetic ceramics of ferrites based on a combination of Cu and Co as catalyst.13 For example, CoFe2O4 has been reported to catalyse the decomposition of H2O2 that is comparable to the highly powerful catalysts of the type Pt and Pd.14 We synthesised ferrites by relatively low temperature co-precipitation methods to attain homogeneous nanosize particle. The preparation conditions employed in this work are typically well suited to attain high catalyst efficiency and thus can assist the other researchers working to explore their use as active and effective materials for heterogeneous catalytic processes in various important applications.15–17 Second, ternary spinel structures like Co1−xCuxFe2O4 are quite vulnerable during the synthesis process since the Fe ions can be rearranged between its tetrahedral sites (ST) and octahedral sites (SO).2 Moreover, the lack of specific site preference of both Co2+ and Cu2+ ions can result in an inverse or a partially inverse spinel, which leads the distribution of all the three ions among tetrahedral or octahedral sites in a quite complex manner.18 Finally, among the widely studied ferrites are those which contained the combination of Co or Cu with Zn. In the development of such ferrites, Zn was added into Co and Cu ferrites to develop Co1−xZnxFe2O4 or Cu1−xZnxFe2O4 ferrites for a wide range of applications in microwaves, radio wave frequencies and ferrofluids in order to achieve a compromise between magnetically hard particles and low Curie temperature in the materials.19, 20 It is also worth to mention that in most of the previously published work, the properties of binary CuFe2O4 and CoFe2O4 ferrites have been reported.21, 22 Such binary ferrites are known to possess high resistivity, permittivity and low losses, which are typically required in microwave devices.1–4, 23–26 Contrary to above, the combination of Cu and Co to develop Cu–Co spinel ferrites has not been investigated much in terms of their detailed synthesis, structural, electrical and dielectric properties to the best of our knowledge. Thus, an investigation of Cu–Co spinel nanoferrites would be of interest in order to study the influence of Cu and Co ions on the typical physical characteristics. Thus, it is in those contexts mentioned above that a detailed investigation on the synthesis, structural, electrical and dielectric properties of a series belonging to Co1−-xCuxFe2O4 assumes significance. Research work to understand the properties of a whole composition series of Co1−xCuxFe2O4 (with x = 0·00, 0·25, 0·50, 0·75 and 1·00) would thus assist to understand how the characteristics of these ferrites are determined by the presence of varying ratios of metal ions of Cu and Co, and to explore and attain improved characteristics for novel applications, including catalysis and microwave devices.
Experimental
Synthesis
Chemical co-precipitation method was used to synthesise samples of a series of Co–Cu ferrites Co1−xCuxFe2O4 (with x = 0·00, 0·25, 0·50, 0·75 and 1·00). All the used reagents were of analytical grades and used as received. As an example, the general procedure to synthesise ferrites of composition Cu0·5Co0·5Fe2O4 (x = 0·50) is given below. The stoichiometric/reagent ratios of 0·05M of Cu(NO3)2.1/2 H2O and 0·05M of Co(NO3)2.6H2O and 0·2M of Fe(NO3)3.9H2O were employed for x = 0·50. Separate solutions of these reagents were prepared in 100 mL deionised water. This was followed by mixing the prepared solutions in a beaker and then heating it for 30 min at 80°C with constant magnetic stirring until a clear solution was achieved. To this salt solution, an aqueous solution of 3M NaOH was added as co-precipitating agent. A rapid mixing of co-precipitating agent in metal solution was made to obtain relatively smaller particle size with improved monodispersity and chemical homogeneity. Temperature was kept at 85°C to transform metallic hydroxide into ferrites. Both solutions after mixing were heated and stirred for 30 min, followed by stoppage of heat with constant stirring for another 90 min at a basic pH value of ∼11. The resultant precipitates were washed several times with water and subjected to overnight drying at 110°C to yield a black coloured powder of ferrites. Similar procedures were adopted by changing the stoichiometric amount of salts to obtain nanoferrites of desirable compositions. Dried powders of synthesised ferrites were sintered in a furnace for ∼8 h at 800°C under ambient conditions. The sintered samples were removed from the furnace by cooling it at 15°C min−1.
Analyses and characterisations
The properties of the prepared nanoferrites of Co1−xCuxFe2O4 (with x = 0·00, 0·25, 0·50, 0·75 and 1·00) were studied using different techniques. The thermal characteristics of the prepared ferrites, such as weight loss and enthalpy changes, as a function of temperature were studied. A representative sample of Co0·5Cu0·5Fe2O4 (x = 0·50) was subjected to thermal gravimetric analysis–differential thermal analysis (TGA-DTA) analysis using a PerkinElmer Diamond TG/DTA. The sample was heated from room temperature of 25°C up to 900°C at a rate of 5°C min−1 using pure alumina as reference material. Analysis was carried out under inert atmosphere of N2 to avoid any undesirable reactions, which may occur in the presence of ambient conditions. Structural and related characteristics of the prepared ferrites were determined by X-ray diffraction (XRD) using a Stoe diffractometer with Cu Kα (λ = 1·5406 Å) radiation at room temperature. For the experiments, circular shape discs of samples were fabricated after application of uniform load on the samples with the aid of a hydraulic press. From the XRD data, the mean crystallite sizes were estimated using the standard Scherrer equation, and retrieved refinement analysis was then performed to obtain the lattice constants a. Standard relationships were used to estimate the average crystallite size, measured density ρm and XRD density ρx.14, 27, 28 Scanning electron microscopy (SEM), JEOL JSM 6490A, was used to study the morphology and nanostructure of the prepared nanoferrites. The chemical compositions and atomic ratios among Fe, Co and Cu of the individual particles in the sintered powders were determined using an SEM (JEOL JSM 6490A) equipped with an energy dispersive spectrometer (EDS) at 300 kV. Circular discs of prepared ferrites were sputtered with gold coating in a custom made set-up assembly to overcome the high resistivity of samples to perform SEM analyses.
The electrical and dielectric parameters of the prepared ferrites were calculated using standard relationships. A custom made two-probe set-up was used to measure the dc electrical resistivity ρdc in the temperature range of 300–575 K for the prepared Co–Cu nanoferrites. Disc shaped samples of 8 mm diameter and 3 mm thickness were subjected to analyses using a commercial LCR meter and resistivity apparatus model, BHV-50, Riken Denshi Co. Ltd Japan. Arrhenius relation was used to obtain the dc electrical resistivity ρdc and activation energy ΔE in accordance to the following relation29,
30
Drift mobility μd was calculated using the standard relationship given below30

The dielectric constants ϵ′ were measured in the frequency range of 100 Hz to 3·0 MHz at room temperature in accordance to the standard relation.14 For this purpose, circular discs from the nanoferrite powder were made followed by silver coating on adjacent faces to obtain the parallel plate capacitor geometry with the sample materials as the dielectric medium. Discs were analysed using a Wayne Kerr LCR Meter (Model 6440B), i.e.

The dielectric loss tangent (tan δ) was measured directly as a function of frequency at room temperature of 300 K using the relationship31

Results and discussion
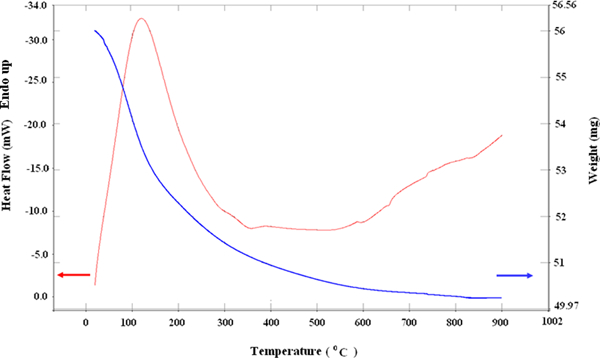
Results of the characteristics of the various compositions of magnetic ceramics of Co1−xCuxFe2O4 nanoferrites are given in Table 1 and discussed below.
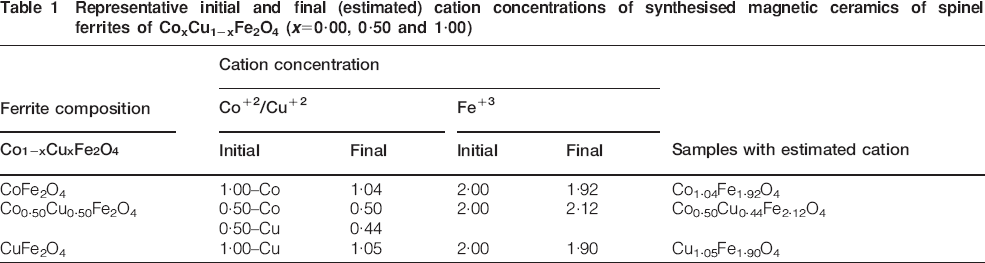
Representative initial and final (estimated) cation concentrations of synthesised magnetic ceramics of spinel ferrites of CoxCu1−xFe2O4 (x = 0·00, 0·50 and 1·00)
Differential thermal analysis–thermal gravimetric analysis
Figure 1 represents the DTA-TGA thermogram in the temperature range of 25 to 900°C of a representative samples of Co1−xCuxFe2O4 with x = 0·50. It shows the amount and rate of change in the weight of the prepared sample of ferrite as a function of temperature in a controlled and inert atmosphere of N2 to get its thermal stability up to a specific high temperature and determine the weight loss or gain due to loss of water, nitrates, hydroxyl groups, decomposition, or oxidation. The loss in weight of the sample as temperature rises is also congruent with the endothermic band depicted in the DTA thermogram. It was observed that weight of sample decreased from original weight of 56 to 50 mg, which correspond to ∼9% loss in the weight. Thermogram shows specific enthalpy change ΔH of reaction +641·6967 J g−1, which was the amount of heat absorbed by the sample because products of the reaction have a greater enthalpy than the reactants. The peak at 125°C which is accompanied with highest weight loss in the sample is probably due to decomposition of the metal hydroxides, nitrate precursor and dehydration. Different nitrate salts were used and probably some remained within the sample. In addition, elimination of hydroxide used as precipitant and dehydration may have also contributed to the loss in weight. Presence of such precursors has been reported in literature despite making efforts to obtain highly purified samples.32
Representative DTA/TGA thermogram of Co1−xCuxFe2O4 (x = 0·50) ferrites prepared by co-precipitation method: sample was heated at rate of 5°C min−1 in atmosphere of N2
Structural studies
Figure 2 shows the indexed XRD patterns of the prepared sintered samples of Co1−xCuxFe2O4. The formation of a cubic spinel structure in the diffractograms confirmed the presence of planes (220), (311), (422), (440) and (511). All the prepared Co1−xCuxFe2O4 nanoferrites exhibit a single phase spinel structure, and the peaks in the patterns matched well with the characteristic reflections of Co and Cu ferrites, as described elsewhere.14, 29–33 The nanocrystallite sizes of the synthesised ferrites indicated their broad peaks in the XRD. Scherrer formula was used to obtain the average crystallite size of the sintered particles for each composition. For this purpose, half peak width at maximum for all the observed peaks was obtained, and then the average particle size of all the peaks of the sample was obtained.34 The crystallite size was found to be in the range of 20–63 nm. The calculated lattice constant a revealed the cubic spinel structure of the prepared samples. Using standard relationships as mentioned earlier in the experimental section, XRD data were used to estimate the average crystallite size t (311), X-ray density ρx and porosity P. Table 1 summarised the values of these parameters of Co1−xCuxFe2O4 for various Cu concentrations x. It is observed that the average crystallite sizes t (311) and lattice constants a were found to decrease with the increase in Cu concentration x. These observations can be attributed to the larger ionic radius of Co2+ (0·82 Å) as compared to that of Cu2+ (0·73 Å).35 The larger ionic radii of Co are replaced by the smaller ionic radii of Cu, which subsequently produced a reduction in the values of lattice constant a with increase in Cu concentration x. In accordance with Vigard's law, the interplanar spacing decreases due to the effect of smaller cation substitution by the larger cations. This observation is in good agreement with other studies of ferrites where larger metal ions have replaced relatively smaller metal ions to produce an increase in their particles size.13, 36 It is important to mention that the particle size variation in going from x = 0·00 to x = 1·00 is 20–63 nm, which is quite noticeable. There is no clear explanation to this observation at the moment. It is possible that various factors, such as differences in ionic radii discussed above as well as subtle variations of synthesis conditions, may have contributed despite making every efforts to prepare ferrites under similar conditions. For example, the particle size difference may be influenced by the speed of mixing of salt with co-precipitating reagent. If the co-precipitating reagent is mixed rapidly, then this can cause smaller particle sizes, while if it is mixed rather slowly, then this may result in relatively larger ionic radius because of the nucleation process.
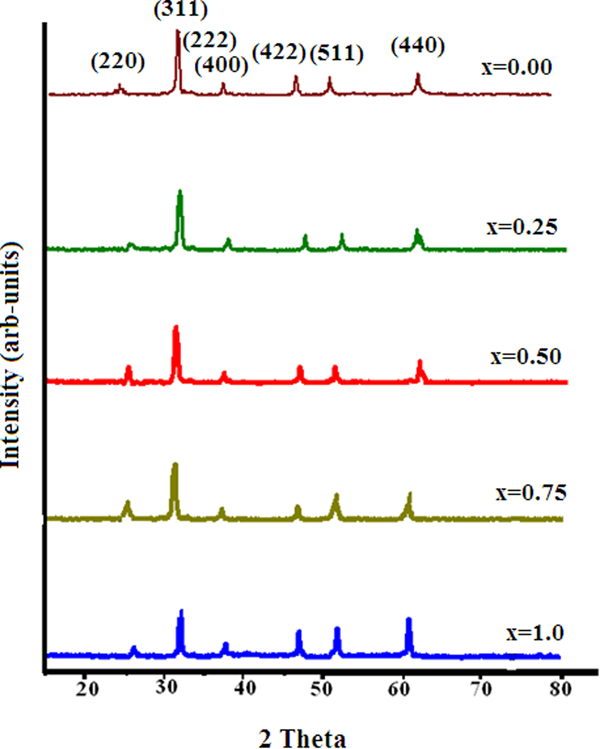
Indexed XRD patterns of cubic spinel ferrites of Co1−xCuxFe2O4 (x = 1·00, 0·75, 0·50, 0·25 and 0·00)
Both the measured density ρm and the X-ray density ρx were estimated to study their effects on the composition of the prepared ferrites. The ρm values were calculated from the simple relation of mass m over volume v, i.e. ρm = m/V. The values of ρm and ρx are given in Table 2 and found to increase in the prepared nanoferrites with Cu concentration x. This observation is again in agreement with studies of ferrites in which different metallic precursors were used. The atomic mass of Cu (63·546 amu) is comparatively larger than Co (58·930 amu), which subsequently affects the density as the increase in mass, which overtakes the decrease in volume of the unit cell.
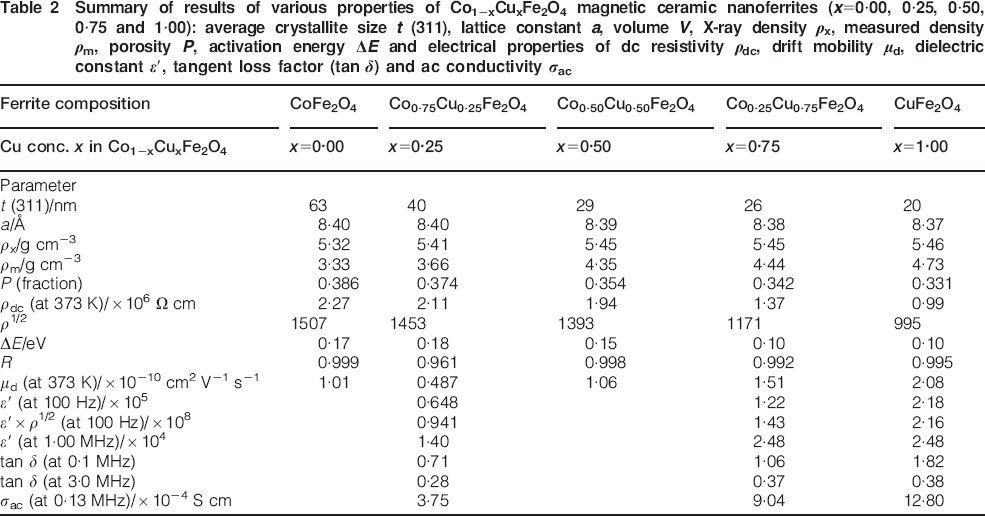
Summary of results of various properties of Co1−xCuxFe2O4 magnetic ceramic nanoferrites (x = 0·00, 0·25, 0·50, 0·75 and 1·00): average crystallite size t (311), lattice constant a, volume V, X-ray density ρx, measured density ρm, porosity P, activation energy ΔE and electrical properties of dc resistivity ρdc, drift mobility μd, dielectric constant ϵ′, tangent loss factor (tan δ<1/emph>) and ac conductivity σac
The porosity P of prepared nanoferrites was studied from consideration of its relation with Cu concentrations x in Co1−xCuxFe2O4 ferrites. Figure 3 presents the influence of varying Cu concentrations x on the porosity P and the X-ray density. It is observed that the porosity of nanoferrites decreases while the X-ray density increased with the increase in Cu concentration x in Co1−xCuxFe2O4. This observation is attributed to the larger ionic radius of Co compared to that of Cu.35 In addition, porosity is also affected by the grain boundaries in the particles, and its magnitude decreases as the particle size and surface area reduced with the increase in x. The decrease in porosity in return can lead to the increment in density with the increase in x value.
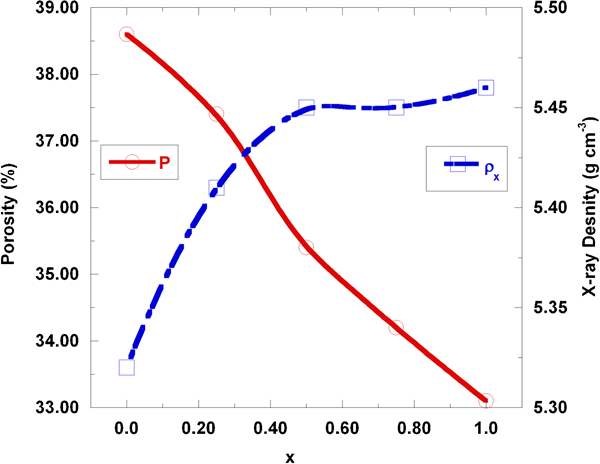
Variation in porosity P and X-ray density ρx of magnetic ceramics of Co1−xCuxFe2O4 nanoferrites
Morphological and compositional studies
The morphology and microstructure of nanoferrites were studied by SEM as it can provide direct information about the structure and morphology of the particles. Representative SEM microphotographs of Co1−xCuxFe2O4 with Cu concentration x = 0·50 are presented in Fig. 4. The SEM image of the sample was taken with ∼300 000 magnifications, which is the maximum value possible on this instrument. The micrographs indicate clusters of agglomeration of the particles as found frequently in such ferrites. Nonetheless, it seems that the samples possess spherical nanosize grains, and there are spheroids that appear large in size due to the agglomeration of particles.
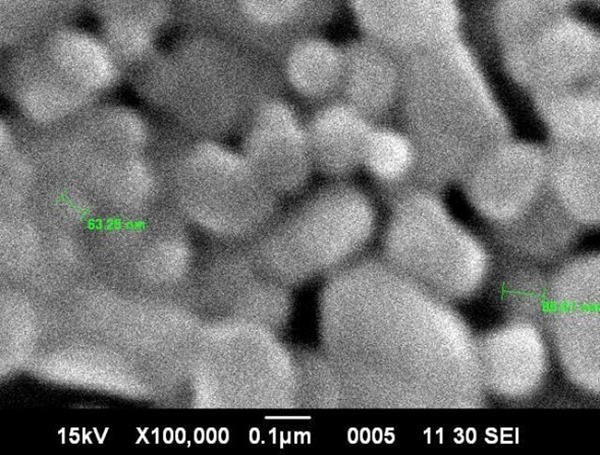
High resolution representative SEM of nanoferrites of Co1−xCuxFe2O4 with Cu concentration of x = 0·50
Scanning electron microscopy in combination with EDS was also carried out to perform chemical analysis to determine the compositions of the prepared ferrites. Representative SEM-EDS spectra of intensity versus energy of Co1−xCuxFe2O4 with Cu concentrations of x = 0·00 and x = 0·50 are given in Fig. 5. The SEM-EDS spectra of intensity versus energy allow us to evaluate the data to obtain the relative percentage of each element present in the prepared samples. Each element present in the samples gives a signal that appears at a unique energy level and is characteristic of that element, as shown in Fig. 5. The experimentally determined atomic ratios of atoms Fe, Co and Cu are found in close agreement with those expected to present stoichiometrically in the prepared ferrites, as indicated by the results summarised in Table 2. It is observed that for CoFe2O4 (x = 0·00), the atomic ratio of Fe∶Co, and for CuFe2O4 (x = 1·00), the atomic ratio Fe∶Cu are approximately twice. Similarly, in the case of Co0·5Cu0·5Fe2O4 (x = 0·50), the atomic ratios of Cu to Co are approximately similar, and Fe is again found to be approximately twice relative to their combined atomic ratio.
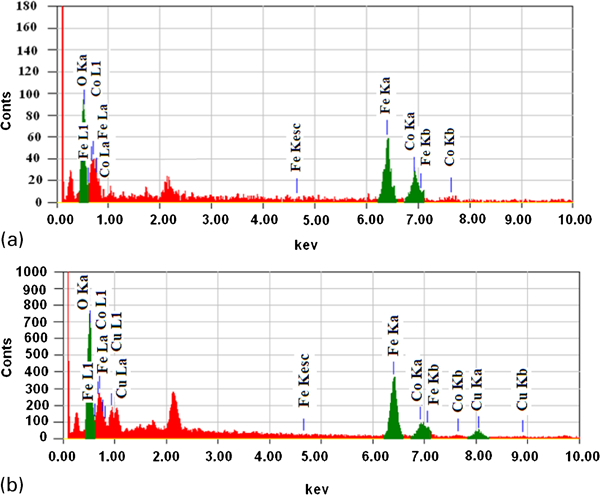
Representative SEM-EDS spectrums of intensity versus energy of Co1−xCuxFe2O4 with Cu concentrations of a x = 0·00 and b 0·50
Electrical and dielectric properties
DC electrical resistivity ρdc and drift mobility μd
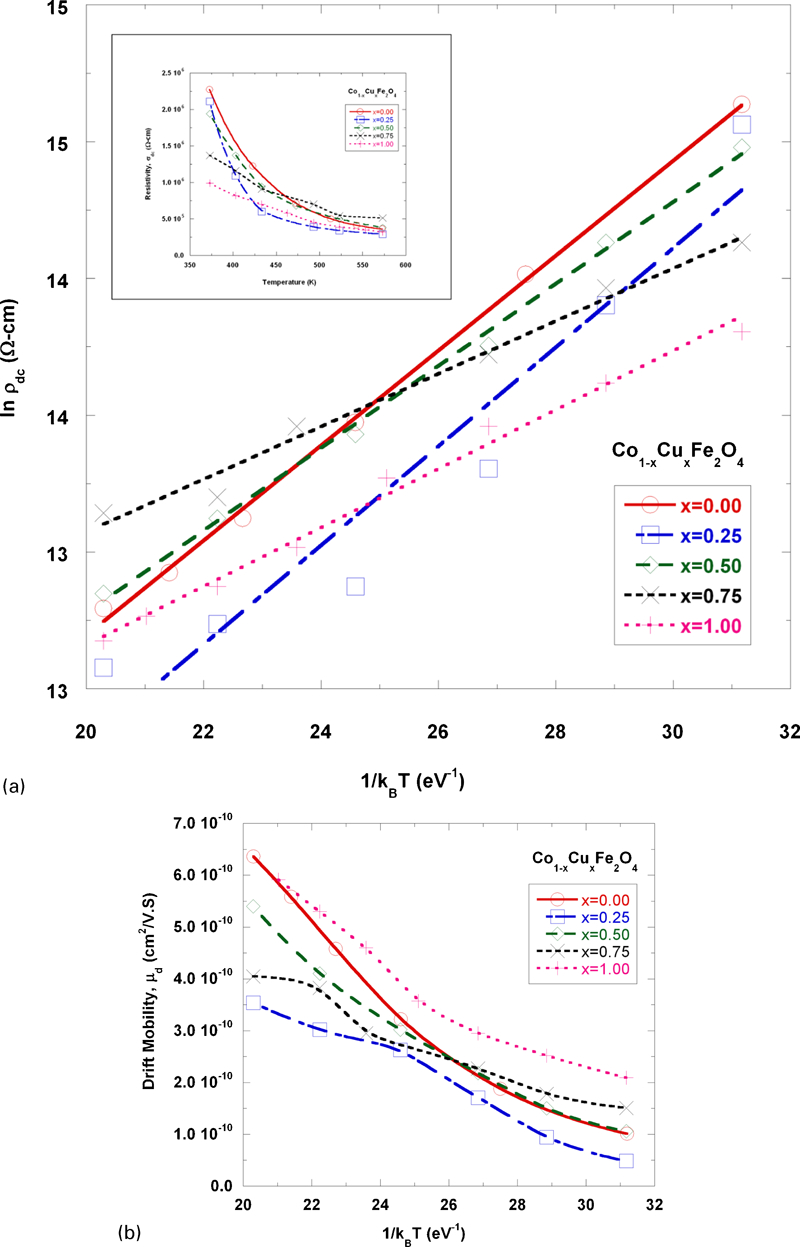
The electrical properties of Co1−xCuxFe2O4 ferrites were investigated in the temperature range of 300–575 K. Figure 6a shows the dc electrical resistivity ρdc behaviour of the prepared ferrites as a function of 1/kBT and temperature. From the slopes of the linear plots of ln ρdc against 1/kBT, values of activation energy ΔE were also determined using equation (1). Table 1 summarised the ΔE values, and it is observed that materials having higher conductivity exhibit lower activation energy and vice versa. The values of ΔE in ferrites depend on the charge carrier mobility localised at the ions or vacant sites to give electrical energy in order to overcome the barrier experienced by the electrons during the process of conduction hopping mechanism.37
Electrical properties of nanoferrites of Co1−xCuxFe2O4 (x = 0·00, 0·25, 0·50, 0·75 and 1·00):
Figure 6a also indicates that the resistivity ρdc decreases with the increase in temperature and therefore confirmed the semiconductor characteristics in the prepared nanoferrites.38 This observation is explained in accordance to the conduction mechanism of the hopping of electron. In this mechanism, temperature influenced the charge carrier mobility, and the bandgap between the conduction band minima and the valence band maxima is determined by the nature of dopant at a particular temperature. It is observed that incorporation of Cu in the prepared nanoferrites resulted in the decrease in resistivity as the x content increases. The results obtained are in good agreement with other studies reported previously, which indicated that addition of Cu produced reduction in resistivity while the increase in Co concentration resulted in enhancement of resistivity.14,
33,
39 The variation of ρdc in Co1−xCuxFe2O4 ferrites is attributed to the electron hopping between Fe+2 tetrahedral (A-site) and Fe+3 at octahedral site (B-site) in accordance to the Verwey mechanism.40,
41 Increase in conduction is observed if the cations promote the increment in transition between tetrahedral and octahedral sites. Considering above, the increase in Cu concentrations to produce a decrease in dc resistivity ρdc can be attributed to the presence of relatively higher extent of hopping of electron between
 at the tetrahedral (ST or A-site) and octahedral sites (SO or B-site).
Drift mobility μd of the prepared samples has been investigated to further understand the conduction mechanism since it is a proportionality factor between drift velocity of charge carriers in a semiconductor and electric field. The plots of μd with 1/kBT are shown in Fig. 6b for various Cu concentrations x in Co1−xCuxFe2O4. The increase in values of μd with temperature was observed. This can be attributed to the enhancement of charge carriers, which start hopping from one site to another site by the increase in temperature, as explained above in the case of hopping conduction mechanism.37
Dielectric constant ϵ′ and dielectric tangent loss tan δ
The term ‘dielectric’ is generally used to describe the behaviour of a material with high polarisability to express by a number called the dielectric constant ϵ′. Materials with low dielectric constant are preferred for high frequency applications. Figure 7 exhibits the usual dielectric behaviour of ferrites as reported elsewhere.14,
27,
28 It is observed that the ϵ′ values decrease as the applied frequency increases, the dispersion in ϵ′ values is significantly high at lower frequency as compared to higher frequency and at higher applied frequency, the variation in ϵ′ values becomes smaller to exhibit almost independent behaviour. The observed ϵ′ results indicate the complex contributions of synthetical, compositional, structural and morphological factors such as size of particles, temperature used for sintering, distribution of cations along with the ratio of Fe2+/Fe3+ ions and vacancies in lattices to determine the dielectric characteristics of ferrites. Maxwell–Wagner interfacial type polarisation along with Koop's phenomenological theory is useful to explain the ϵ′ dispersion as a function of frequency.42–44 The theory predicts that the dielectric structure in ferrite is made from bilayers with first layer function as a conducting layer of large grains and second layer function as a poor conductor of grain boundaries. Furthermore, the grain boundaries are more effective than grains in the electrical conduction at lower frequencies because of the presence of Fe2+ ions, vacancies and interfacial dislocation pile-ups, as supported by dielectric studies of other ferrites.
14
27
14,27,28 The exchange of electron between tetrahedral and octahedral sites of the type
 takes place to produce local displacement of electron in the direction of applied frequency field to determine the polarisation and hence ϵ′ values in ferrites. This is due to the reason that in ferrites, the mechanism of the polarisation process is considered identical to that in the conduction process in accordance to the conduction hopping mechanism. Both polarisation and ϵ′ values are expected to increase with the concentration of Fe2+ at lower applied frequency in the prepared ferrites. At a certain higher frequency, however, the electronic exchange between Fe2+ and Fe3+ ion cannot follow the alternating field with a subsequent reduction in ϵ′ values.45 In a dielectric medium, there is finite time available for the assembly of space charge carriers to orient their axes parallel to an alternating applied electric filed. If the applied frequency increased beyond a certain point, then the space charge carrier may not have sufficient time to able to align themselves with the field. If the applied frequency continues to increase further, then the space charge carriers cannot even get the chance to move before the field reverses and hence do not make any net contribution to the polarisation of the dielectric. Under such circumstances of high applied frequency, polarisation first decreases substantially and then reaches an approximately constant value as beyond certain higher frequencies of external field, the electron exchange
 is unable to follow the alternating applied electric filed, and thus, the material exhibits approximately constant values of ϵ′, as observed in the current work.
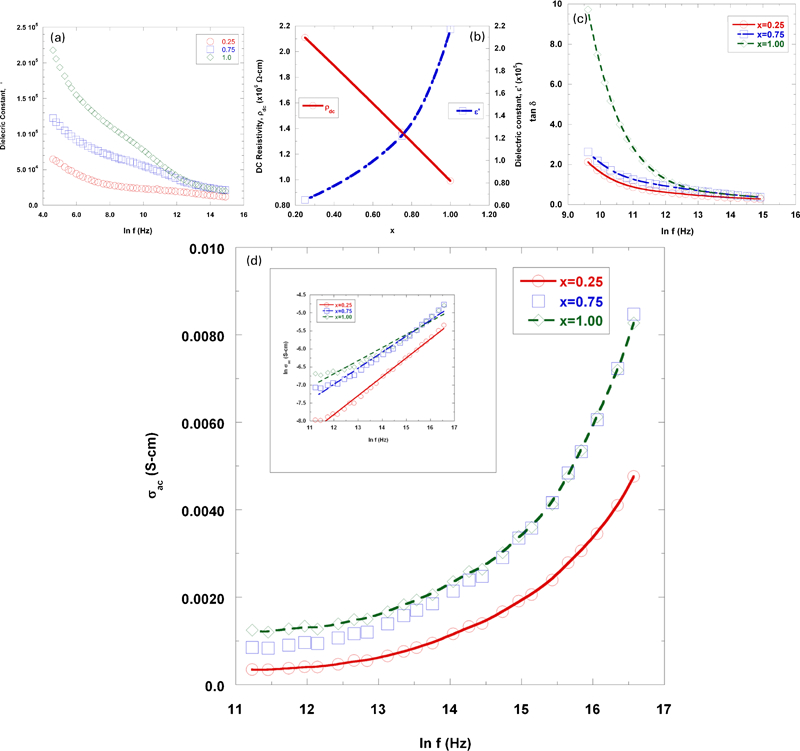
Dielectric properties of prepared spinel nanoferrites of Co1−xCuxFe2O4 (x = 0·25, 0·75 and 1·00): inset shows ln σac versus ln f plot of prepared ferrites:
The values of dc resistivity ρdc, its square root ρ1/2 and their product ϵ′×ρ1/2 are given in Table 1 along with the value of ϵ′. It is observed that ϵ′ is approximately inversely proportional to the square root of dc resistivity ρdc. A similar relationship between ϵ′ and ρ1/2 had been proposed for various ferrites, as described elsewhere.46, 47 It has been noted that the loss in dielectric in the case of ferrites can be reflected in their dc resistivity values; i.e. ferrites with high dielectric losses exhibit low dc resistivity and vice versa. Table 1 indicates that this observation holds well in the case of the present work on Co–Cu ferrites too. Figure 7b supports this correlation, as shown by the plot of dielectric constant ϵ′ versus Cu concentration x, which is an approximate inverse image to that of the dc resistivity versus Cu concentration x.
The tangent loss factor (tan δ) as a function of frequency was studied at room temperature of 373 K. Standard relation given in equation (5) was used to obtain tan δ values for Co1−xCuxFe2O4 ferrites. Figure 7c represents the representative variation of tan δ with frequency for x = 0·00, 0·75 and 1·00. The tan δ values are found to decrease with the increase in applied frequency and exhibit dispersion at lower frequency due to the Maxwell–Wagner interfacial type polarisation, in agreement with Koop's phenomenological theory, as discussed earlier.42–44 The change in tan δ is higher at low frequencies and smaller at high frequencies in the prepared ferrites. This is due to the fact that the decrease in tangent loss factor takes place when the jumping rate of space charge carriers lags behind the alternating electric field beyond a certain critical frequency. Furthermore, the dielectric behaviour and the conduction mechanism in ferrites are strongly correlated, and the conduction in ferrites is considered to be due to the hopping of
 electron between tetrahedral and octahedral sites. The variation of tan δ values thus shows the expected change with the applied frequency in accordance to the above mentioned considerations.
The ac conductivity σac of the prepared nanoferrites was also studied as a function of frequency f, as shown in Fig. 6d. For this purpose, the ac conductivity σac of the prepared samples was calculated at angular frequency ω from the dielectric constant ϵ′, dielectric loss tangent tan δ and permittivity of free space ϵo values using the relationship of σac = ωϵ0−ϵ′tan δ. The plots indicate that the σac values increase with the increase in frequency to exhibit the typical behaviour of ferrites in accordance to the electron and polaron hopping models.48 In ferrites, the frequency dependent conduction is mainly attributed to a small polaron type hopping mechanism.
Conclusion
Magnetic ceramics of the type of spinel nanoferrites of Co1−xCuxFe2O4 with Cu concentrations x = 0·00, 0·25, 0·50, 0·75 and 1·00 were successfully prepared by chemical co-precipitation method. The XRD confirmed the formation of single phase spinel Co–Cu ferrite structure with the size of particles in the range of 20–63 nm. The particle size, lattice constant a and porosity p were found to decrease while the X-ray density increased with increase in Cu concentration. These observations are attributed to the relatively larger ionic radii of Co2+ as compared to Cu+2. Scanning electron microscopy revealed the morphology and EDS confirmed the composition ratio of Fe, Co, and Cu in the prepared ferrites. Furthermore, studies of the electrical and dielectric properties indicate the typical behaviour of ferrites. Various electrical parameters, such as dc electrical resistivity ρdc, activation energy ΔE and drift mobility μd, were found to be influenced by substitution of Cu concentration and temperature. Resistivity values were found to decrease with Cu contents to obey Verwey mechanism, and the semiconductor behaviour was confirmed from the relation of resistivity variation as a function of temperature. Dielectric parameters like dielectric constant ϵ′ and dielectric loss factor tan δ values are reported in the frequency range of 100 Hz–3·0 MHz at room temperature. These parameters exhibit higher values and dispersions at lower frequencies, while they become almost independent at higher frequencies. These observations are explained from consideration of the hopping of electron exchange between
 tetrahedral and octahedral sites. At lower frequency, this conduction can follow electronic exchange, while at higher frequency, the electronic exchange between Fe2+ and Fe3+ ions cannot follow the alternating field with a subsequent reduction in ϵ′ and tan δ values.
Footnotes
Acknowledgements
The authors are thankful to Mr K. Akbar, Mr Z. Iqbal, Mr S. Ameer, Mr N. Ahmed and Mr Shmasudin from NUST for their support to carry out characterisation of the samples using XRD, SEM, EDS and DTA-TGA. The financial support of the Pakistan Science Foundation (PSF) through project no. 147 is also acknowledged.