
Abstract
Bi2Ba2Co2Ox thermoelectric (TE) ceramics have been grown from the melt using the laser floating zone method at different growth rates (15, 30 and 90 mm h−1). Microstructural analysis has shown an improvement of the grain alignment and a reduction of secondary phases when the growth speed is decreased. These microstructural features have been reflected in the TE performances, with a reduction of the electrical resistivity and, as a consequence, at significant increase in the power factor values, reaching ∼0·15 mW K−2 m−1 at 650°C for the samples grown at 15 mm h−1, which is much higher than the typical values obtained in these materials.
Introduction
Thermoelectric (TE) energy conversion has been shown to be an effective technology that can be used to transform directly thermal to electrical energy without moving parts or other dissipative systems. Nowadays, TE power generation technology is regarded as one of the most promising methods to harvest energy from different natural and/or waste heat sources. Furthermore, these materials can be also applied in classical energy transformation systems, improving their efficiency. Therefore, this promising technology would help to reduce CO2 emissions in energy generation. On the other hand, TE materials with high energy conversion efficiency are strongly required for electric power generation in order to be considered for practical applications. The performances of these types of materials are quantified by the dimensionless figure of merit, ZT, which is defined as TS2ρ−1κ−1 (where S is the Seebeck coefficient, T is the absolute temperature, ρ is the electrical resistivity and κ is the thermal conductivity). From this definition, it can be easily deduced that a high performance TE material should possess a high Seebeck coefficient (or thermopower), with low electrical resistivity and thermal conductivity.1
For the past two decades, intermetallic materials such as semiconductors, with high ZT, have been widely applied in various industrial and/or non-industrial sectors, e.g. automobile industry (mainly in the exhaust system). However, these materials have some drawbacks, such as low stability at high temperature, which can result in degradation, oxidation and/or evaporation of some constituent elements. Moreover, they are usually mainly composed of heavy and/or toxic elements (i.e. Sb, As and Te). This situation was changed in 1997 by the discovery of large TE properties in NaxCoO2.2 Since then, much work has been performed to explore new TE ceramic materials, especially in the CoO based families, with relatively high TE performances. This research has led to the discovery of new layered cobaltites, such as [Ca2CoO3][CoO2]1·62 and [Bi0·87SrO2]2[CoO2]1·82, with promising TE properties.3–7
The cobaltite crystal structure is formed by two different layers, which can be described as an alternate stacking of a common conductive CdI2 type CoO2 layer with a two-dimensional triangular lattice, and a block layer, composed of insulating rock salt type layers. The two sublattices (rock salt type block and CdI2 type CoO2 layer) possess common a and c axis lattice parameters and β angles, while they have different b axis length, causing a misfit along the b direction.7–10
As a consequence of their crystal structure, layered cobaltites possess a very high crystallographic anisotropy, which in turn produces a high electrical anisotropy. For this reason, the alignment of their plate-like grains, by mechanical and/or chemical processes, is essential to attain macroscopic properties comparable to those obtained on single crystals. Some methods have been shown to be adequate to obtain good grain orientation in several oxide ceramic systems, such as template grain growth,11 sinter forging,12 spark plasma sintering13 or directional growth from the melt.14 All texturing techniques produce well oriented grains, leading to a reduction of the electrical resistivity. On the other hand, it is usual that the decrease of the resistivity is accompanied, at least in the solid state texturing methods, by a reduction of Seebeck coefficient values. When considering one of the directional growth from the melt methods, the laser floating zone (LFZ), it has shown a high reliability to obtain a good grain orientation in TE ceramic systems.14 Moreover, due to the high thermal gradient produced in the solidification interface, it can produce textured ceramics at higher rates than in other melt growth techniques. As a consequence, the samples grown by this technique show a reduction of electrical resistivity, but usually lower than expected due to the simultaneous formation of secondary phases.15 On the other hand, previous studies on laser grown samples have shown that the textured samples produced by this technique possess, at the same time, higher Seebeck coefficient values than usual in these systems due to an increase in the concentration of oxygen vacancies.16 In this context, the aim of the present study is to investigate the effect of growth rate on the microstructure and TE properties of Bi2Ba2Co2Ox textured ceramics fabricated by the LFZ technique.
Experimental
The Bi2Ba2Co2Ox polycrystalline samples used in this work were prepared using the classical solid state route from commercial Bi2O3 (Panreac, 98+%), BaCO3 (Panreac, 99+%) and Co2O3 (Aldrich, 98+%) powders. They were weighed in the appropriate proportions, mixed and ball milled in acetone media at 300 rev min−1 for 30 min to produce a homogeneous mixture. The powder suspension was then dried in an infrared: evaporation system until the acetone was completely evaporated. The remaining powder was manually ground and thermally treated twice, in an electrical furnace under air, at 750 and 800°C for ∼12 h, with an intermediate manual milling. The main objective of this process is to assure the complete decomposition of barium carbonate. Otherwise, it would decompose in the molten zone, forming CO2 bubbles inside the melt produced in the LFZ melt texturing process, leading to solidification front destabilisation. The thermally treated powders were then milled, introduced into a latex tube (inner diameter ∼3 mm) and isostatically cold pressed at 200 MPa for ∼1 min to obtain green ceramic cylinders that were subsequently used as feed in an LFZ device equipped with a continuous power Nd:YAG laser (1·06 μm) and described elsewhere.17
All the growth processes were performed under the same conditions except for the different growth rates (15, 30 and 90 mm h−1). All the samples were grown downwards with a seed rotation of 3 rev min−1 anticlockwise. Furthermore, in order to assure the compositional homogeneity of the molten zone, an opposite feed rotation of 15 rev min−1 was also performed. After the texturing process, long (>15 cm) and geometrically homogeneous (∼2 mm diameter) textured cylindrical rods were produced. Finally, the textured bars were cut into pieces with suitable length for their TE characterisation (∼15 mm).
The structural characterisations, as well as the identification of the main phases in all of the textured samples, were carried out using powder X-ray diffraction (XRD) in a Rigaku D/max-B X-ray powder diffractometer (Cu Kα radiation) between 5 and 60°. Sample microstructures were observed using a SEM (JEOL 6000) equipped with an energy dispersive X-ray spectroscope (EDS) device that was used to determine the elemental composition of each identified phase. Longitudinal polished sections of all of the textured samples have been observed to determine the microstructural evolution of the samples with growth rate. Image analysis has been performed on several micrographs for each growth speed in order to estimate the volume fraction of each phase. The TE properties, electrical resistivity and Seebeck coefficient were simultaneously determined by the standard dc four-probe technique in an LSR3 measurement system (Linseis GmbH) under He atmosphere, in steady state mode, at temperatures ranging from 50 to 650°C. In order to determine the sample performances, the power factor (PF, defined as S2ρ−1) has been calculated from the measured electrical resistivity and Seebeck coefficient data.
Results and discussion
The powder XRD patterns for the Bi2Ba2Co2Ox (222) samples grown at different rates are displayed (from 10 to 40°, for clarity) in Fig. 1. In this figure, the peaks corresponding to the cobaltite phase have been indexed, and they are in agreement with previously reported data,18 while the peak at ˜28·5°, marked by an *, corresponds to the BiBaO3 secondary phase with
 space group (#225).19 From this figure, it is clear that 222 is the major phase in the 15 mm h−1 grown samples. However, when the growth rate is increased, the 222 peak intensities are reduced, while the BiBaO3 ones are increased (from Fig. 1a–c). This trend can be easily seen when observing the relative intensity between the peaks found at ˜28·5 and 29·0°, indicating that higher growth speeds reduce the amount of 222 phase and increase BiBaO3 secondary phase proportion. This evolution can be explained by the increase of the solidification rate when the growth speed is raised. As a consequence, solidification is produced under non-equilibrium conditions, leading to the formation of higher proportion of secondary phases.
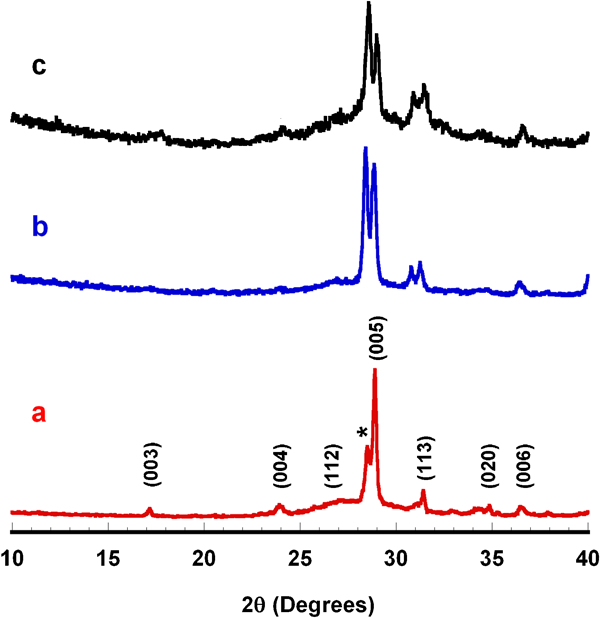
X-ray diffraction plots of textured specimens obtained at different growth rates: peaks corresponding to Bi2Ba2Co2Ox TE phase are indexed, while * indicates BiBaO3 secondary phase:
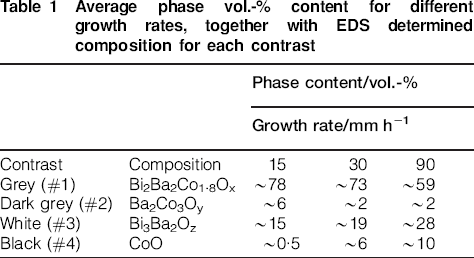
The SEM images of polished longitudinal sections of samples prepared at different growth speeds are displayed in Fig. 2. They show that the samples possess very low porosity, which slightly increases with the growth speed (small black spots in Fig. 2a–c, indicated by P). Furthermore, the amount of secondary phases increases with increasing growth rate, while the grain sizes and preferred orientation are decreased, in agreement with the XRD data. The different phases in the samples have been associated, through EDS, with the different contrasts found in the micrographs, indicated with arrows and numbers in Fig. 2 and summarised in Table 1. Grey contrast (#1) has been identified as the TE co-deficient 222 phase, which is ∼78 vol.-% in the samples grown at 15 mm h−1, decreasing for higher growth speeds to ˜59 vol.-% for the ones grown at 90 mm h−1. Dark grey contrast (#2) corresponds to the Ba2Co3Oy phase, which follows the same trend observed for the 222 phase (from 6 to 2 vol.-%). On the other hand, the non-TE secondary phases, which can be observed as white (#3) and black contrasts (#4) with Bi3Ba2Oz and CoO compositions respectively, increase significantly (from 15 to 28 and 0·5 to 10 vol.-% respectively). These changes can be associated with the modification of the solidification rate discussed previously. Moreover, higher growth rates produce a higher number of nucleation centres, which leads to smaller grain sizes (see Fig. 2).
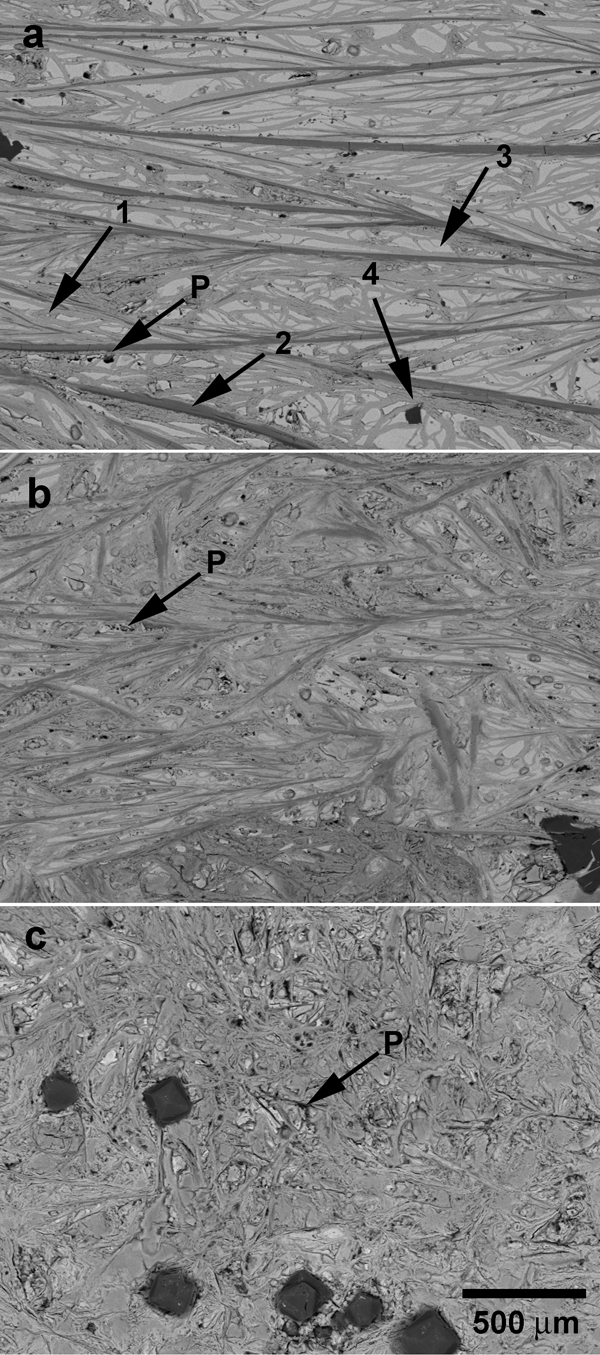
Scanning electron micrographs from longitudinal polished samples obtained with different growth rates: a 15 mm h−1, b 30 mm h−1 and c 90 mm h−1. Arrows indicate different contrasts. #1, grey contrast (co-deficient 222 phase); #2, dark grey (Ba2Co3Oy); #3, white (Bi3Ba2Oz); and #4, black (CoO). P in different micrographs identifies pores
Average phase vol.-% content for different growth rates, together with EDS determined composition for each contrast
In order to study the effect of these microstructural changes on the TE properties, the temperature dependence of the electrical resistivity, as a function of growth rate, was measured and is represented in Fig. 3. In this figure, it can be clearly seen that the room temperature resistivity is decreased when the growth rates are reduced, which confirms the larger grain size and preferred orientation found in samples grown at lower rates. When considering the general resistivity behaviour as a function of temperature, samples grown at 90 mm h−1 show a marked semiconducting type response with temperature. On the other hand, only a slight semiconducting-like behaviour is found for samples grown at 30 mm h−1, while it is nearly temperature independent for samples grown at 15 mm h−1. In any case, the lowest resistivity values correspond to the 15 mm h−1 grown sample in all of the measured temperature ranges. These changes are mainly due to two main factors: first, reduction on the number and proportion of secondary phases, and second, increase of the gain size and alignment when the growth rate is reduced. Both factors lead to a significant reduction of resistivity values, reaching ˜17 mΩ cm at room temperature for samples grown at 15 mm h−1, which is slightly higher than the best reported values, ˜6 mΩ cm.20
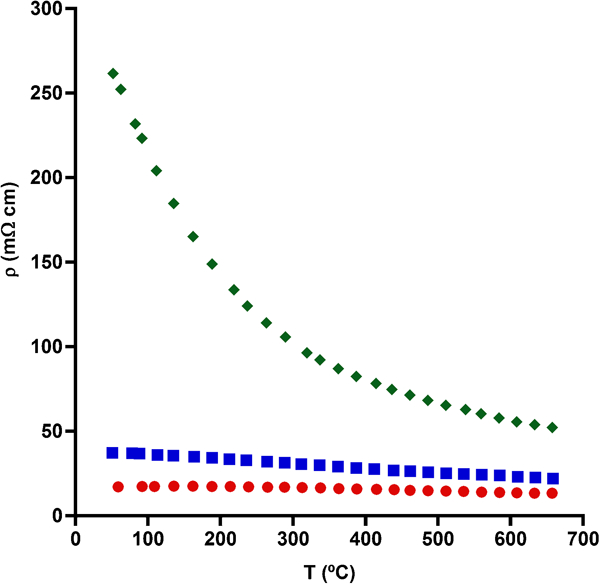
Temperature dependence of electrical resistivity for samples grown at different rates: (•) 15 mm h−1, (▪) 30 mm h−1 and (♦) 90 mm h−1
In Fig. 4, the Seebeck coefficient variation with temperature is shown for the samples grown at different rates. In all the cases, S is positive in the whole range of measured temperatures, indicating a predominantly hole conduction mechanism. When comparing the S values at room temperature, it can be observed that they follow a parallel evolution with the electrical resistivity, and they decrease with the growth rates. This effect is due to the same factors responsible for electrical resistivity reduction, as explained in the previous paragraph. However, the measured S values range from 125 to 145 μV K−1 for samples grown at 15 and 90 mm h−1 respectively, which are higher than the best reported value for this material, which is ∼90 μV K−1 at room temperature.21 Furthermore, the S values increase from room temperature until they reach a maximum at ˜300°C, decreasing at higher temperatures for samples grown at 90 mm h−1. The same behaviour is found for those samples grown at 15 and 30 mm h−1, which reach their maximum values at ˜400°C and show a less marked decrease. The highest value at 650°C has been found to be ∼150 μV K−1 for the 90 mm h−1 grown sample, which is ˜140% greater than the best previously reported result for this composition at the same temperature (˜110 μV K−1).22 The reason for obtaining such high S values in the LFZ grown samples, with respect to those obtained on samples prepared using conventional synthetic routes, is due to the formation of considerable amounts of oxygen vacancies in the TE phase when samples are textured using the LFZ technique. 23 23,24 This effect has also been observed in the misfit phase [Ca2CoO3][CoO2]1·62, which contains considerable amounts of oxygen vacancies when it is thermally treated under reducing atmosphere.25 The increase in the concentration of oxygen vacancies changes the Co oxidation state from Co4+ to Co3+, thus increasing S values, in agreement with the Koshibae equation.25
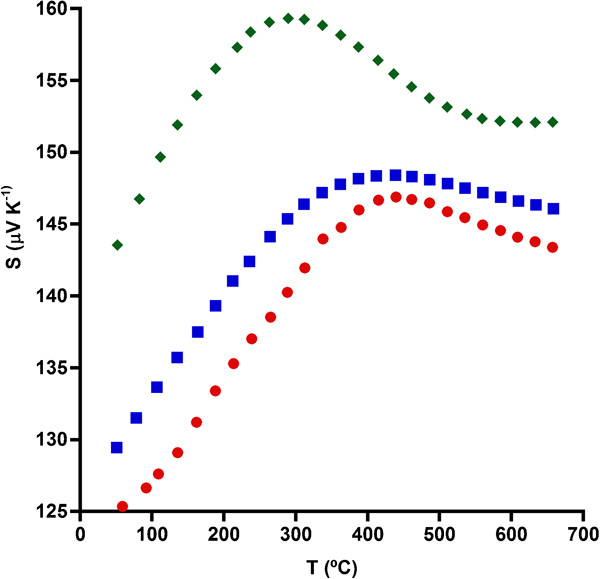
Temperature dependence of Seebeck coefficient for samples grown at different rates: (•) 15 mm h−1, (▪) 30 mm h−1 and (♦) 90 mm h−1
In order to evaluate the TE performances of textured Bi2Ba2Co2Ox ceramic materials, the variation of PF with temperature has been calculated from the resistivity and Seebeck coefficient values and displayed, as a function of the growth rate, in Fig. 5. As a consequence of the significant decrease in the resistivity with decreasing growth rate, PF increases from ∼0·01 mW K−2 m−1 at room temperature for samples grown at 90 mm h−1 to ∼0·09 mW K−2 m−1 for those textured at 15 mm h−1. The maximum value obtained in these samples, ∼0·16 mW K−2 m−1 at 650°C, is about four times higher than the best previously reported values for this composition (0·04 mW K−2 m−1 at 650°C).22
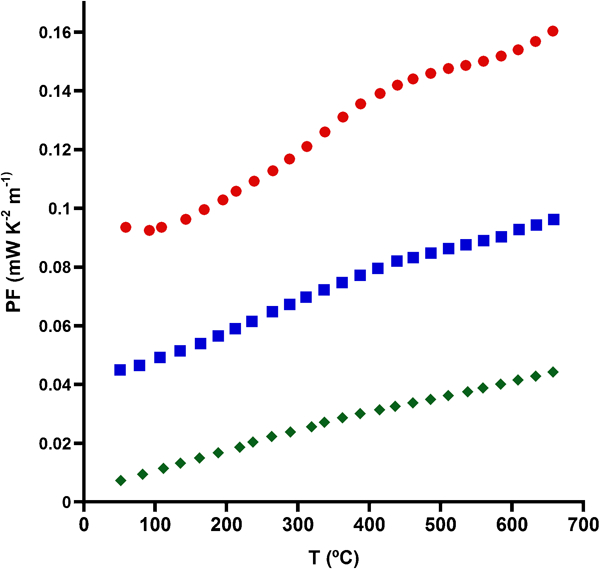
Temperature dependence of PF for samples grown at different rates: (•) 15 mm h−1, (▪) 30 mm h−1 and (♦) 90 mm h−1
Conclusion
This paper demonstrates that Bi2Ba2Co2OX TE ceramics can be successfully grown using the LFZ technique. It has been determined that lower growth rates lead to higher grain alignment and sizes and, as a consequence, to lower electrical resistivity values. Seebeck coefficient decreases with the growth rate, but in any case, the obtained values are higher than the previously reported in the literature. The highest PF value obtained at 650°C was for samples grown at 15 mm h−1, ∼0·16 mW K−2 m−1, which is about four times greater than the best previously reported values for this composition. All these results make this textured material a promising candidate for practical applications in power generation systems.
Footnotes
Acknowledgements
This research has been supported by the Spanish Ministry of Science and Innovation (project no. MAT2008-00429) and the Universidad de Zaragoza (grant no. UZ2011-TEC-03). The authors wish to thank the Gobierno de Aragón (Consolidated Research Groups T12 and T87) for financial support and C. Gallego, C. Estepa and J. A. Gomez for their technical assistance. Sh. Rasekh also acknowledges a JAE-PreDoc 2010 grant from the MICINN-CSIC.