
Abstract
Glass–ceramic filler particles containing various amounts of fluoroapatite–mullite crystalline phases were synthesised using SiO2–Al2O3–P2O5–CaF2–CaO system as the base glass formulation. Different additives were used to promote crystallisation in this system. Composite samples were prepared by incorporating the silane treated glass–ceramic particles into the Bis-GMA/TEGDMA (60∶40 mass ratio) epoxy matrix. Structural and microstructural characterisations were conducted using Fourier transform infrared spectroscopy, X-ray diffractometry and scanning electron microscopy (SEM). The mechanical properties of the light cured samples were examined by measuring flexural and diametral tensile strength, as well as conducting Vickers microhardness test. Results obtained in this study showed strong dependence of the flexural strength on the composition of the filler particles. Diametral tensile strength and microhardness values demonstrated lesser sensitivity to the filler composition. Microstructural examination of the samples by SEM revealed particle pull-out, debonding and crack deflection as the major energy consuming mechanisms in the fracture process.
Introduction
Despite the extensive research, mechanical properties continue to be a major concern in the field of dental composite restorative materials.1 The mechanical properties of importance in dental composites include but are not limited to, flexural strength (FS), diametral tensile strength (DTS) and hardness.2 Flexural strength is the material property that implies the quantity of flaws within the material that may have the potential to cause catastrophic failure during loading. Complex geometric forms of dental composite restoratives can lead to the development of the tensile forces during mastication.3, 4 Due to the brittle nature of the dental composite materials, tensile strength is measured indirectly by diametral tensile testing.3, 4 This method has been developed to investigate the tensile strength of brittle materials showing little or no plastic deformation. In this test, a cylindrical specimen is submitted to a compressive load in the diametral plane, which is perpendicular to the longitudinal axis. The hardness data provide valuable information about the material's polishability and abrasion resistance.5 The essential components of composite dental material consist of a polymeric matrix reinforced with inorganic dispersed phase. The mechanical and chemical performance of these materials is affected significantly by the modifications in the characteristics of the inorganic filler particles. Improvement in the filler strength and their distribution in the resin matrix has been one of the major challenges in the development of the dental restorative materials.6, 7 Borosilicate glasses, quartz, Al2O3, and zirconia of various sizes and shapes are considered as some of the more traditional filler particles.7 More recently, glass fibres, nanoporous powders, branched fibres and ceramic whiskers have also been investigated as fillers in dental materials.6–10 Another issue in the design of dental composite materials is the subject of secondary caries.11 This problem has been addressed by the use of fluoride ion containing sources such as CaF2. However, due to the low mechanical and wear resistance, the use of this compound has had a negative impact on the mechanical properties of the composite dental materials.11, 12 In this study SiO2–Al2O3–CaF2–P2O5–CaO glass–ceramic system has been chosen as the base formulation in the preparation of reinforcing particles. This system is shown to crystallise into the fluorapatite and mullite phases.13, 14 The hypothesis was that the use of filler particles containing simultaneous presence of fluorapatite and mullite crystals would result in substantial improvement in both biostability and the mechanical properties of the dental composite.15–18 The use of SiO2–Al2O3–CaF2–CaO system along with P2O5 for the formation of mullite and fluoroapatite phases has already been reported in the literature.9 In a separate study, the present authors have looked at the effect of additives such as ZrO2, BaO and TiO2 on the development of the crystalline phases in this system.19 The major conclusion was that the nucleation and morphology of the mullite and fluoroapatite phases were strongly influenced by the type and amounts of the additives. Advantages such as control in the type, morphology and the percentage of the crystalline phases have been the main attractions for the use of glass–ceramic filler particles in the dental restorations.20–22 It should also be pointed out that the use of glass–ceramic particles based on SiO2 may increase their interaction with silane coupling agent during silanisation process in dental composites.23 To our knowledge, there are no published data on the use of mullite–fluoroapatite glass–ceramics as reinforcing particles in dental composite materials. The major focus in the present work was to synthesise glass–ceramic reinforcing particles, characterise their physical characteristics and to assess their effect on the FS, DTS and microhardness in the composite samples.
Materials and methods
Sample preparation
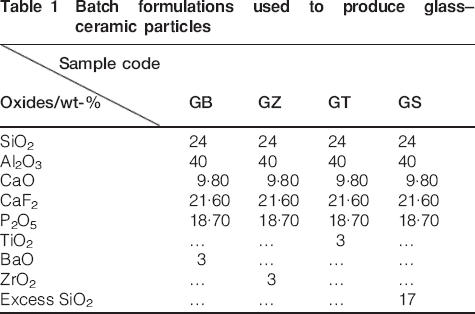
As mentioned previously the glass formulation used in this study was based on an earlier work published on this system.9 Analytical grade Al(OH)3, CaF2, TiO2, ZrO2, BaCO3 and CaCO3 purchased from Merck, Germany, phosphoric acid provided by Riedel De Haune, and SiO2 provided by a national company were used as raw materials in this study. Four groups of filler particles coded as GB, GZ, GT and GS with the batch formulations shown in Table 1 were prepared according to the following procedure: batch formulations based on Table 1 were mixed and melted in an alumina crucible at 1550°C for 2 h after which the resulting molten mixes were cast into a prewarmed steel mould. Based on the differential thermal analysis results, the glass products were first subjected to a nucleation treatment at 650°C for 3 h, followed by a growth treatment at 1100°C for 3 h. Phase identification and chemical structural information were obtained by performing X-ray diffractometry (XRD, Siemens D-500), and Fourier transform infrared spectroscopy (FTIR, Thermo Nicolet Nexus 870). The morphology of the crystalline phases was determined by scanning electron microscope (SEM, Philips XL-30). The samples were etched using HF solution prior to SEM analysis. Bulk glass–ceramics were ground to powder in a fast mill containing zirconia media. Particles passed through a filter (800-mesh size) were collected and used as filler particles. The average filler particle size and their distribution were studied with a particle size analyser (Fritsch, Analysette 22 MicroTec plus) and dynamic light scattering analysis (Malvern Mastersizer X equipment). In order to improve the bonding between the filler particles and the polymer resin the heat treated powders were silanised by mixing with 3 wt-% γ-methacryloyloxypropyl-1-trimethoxysilane (γ-MPS) coupling agent using a rotary evaporator at room temperature for 1 h. The mixing process was followed by drying at 90°C under a moderate vacuum. The resin system used in this study consisted of 60 wt-% Bis-GMA, 40 wt-% TEGDMA, 0·25 wt-% Camphorquinone (CQ) and 0·25 wt-% N, N-dimethyl aminoethylmethacrylate (DMAEMA). The γ-MPS, Bis-GMA, TEGDMA, CQ and DMAEMA were the product of Sigma–Aldrich Chemie Ltd, Germany. The latter two reagents were used as photo initiator. Four groups of composite samples coded as C–GB, C–GZ, C–GT and C–GS were prepared by reinforcing the basic resin system with 75 wt-% of GB, GZ, GT and GS glass–ceramic particles, respectively.
Batch formulations used to produce glass–ceramic particles
Characterisation
Flexural measurements were carried out in accordance with ISO 4049-2000 by preparing 12 specimens of each formulation using an acrylic mould (25×2×2 mm). The open sides of the mould were covered with mylar strips and slide glasses. The resin composite samples were light cured at 500 mW cm−2 for 60 s from both surfaces, using a quartz–tungsten–halogen light polymerisation unit (Optilux 501, SDS Kerr, Danbury, CT, USA). The three-point bending test was conducted in a universal testing machine (SANTAM-20), at a crosshead speed of 0·1 mm min−1. Flexural strength values for glass–ceramics and composite samples were calculated using the following relationship


Results and discussion
X-ray diffractometry patterns for the heat treated reinforcing particles (batch formulations shown in Table 1) are displayed in Fig. 1. As indicted by the intensities of the XRD peaks at 2θ = 16·9 and 2θ = 26·5, the formation of the mullite crystalline phase increases with the addition of ZrO2 and/or BaO into the base glass–ceramic system. Based on the observed intensities of the above mentioned peaks lower amount of mullite phase was formed in GT (base composition+TiO2 additive) and especially in the GS (base composition+SiO2) filler compositions. In addition to mullite the formation of fluorapatite crystalline phase was also observed in all filler compositions studied in this work. In a separate study, the present authors have studied the effect of additives on the microstructure and mechanical properties of the apatite–mullite glass–ceramics.19 Briefly, it was thought that, the early crystallisation of the fluorapatite crystalline phase in the TiO2 containing glass–ceramics leads to an increase in the viscosity of the remaining glassy phase and reduces the atomic mobility needed for the nucleation and growth of the mullite crystalline phase. Similar results were observed with the addition of the excess amount of the SiO2 into the base glass composition. Therefore, it is believed that the lower content of mullite crystalline phase is associated with the changes in viscosity. PANanalytical's X'pert HighScore Plus software was used in the semiquantitative analysis of the XRD data. The relative amount of mullite phase in the glass–ceramic filler particles was determined using this software. The contribution of the glass phase was removed by subtracting the background before the analysis. The results indicated the highest amount of mullite phase in the GZ and GB glass–ceramic compositions (about 65–68 wt-%). The lowest amount of mullite content was observed in the GS glass–ceramic (about 30 wt-%). The relative amount of mullite phase in the GT glass–ceramic composition was found to be in the range of 50–55 wt-%. Morphology and the chemical composition of the crystalline phases were determined by means of SEM equipped with energy dispersive X-ray spectroscopy. Scanning electron microscopy images of the GB, GZ, GT and GS reinforcing particles and their corresponding energy dispersive X-ray spectra are displayed in Fig. 2a–d. The results of SEM analysis indicated that mullite and fluorapatite crystalline phases possessed rod-like morphology in both GB and GZ (see Fig. 2a and b and the corresponding energy dispersive X-ray spectra). However, fluorapatite particles appeared with spherical morphology in GT composition (see Fig. 2c). Spherical fluorapatite and mullite crystalline particles were seen only in GS reinforcing particles (Fig. 2d). The appearance of mullite phase in different sizes and morphologies can also be explained in terms of difference in the glass viscosity values.13, 19, 20 Following the microstructural examination, three-point bending FS of the reinforcing glass–ceramic systems were evaluated and compared. The results of the FS test of glass–ceramic samples are shown in Table 2. As indicated in this table, the highest FS value was observed for the reinforcing glass–ceramic system containing higher amount of mullite phase namely GB system (The difference in FS values were significant (p<0·05)).
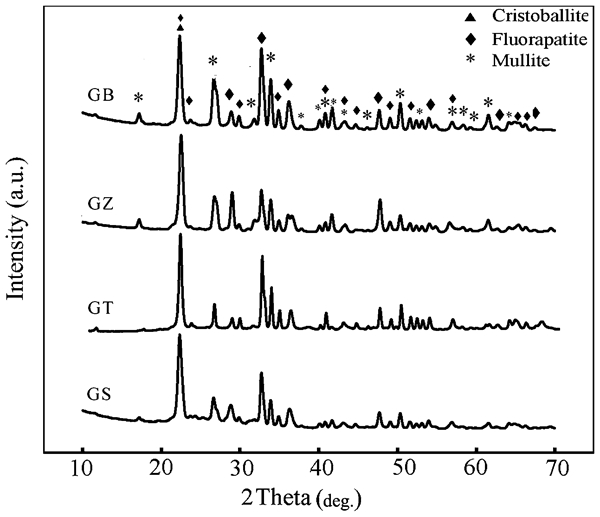
Patterns (XRD) of heat treated reinforcing particles
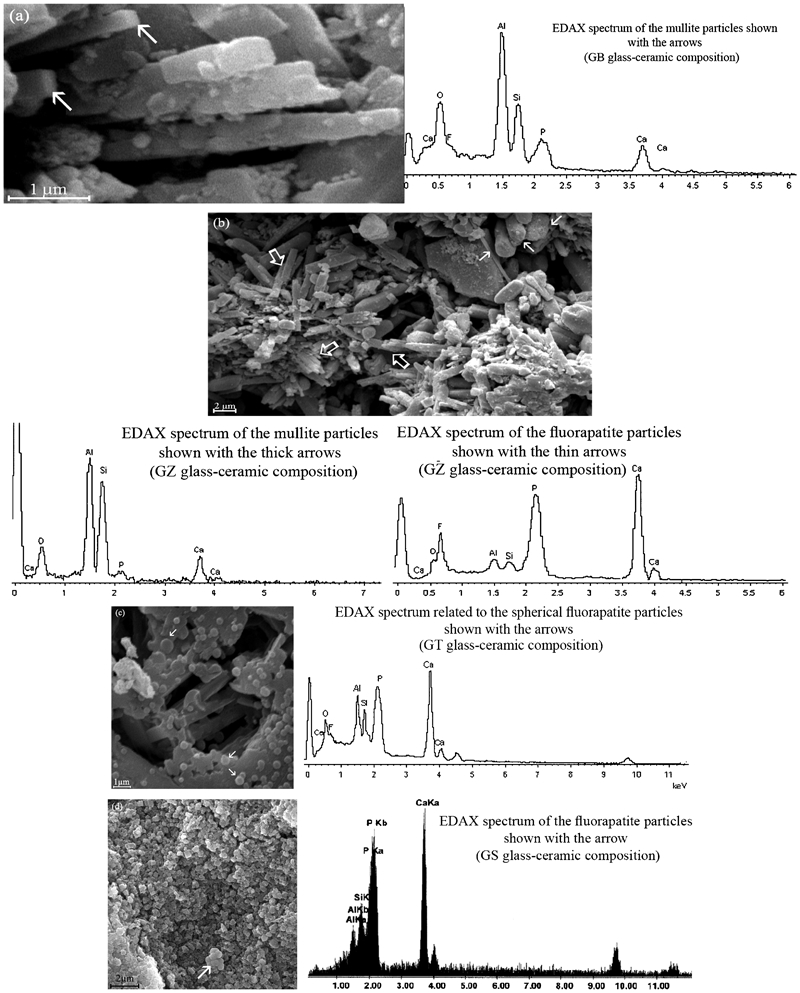
Images (SEM) of heat treated reinforcing particles a GB, b GZ, c GT and d GS glass–ceramics
Mean flexural strength and Vickers microhardness values of glass–ceramic samples
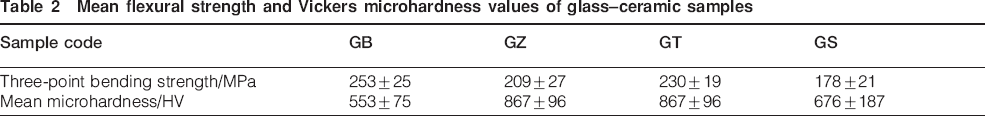
The results of the Vickers hardness test for the different glass–ceramic compositions are also presented in Table 2. The indentation microhardness numbers measured for the obtained glass–ceramic materials were found to lie in the range of 550–990 indicating high abrasion resistance of these materials. The GZ and GT glass–ceramic compositions showed statistically higher mean microhardness values (p<0·05). Of course, due to the presence of harder mullite phase in the GB glass–ceramic composition, higher hardness was anticipated for this composition. In addition to the difference in the distribution of the crystalline phases another possible reason for the observed high microhardness values associated with the GZ and GT glass–ceramic compositions is the lower ionic radius of Zr and Ti ions compared to Ba ions which can induce stronger interaction with surrounding anions in the glass network.24 The higher integrity of the glass network in the presence of excessive SiO2 content may also contribute to the increased hardness values in GS composition.24
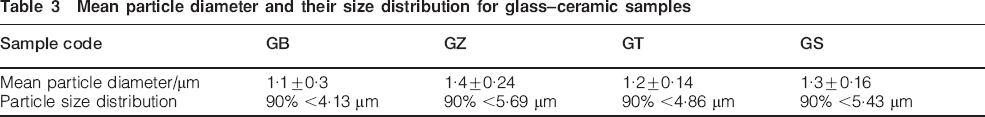
The mean particle diameters and their size distributions for glass–ceramic reinforcing particles are shown in Table 3. The results show that there are no considerable differences between mean particle diameters and their distributions (p<0·05).
Mean particle diameter and their size distribution for glass–ceramic samples
Generally, high FS is desired for restorations that are subjected to increasing chewing stresses. The results of the bending strength test for the composite samples are shown in Table 4. As indicated in this table the lowest mean FS values are observed in the C–GT and C–GS samples. [The differences in FS values were significant (p<0·05)]. The lower strength in C–GS sample may be associated with the lower amount of mullite phase in the GS particles as evidenced by the XRD results shown in Fig. 1. In contrast, the higher strength of C–GB and C–GZ samples may be the result of higher amount of mullite phase in the GB and GZ particles.
Mean flexural strength, DC (%), DTS and Vickers microhardness values of composite samples
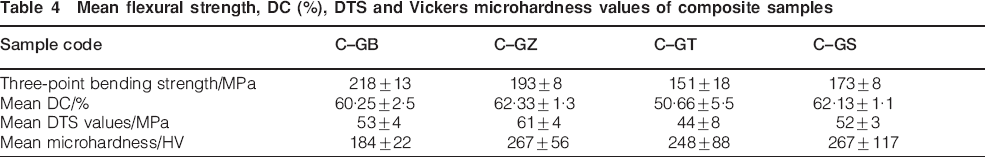
Another point to note in Table 4 is the low strength values for C–GT composite sample. The weak interaction between the filler and the resin matrix and incomplete polymerisation reaction is believed to be the cause of this behaviour.25 This point was further investigated by performing Fourier transform infrared analysis on the composite samples. The chemical structure of the composite samples as revealed by FTIR analysis is presented in Fig. 3. As indicated in this figure, the bands around 1000–1300 cm−1 are related to the Si–O and
 bonds of glass–ceramic particles.26 The characteristic stretching vibration bands of (–CH2–) C–H and (COOCH3) chemical groups at 2857 and 2940 cm−1 are exhibited by all samples. There is an extra band at 2900 cm−1 in FTIR spectra of C–GT sample (see spectrum (c) in Fig. 3). This band is an indication for the incomplete polymerisation of the matrix.25 The bands at 1608 and 1642 cm−1 are highly significant because absorption bands around these regions have been ascribed to the bond strength (hydrogen and covalent) between the silane coupling agent and the filler particles.27,
28 The lower intensity of these bands and the band at 1700 cm−1 which is related to the hydrogen bonding between the silane coupling agent and the filler particles in C–GT composite sample (see spectrum (c) in Fig. 3) indicates a weaker interaction between the silane and these reinforcing particles.25–28 It is well known that next to the choice of filler type, the quality of the filler–matrix bonding in composite samples plays an important role in the efficient transfer of stress from the polymer matrix to the filler particles. The highest increase is only realised when the particles are strongly bonded to the polymer matrix.27–29 The mean DC values for the prepared composite samples and corresponding standard deviations are also shown in Table 4. C–GT composite sample has the lowest significant mean DC value (p<0·05). There are no significant differences among other composite samples (p<0·05). It is therefore, believed that the weak interaction between the silane coupling agent and the filler particles as exhibited by the FTIR results and lower degree of polymerisation (Table 4) may be a contributing factor for the lower FS observed in the resin matrix reinforced with silanated GT particles.
bonds of glass–ceramic particles.26 The characteristic stretching vibration bands of (–CH2–) C–H and (COOCH3) chemical groups at 2857 and 2940 cm−1 are exhibited by all samples. There is an extra band at 2900 cm−1 in FTIR spectra of C–GT sample (see spectrum (c) in Fig. 3). This band is an indication for the incomplete polymerisation of the matrix.25 The bands at 1608 and 1642 cm−1 are highly significant because absorption bands around these regions have been ascribed to the bond strength (hydrogen and covalent) between the silane coupling agent and the filler particles.27,
28 The lower intensity of these bands and the band at 1700 cm−1 which is related to the hydrogen bonding between the silane coupling agent and the filler particles in C–GT composite sample (see spectrum (c) in Fig. 3) indicates a weaker interaction between the silane and these reinforcing particles.25–28 It is well known that next to the choice of filler type, the quality of the filler–matrix bonding in composite samples plays an important role in the efficient transfer of stress from the polymer matrix to the filler particles. The highest increase is only realised when the particles are strongly bonded to the polymer matrix.27–29 The mean DC values for the prepared composite samples and corresponding standard deviations are also shown in Table 4. C–GT composite sample has the lowest significant mean DC value (p<0·05). There are no significant differences among other composite samples (p<0·05). It is therefore, believed that the weak interaction between the silane coupling agent and the filler particles as exhibited by the FTIR results and lower degree of polymerisation (Table 4) may be a contributing factor for the lower FS observed in the resin matrix reinforced with silanated GT particles.
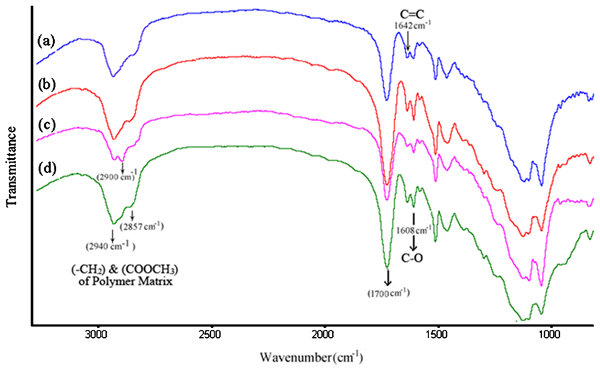
Spectra (FTIR) of a C–GB, b C–GZ, c C–GT and d C–GS composite samples
In order to study the energy consuming mechanisms responsible for the reinforcement of the strength, the fracture surface of the samples containing GB and GZ particles (samples showing the highest FS in this study) were examined under SEM. The results of this investigation are shown in Fig. 4a and b. As indicated in the micrographs the most predominant energy consumption processes are crack deflection, particle-pullout and debonding. Diametral tensile strength is another important parameter for the restorative material in that tensile stress is the cause of many critical failures in are the result of tensile stress. Table 4 also represents the mean DTS values for the samples kept in ambient environment. An important point to note is that in contrast to FS, DTS values show less sensitivity to the composition of the filler particles (p<0·05).
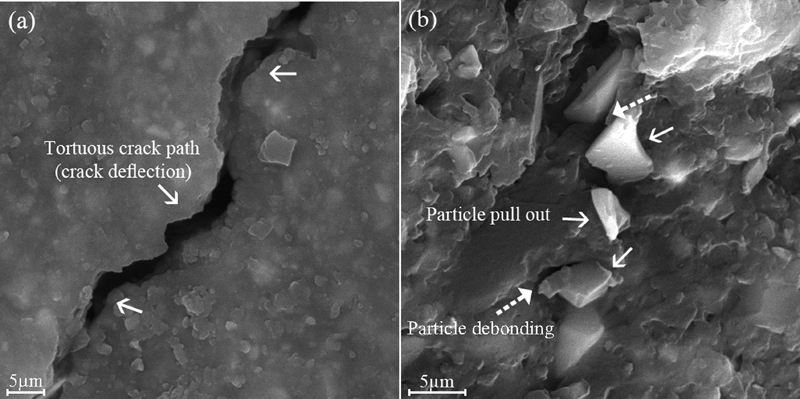
Images (SEM) of fracture surfaces of a C–GB and b C–GZ composite samples
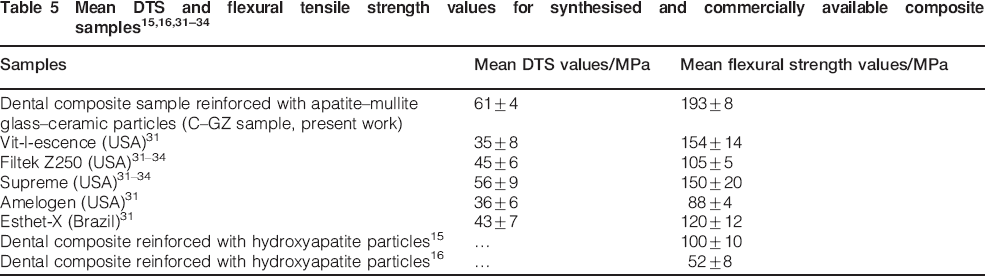
The results of the Vickers hardness test for the composite samples containing different reinforcing particles are given in Table 4. The hardness is an indicator for wear resistance of dental restoratives.29 As indicated in this table, the highest hardness values of composites were recorded for the C–GZ and C–GS (p<0·05). C–GB samples presented statistically lower mean microhardness values than the other materials investigated (p<0·05). It should be noted that the hardness readings are most likely an average values of both the polymer matrix and the filler particles.29 The microhardness values of prepared dental composites may be the result of complicated contributing factors such as filler particle size distribution, degree of the matrix curing, bonding strength at the filler/polymer interface and the glass content and its composition.29, 30 There was no significant difference between the mean microhardness values for C–GZ, C–GT and C–GS composite samples. The mechanical properties for some of the commercially available dental composite materials and the samples synthesised in this study are shown and compared in Table 5. Based on the results presented, it can be claimed that the mechanical properties of all the composite samples tested in this study were equal and in some cases higher than values reported for commercially available dental composites samples.31–34 As indicated in this table the mean flexural and DTS of C–GZ composite reinforced with fluorapatite–mullite glass–ceramic particles are comparable with the FS of commercial dental composite such as Supreme-SU and Filtek Z-250.31–34 The diametrial tensile strength values of the prepared dental composite samples were also similar to the commercial dental composites such as Supreme (3M ESPE), Esthet-X and Filtek Z-250.31–34 As indicated in this table the mean flexural and DTS of composite samples reinforced with fluorapatite–mullite glass–ceramic particles are higher than the values reported for Amelogen (USA) and Vitlescence (USA) commercial materials.31 The FS of some experimental dental composite reinforced with apatite particles are also shown in Table 5. These results show that high strength mullite crystalline phase has improved the mechanical strength values of dental composites reinforced with apatite–mullite glass–ceramics. A restorative material having high hardness, FS and DTS may be clinically applied with more confidence and is expected to be more resistant against masticatory forces.31 However, additional studies are required to evaluate their performance as stress bearing restorations in clinical applications.
Conclusion
Composite restorative dental materials were prepared using glass–ceramic reinforcing particles containing various amounts of mullite and fluoroapatite crystalline phases. The amount and morphology of the crystalline phases were affected by the type of additives in the glass batch formulation. Flexural strength, DTS and hardness measurements were comparable to the commercially available materials. The highest FS was observed in the composite sample with the highest amount of mullite phase. Microstructural investigation revealed particle pull-out, crack deflection and debonding as the main energy consuming mechanisms operating in the fracture process.