
Abstract
Thermal modification is an increasingly popular process that increases biological durability and dimensional stability of timber. The equilibrium moisture content of thermally modified timber (TMT) is lower than that of untreated timber, as is the fibre saturation point. For these reasons, traditional methods of moisture content determination have to be reviewed and calibrated specifically for TMT and novel methods may prove more suitable for online measurement systems. In this study, the moisture content (MC) of TMT was measured using conventional dielectric and resistance meters as well as by the air-coupled ultrasound method and electrical impedance spectroscopy (EIS). The timber was kept outdoors for a period of 10 weeks while the MC was determined every other week so that a wide range of MCs could be measured. It was seen from the results that the conventional meters were not readily calibrated for TMT and the measurement range of these methods is small due to lower fibre saturation point. The study showed the potential of EIS and air-coupled ultrasound for MC analysis of TMT. Best correlation with MC at higher MCs was achieved with the maximum amplitude of through transmission signals by the ultrasound method. Higher precision and a wider range of MCs could be measured by combining both EIS and ultrasound parameters.
Keywords
Introduction
Thermally modified timber (TMT)
Thermally modified timber, also known as heat-treated wood, exhibits reduced hygroscopicity, lower equilibrium moisture content (MC) and lower density compared with conventionally dried wood. The actual MC is of prime concern during the production process, for example for monitoring the modification process and for optimising further processing systems. Various accurate and non-destructive methods of MC determination exist and several types of moisture meters have been available on the market since the 1930s both as hand-held devices and stationary industrial systems. These meters have been calibrated for a large number of wood species but hitherto, the response of TMT has not been investigated specifically. The lowest MC that can be measured accurately by conventional resistance moisture meters lies around 4%, which is especially interesting because this value coincides with the typical MC of TMT in industrial further-processing chains. Uncertainty also exists regarding the upper reliability limit of moisture meters since the fibre saturation point (FSP) of TMT is significantly lower compared with that of conventionally dried timber.
Wood is a hygroscopic material because of the presence of –OH groups in the hydrophilic polymers of the cell wall, celluloses and hemicelluloses, which are capable of bonding water molecules through hydrogen bonds. However, not all the –OH groups can be reached by the water vapour molecules, because the cellulose molecules form crystalline regions where the –OH groups of the adjacent molecules are in a parallel arrangement (Esteban 2006). As a result of this process, wood adjusts its MC in relation to the temperature and the relative humidity of the surrounding air. Wood hygroscopicity can be modified by physical or chemical means, as well as by biological degradation. It is reduced by exposure to high temperatures.
Thermally modified timber is typically produced by heating wood at temperatures ranging from 170 to 220°C for several hours while preventing the wood from burning. While process designs of different producers may differ considerably, the fundamental process is the same. In case of the ThermoWood process, the wood is heated and protected by superheated steam. The main advantages of TMT over conventionally dried timber are increased biological durability and dimensional stability. Chemically, the thermal modification process involves the degradation of hemicelluloses, which are the least thermally stable and the most hydrophilic polymers of the main wood components (Bourgois and Guyonnet 1988; Zaman et al. 2000). The reduction in the amount of sites available for water sorption (mainly hydroxyl groups) that accompanies the degradation of hemicelluloses has often been suggested as an explanation for reduced hygroscopicity (Feist and Sell 1987; Bekhta and Niemz 2003; Obataya et al. 2006). Furthermore, lower amounts of hemicelluloses enhance cross-linking reactions because they interfere less with direct bonding of cellulosic chains (Duchesne et al. 2001). Arnold (2010) reported the FSP of TMT, treated at 220°C, to be 17±2% compared with 26·5±1% for conventionally dried timber.
Determination of MC
There are a number of commonly used methods for measuring the MC of wood. The gravimetric method is one of the most accurate methods and generally accepted as a standard for calibrating other methods. It involves simply weighing the specimen before and after oven-drying to constant weight at 103°C, whereafter the MC is expressed as a percentage of its dry weight. Thus MC = 100(Ww/w0), where Ww is the weight of water and w0 is the dry weight of wood. Most other commonly used methods for determination of wood MC are based on the fundamental relationship between MC and electrical properties. Hand-held moisture meters are typically either resistance (pin-type) or dielectric (flat plate) meters.
Resistance moisture meters
A conductance-type (resistance-type) moisture meter differs from an ordinary ohmmeter only in the unusually high values of resistance (low conductance) that must be measured when checking wood with MC below ∼10% (James 1988). The measurement is based on that below FSP, the logarithm of the electrical resistance decreases directly as the MC increases (Skaar 1988). The typical operating range for resistance moisture meters is from 7 to 25% MC. This type of meter uses pin-type electrodes that penetrate the wood. Resistance meters have an accuracy of ±1·5% to ±2·5% MC over their operating range (Forsén 2000). When pin-type electrodes are driven into wood, the observed conductance is almost exclusively in the thin shell of wood that is in immediate contact with the pin. Neither the conductivity of the wood between the poles of the electrode nor the distance between the poles has any significant effect on the reading of a conductance-type moisture meter. Experimental variables affecting the measurement of DC resistance of wood include wood variables (MC, MC distribution, ion concentration, grain, lignin, extractive content, ash, density and species) and experimental variables (voltage gradient, time of electrification, etc.) (Vermaas 1975).
Dielectric moisture meters
The operating range for dielectric moisture meters is greater than that for resistance moisture meters from 4 to 100% MC. Dielectric meters use surface contact, flat plate electrodes that do not penetrate the wood. The depth of penetration by the measuring field depends on electrode arrangement and typical ranges vary from 10 to 50 mm. Dielectric meters read the average MC of the zone penetrated by the electric field. The accuracy of dielectric meters is about ±2·5% to ±4% MC below FSP (Forsén 2000). The readings are reportedly most influenced by the wood nearest the electrode, and are consequently more reliable on wood with a fairly uniform MC than on wood with substantial moisture gradients.
Electrical impedance spectroscopy (EIS)
In electrical impedance spectroscopy, an alternating electric field at several frequencies is induced into a specimen, and the responses are measured. Moisture content is the main factor affecting dielectric properties of wood, but e.g. density, temperature and grain angle have an effect as well (Skaar 1988; Torgovnikov 1993). For untreated wood, monomolecular moisture has been proposed to predominate the dielectric properties of wood when MC is <5%. The effect of poly-molecular moisture is the highest when MC is between 5 and 23%, and capillary-condensed moisture predominates from 18–23% to the FSP. Above the FSP, free water has the largest impact (Torgovnikov 1993). Electrical impedance spectroscopy has been used, for example, for the characterisation of wood MC and moisture gradients (Tiitta et al. 1999, Tiitta and Olkkonen 2002).
Complex impedance response can be expressed as Z(jω) = Z′+jZ″, where j is the imaginary unit, ω is the angular frequency, Z′ is the real part and Z″ is the imaginary part. Impedance magnitude is determined as |Z| = [(Z′)2+(Z″)2]1/2 and the phase angle as φ = tan−1 (Z″/Z′).
Ultrasound
Propagation of ultrasound in wood is strongly affected by the mechanical properties of wood. Strength, density and MC have an effect, as well as the grain orientation, knots and defects (Bucur 1995). As the MC of wood increases, the velocity of ultrasound decreases strongly up to 20–50% MC. After that, the velocity decrease is less steep. The MC at which there is a turning point in the velocity decrease, is the FSP. There is a similar turning point related to attenuation although it is at lower MC. The attenuation at low MC is nearly constant, but after the turning point it starts to increase (Sakai et al. 1990).
The traditional ultrasound measurement requires a contact between the transducer and specimen in test, which limits its practical application. However, the recent development of non-contact techniques makes ultrasound suitable for, e.g. online measurement in industry. Non-contact, or air-coupled, ultrasound has been successfully studied for online determination of wood moisture levels (Vun et al. 2008).
In this study, several electrical methods and ultrasound were used for evaluation of MC of TMT including moisture gradients. Both commercial moisture meters and laboratory equipment were used. A new method using electrical impedance and ultrasound was introduced using multiple regression analysis. In the method, both electric and mechanical properties of TMT have an effect on the MC response.
Methods
Material
The tested material was pine ThermoWood treated at 212°C with dimensions of 38×120×250 mm. The samples were divided into two parallel groups (samples were taken from one piece of wood close to each other): one group was kept outdoors under cover, and the other group was kept uncovered. The samples were kept outdoors for a duration of 10 weeks and taken inside the lab for measurements every other week (Table 1). Before a measuring, the samples were wrapped air-tight in plastic and stored inside for 2 days.
Overview of measurement dates and weather data of the preceding exposure periods
*Source: Finnish Meteorological Institute, Kuopio.
Every measurement round, the MC and distribution were measured using the methods described in the following paragraphs.
Gravimetric
The oven-dry method was used for determining reference MCs. The moist mass of samples was recorded every measurement series and after the last series, the samples were oven dried at 103±2°C in accordance with standard ASTM D4442.
Resistance
A hand-held resistance meter was used (Gann HT85Tl) and equipped with steel needles with insulated shafts and bare tips. The electrode pins remained in the wood while the samples were outdoors. In each sample, one pair of pins was located near the butt-end of the sample and one pair in the middle. The very first value that appeared on screen was taken.
Dielectric
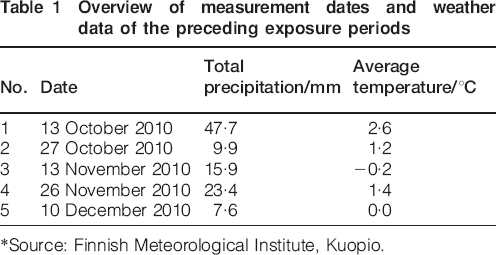
Moisture content was determined using a commercial hand-held device of the type Vanicek Viva 31. Dielectric measurements were made on right points of each sample, the first being located 56 mm from the butt end and each next point at 20 mm further distance from the butt (Fig. 1). The measurements were made on the inner face of the sawn timber. Two series of measurements were made, one in both longitudinal and the other in crosswise direction.
Dielectric moisture meter set-up for longitudinal measurements: for crosswise measurement, device was turned 90°
Electrical impedance spectroscopy
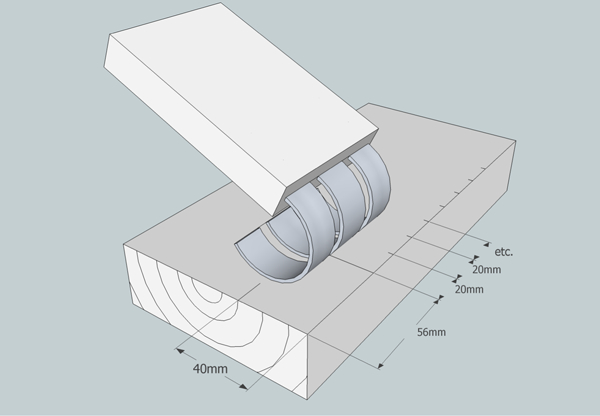
Electrical impedance spectroscopy was measured at eight points per sample coinciding with dielectric measurements (Fig. 2).
Set-up for EIS measurements
The impedance was measured using a Solartron 1260 impedance analyser, which was connected to a dielectric interface Solartron 1296A. The analyser was driven by a microcomputer, which was connected via a GP-IB interface to the analyser. An automated program was used to scan 26 frequencies in the range of 100 Hz to 10 MHz. The specimens were measured using Cr–Ni conductive electrodes (40×50 mm) and a constant gap of 1·5 mm between the electrodes. The measurements were done in longitudinal direction. The electrodes were used as conductive and insulated forms, the insulated (capacitive) electrodes were formed using Teflon sheet between the electrodes and the sample. The 25 mm thick dielectric plastic was placed between the constant force element and the electrodes as well as below the specimen.
Ultrasound
Ultrasound measurements were made in through transmission and reflection set-up. Each sample was measured from eight points along the length. Ultrasound transducers for the through transmission were focused and the nominal frequency was 50 kHz. Actual peak frequency was 63 kHz and the bandwidth at −6 dB was 12·8 kHz. The active area was 50 mm in diameter. The ultrasound transducer receiving the reflection was not focused and its nominal frequency was 100 kHz. Actual peak frequency was 115 kHz and the bandwidth at −6 dB was 30 kHz. The active area was 25×25 mm.
Results
Resistance
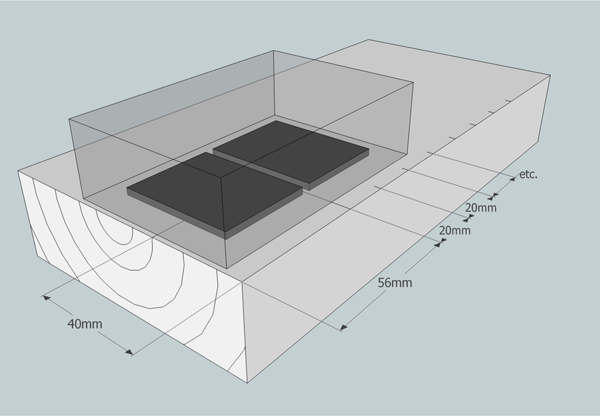
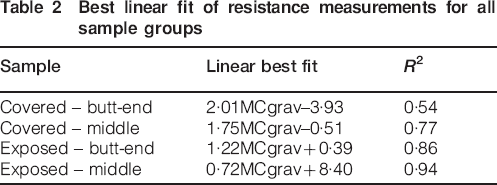
The MC values determined using a hand-held resistance meter are shown in Fig. 3. In case of both samples, the resistance MC was measured in the middle of the piece as well as near the butt-end. The functions of best fit are shown in Table 2. Within each measurement group, the correlation with gravimetric MC was over 0·9. However, correlation coefficient of all samples taken together was not as high.
Gravimetric MC versus resistance MC for covered and exposed samples, both measured near the butt-end of and in middle of sample
Best linear fit of resistance measurements for all sample groups
Dielectric
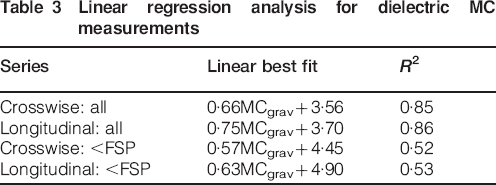
Dielectric MC values were measured at eight consecutive spots on each sample. The average value is shown as well as the highest and lowest values (Fig. 4). The mean of these values per sample per day versus gravimetric MC shows higher estimations when gravimetric MC is <10% and lower when the gravimetric MC is >10%. The best linear fit for crosswise dielectric means versus gravimetric MC is described by MCdiel = 0·66MCgrav+3·6 (Table 3). The mean dielectric values had a correlation of 0·96 with gravimetric MC over the whole MC range, whereas <FSP, this correlation was 0·85.
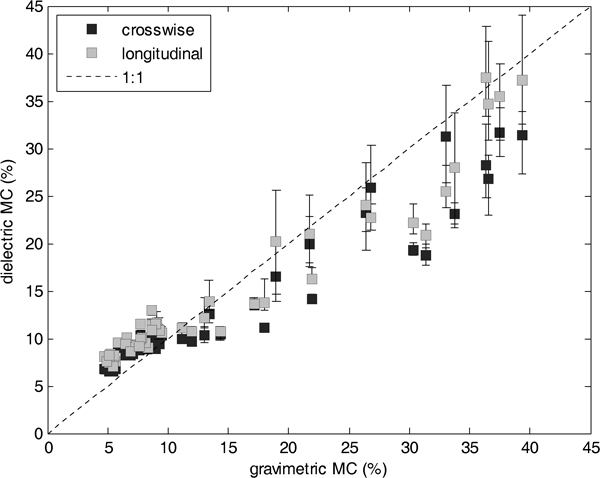
Gravimetric MC versus dielectric MC for all measurements (eight locations per sample per day)
Linear regression analysis for dielectric MC measurements
In Fig. 4, the longitudinal dielectric profiles are shown for an exposed sample and a covered sample. In case of the covered sample, the measured longitudinal gradient was minimal but notably, MCs were rising steadily, except for the last measurement series which did not fit this trend and was also significantly lower than the MC measured by the gravimetric method.
The exposed sample exhibited a growing longitudinal moisture gradient as the bulk MC got higher.
Impedance
It can be seen from Fig. 5 that in case of higher frequencies, the measured Z magnitude was nearly the same regardless of the longitudinal moisture gradient whereas the trend was observed at lower frequencies.
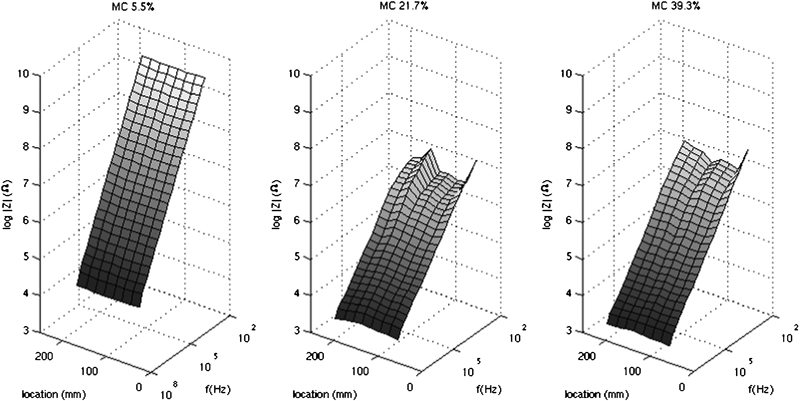
Impedance magnitude as function of location and frequency
The best correlation of Z magnitude with gravimetric MC was achieved at 1·2 MHz, correlation = −0·94. At moisture contents <FSP, lower frequency bands had better correlations with MC, the highest being −0·95 at 180 Hz. Impedance magnitude and phase responses are shown in Figs. 5–6; the phase response is affected by dispersion which results in non-linear responses.
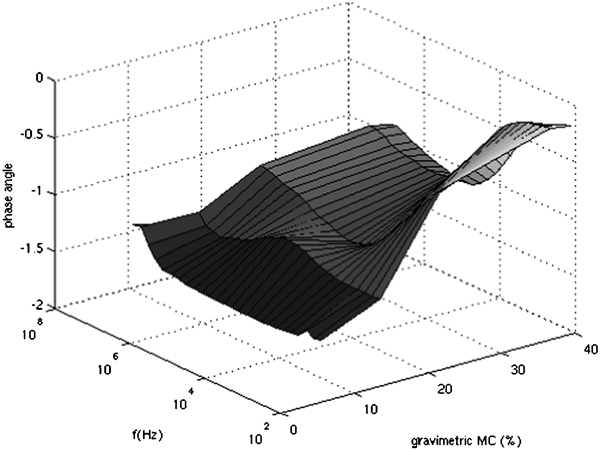
Phase angle as function of frequency and gravimetric MC
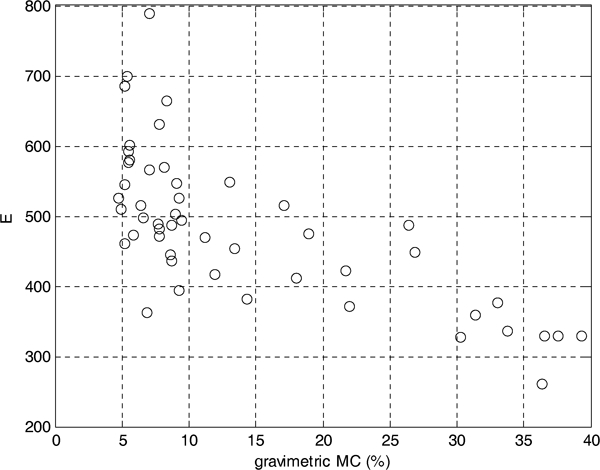
Ultrasound measurement, through transmitted E as function of gravimetric MC
Ultrasound
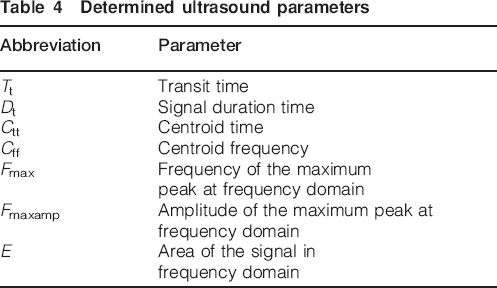
Several ultrasound parameters representing the time, energy and shape of the signal were determined (Table 4). The correlation coefficients between ultrasound parameters and gravimetric MC are presented in Table 5 Tables 5 and 6. Overall, the correlations between MC and through transmission measurement were higher than those between MC and reflection. The energy-related parameters, e.g. Fmaxamp and E, were correlated strongly with MC in through transmission set-up, especially for measurements above FSP (Table 6). At MCs lower than FSP, the correlations for through transmission were weaker.
Determined ultrasound parameters
Correlations between ultrasound parameters and MC*
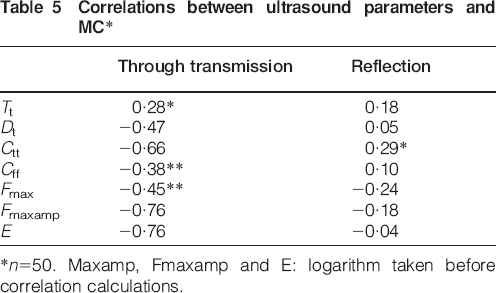
*n = 50. Maxamp, Fmaxamp and E: logarithm taken before correlation calculations.
Correlation coefficients between ultrasound parameters and MC, in two MC classes
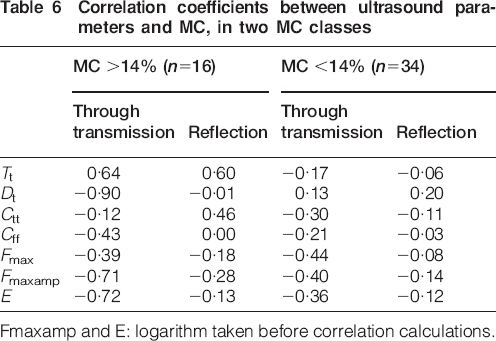
Fmaxamp and E: logarithm taken before correlation calculations.
Multiple regression analyses
Ultrasound and EIS results were also studied together. Compared with a model based on a single impedance parameter, a model with impedance and ultrasound parameters was slightly better for measurements below FSP and considerably better for the measurements above FSP (Table 7).
Impedance and ultrasound models for gravimetric MC
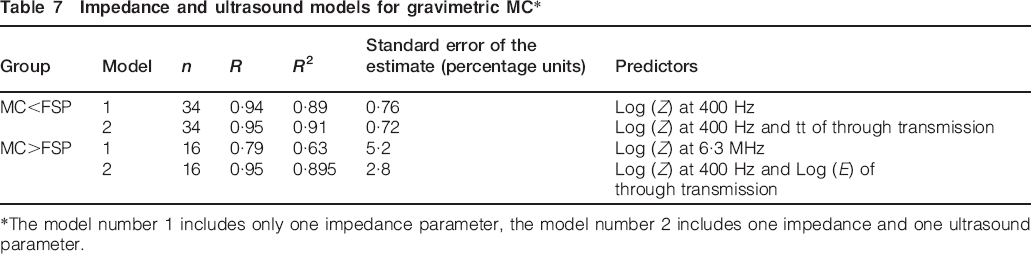
*The model number 1 includes only one impedance parameter, the model number 2 includes one impedance and one ultrasound parameter.
Discussion
The material properties of TMT are different compared with conventionally dried wood and thus the responses of the non-destructive evaluation methods were also different. Two commercial moisture meters were tested and also new techniques were introduced to achieve better understanding of the MC measurement of TMT. One major issue was the effect of moisture gradients inside each sample, especially within those specimens exposed to rain. It is known that a moisture gradient affects all the methods, though the effect is different for each method. Thus multi-sensor arrangement may be used to achieve better results when a high moisture gradient is present. When comparing R2 values for all measurements and below FSP, the results are not easily comparable since the number of samples is smaller for the latter group.
In this study, it could be seen that conventional hand meters were not readily calibrated for TMT and the measurement range of these methods was small due to lower FSP. The readings of capacitance meters are affected by the density of the wood but the resistance meters are not (Forsén 2000). For the resistance measurements, nearly all estimations of MC were higher than the MC as determined by the gravimetric method. In case of the covered sample, the MC values that were determined during the last measurement date were consistently lower than expected when compared with the oven-dry method. A possible explanation is the lower relative humidity in the laboratory at this measurement date, which causes the surface of the wood to dry out whereas the bulk MC is relatively small.
Even in case of dielectric measurement, some longitudinal moisture gradient could be detected at higher gravimetric bulk MC values. The slope for all groups is below one due to lower density of TMT. Since TMT has a lower hemicellulose content and a lower percentage of amorphous cellulose, which both have relatively high dielectric constants, the deviation from gravimetric MC values seems larger than can be explained by lower density of TMT alone.
In EIS analysis, the phase responses were non-linear in respect of both measurement frequency and MC. The responses of logarithmic impedance modulus did not have such non-linearity. The non-linear response can be partly explained by the dispersion effect, which is also present in conventionally dried wood. Different concentrations of amorphous and crystalline molecules in TMT lead to different frequency responses in the impedance spectrum compared with normally dried wood. Thus, the impedance analysis might be useful also in optimising the properties of TMT.
The energy-related parameters of ultrasound (maximum amplitudes and energy of the signal) were correlated strongly with MC. The sample dimensions increase as a function of MC up to FSP, and the hygroscopic swelling of the samples might explain part of the correlation. However, above FSP, there was also correlation between MC and energy-related parameters, even though the dimensional change is negligible in this MC range. Especially above the FSP, air-coupled ultrasound might be a good choice for MC measurement.
Multiple regression analysis showed that a combined method of EIS and ultrasound for the measurement of MC could be useful, especially at MCs above the FSP. In the method, both electric and mechanical properties of TMT have an effect on the MC response. The effect of moisture gradient is different on the properties measured by these methods and thus it should lead to more accurate MC analysis.