
Abstract
In this study, solid Scots pine was surface densified in an open press using different moisture contents (9·6 and 12·4%), temperatures (150 and 200°C), press closing times (0·5 and 5 min), holding times (1 and 10 min) and compression ratios (6·7 and 25%). The characteristics of the formed density profiles were defined and their correlations to the process parameters and Brinell hardness and elastic recovery were analysed. Compression ratio and closing time had the strongest effect on the formation of the density profile, as well as the hardness and elastic recovery. The amount of localised deformation (peak area) did not have significant effect on the Brinell hardness or elastic recovery, whereas, the highest density achieved (peak density) and its location (peak distance) dominated the effect. Brinell hardness and elastic recovery were found to correlate well with each other.
Introduction
As a hydrophilic, polymeric material the properties of wood are dependent on its moisture and temperature with two different states being recognised; a glassy, hard and brittle state and a soft, rubbery state. Between these two states there is a transition zone, where the glass transition temperature Tg defines the approximate point of softening. This can be measured for the main constituents of wood: cellulose, hemicelluloses and lignin. Wood softening at high moisture content is mainly thought to be dependent upon the lignin structure; especially the high content of side groups like methoxyl groups which give a low degree of cross-linking and therefore low wood glass transition temperature (Olsson and Salmén 1997). According to Salmén (1982) the estimated Tg for lignin is 100°C at ∼10% moisture content, whereas, spruce and maple woods exhibit signs of softening even below 100°C at 10% moisture content (Kelley et al. 1987). Defining the Tg for isolated wood components is, however, highly dependent upon the isolation procedure, measurement technology and conditions (Irvine 1984).
Knowledge about the softening behaviour of wood is widely exploited during the manufacture of wood based products, including in processes such as veneer peeling, pulp manufacturing and the so called thermo-hydromechanical (THM) treatment of wood. THM processing is a modification method in which moist wood is mechanically compressed at high temperature to reduce its porosity and obtain greater density. Density is known to correlate well with the mechanical properties of wood and thus, it might be useful to increase the density of otherwise low density wood species by THM. Several THM processes have been developed, however, at the present time there are a limited number of commercial products available.
Density profile analysis is a general method applied to wood based panels such as particleboard or medium density fibreboard (MDF). The density profile of the panel is formed during hot pressing with different process parameters affecting the shape of the profile. The shape of the density profile affects the properties of the end-product, such as hardness or bending strength (Wong et al. 1998, 1999, 2000). Thus, it is important to control the density profile formation for optimised properties.
Density profile analysis has not been widely applied to densified solid wood since it has been mainly carried out with the aim of compressing the whole thickness of the sample, pursuing a uniform density profile through the thickness. However, there is interest in using localised material modification to improve specific properties. By increasing the density of only the first few cell layers instead of the whole thickness, most of the sample remains unchanged and less energy is used in the process, while at the same time the required property improvements are achieved.
Density is known to correlate well with hardness which is an important measure for potential applications for surface densified wood, such as flooring boards or worktops, where only one surface is generally exposed to use. In this case, as the target is to increase the density in a specific part of the wood, density profile analysis is a key method of finding the optimal process parameters for the desired end-use properties.
The positive effect of wood surface densification on hardness has been reported previously by, for example, Gong et al. (2010) and Inoue et al. (1990; 1993). Furthermore, the properties of densified wood have been found to be strongly dependent on the parameters used in the process. For example, hardness has been improved with increased compression ratio (Lamason and Gong 2007; Rautkari et al. 2009), shorter closing time (Laine et al. 2012) and increasing the process temperature from 120 to 150°C (Unsal and Candan 2008) and from 150 to 200°C (Laine et al. 2013a). However, a temperature increase from 160 to 220°C has also been found to have a slight negative effect on hardness (Fang et al. 2011) which might be due to minor thermal degradation at high temperatures.
The purpose of this study was to analyse the effect of selected process parameters on the formation of the density profile, Brinell hardness and the elastic recovery of surface densified solid wood. The density profile characteristics are defined from the patterns of the density profiles using numerical analysis and, furthermore, the correlations between the process parameters, density profile characteristics and hardness are analysed. Previously, it has been suggested that process parameters have complex effects on wood deformation (Rautkari et al. 2011b). This study approaches the issue in a more detailed manner using computational methods to better understand the phenomenon related to wood deformation under compression.
Experimental
The wood material used in this study was clear Scots pine (Pinus Sylvestris L.) sapwood specimens sized 55 mm (tangential)×140 mm (longitudinal)×20 mm or 16 mm (radial) with an average density [relative humidity (RH) 65%, 20°C] of 530 kg m−3. Densification was carried out by compressing the samples against a heated platen installed in a universal testing machine (model Zwick 1475), further described by Rautkari et al. (2011b). Heating only one platen in compression softens, and thus, deforms only that side of the sample. The target thickness was controlled with metal stops, and, to set the deformation, the system was cooled with a bespoke water cooling system to below 100°C before releasing the load. The samples were compressed from an original thickness (radial) of 20 or 16 mm to a target thickness of 15 mm, giving compression ratios (CR) of 25 and 6·7% respectively. Before compression the samples were conditioned at RH 35 or 65%, giving moisture contents (MC) of 9·6 and 12·4% respectively. The process parameters included two holding times (1 and 10 min), two temperatures (150 and 200°C) and two closing times (0·5 and 5 min). After densification, the samples were conditioned (RH 65%, 20°C) for at least 1 month and specimens sized 50 mm (longitudinal) by 50 mm (tangential) (thickness remained constant) prepared for the density profile analysis and the other part of the sample used for the hardness measurement.
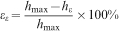
The Brinell hardness was measured according to EN 1534 with minor modification described by Rautkari et al. (2011a). A steel ball with a diameter D of 10 mm was applied in the radial direction with nominal 1 kN force F. Instead of measuring the diameter of the indentation manually as defined in the standard, the maximum depth of the indentation h was measured automatically. Such adaption was made because manual measurements are less accurate and rather laborious. Brinell hardness HB was calculated with equation (1)

The through thickness density profile was measured at intervals of 0·1 mm through one position across the entire width of the sample, using an ATR Density Profilometer DPM201 (1995) which operates using a gamma ray source as described by Rautkari et al. (2011b). Thus, each density value is the average of the density through the width of the sample.
The density profiles were numerically analysed using computational methods in Matlab R2012a. Figure 1 presents the variables used in the analysis and they partly follow a previous density profile analysis performed for particleboard (Wong et al. 1998). The mean density MD is the average density value through the sample thickness and peak density PD was recognised as the highest density value in the profile. Peak distance Pdi denotes the distance of the peak density from the densified surface while peak base Pb describes the width of the deformation and is measured as the crossing of the peak and the MD drawn through the profile. Peak area PA describes the total amount of localised deformation during compression measured as the area outlined by the peak and the MD value drawn through the profile.
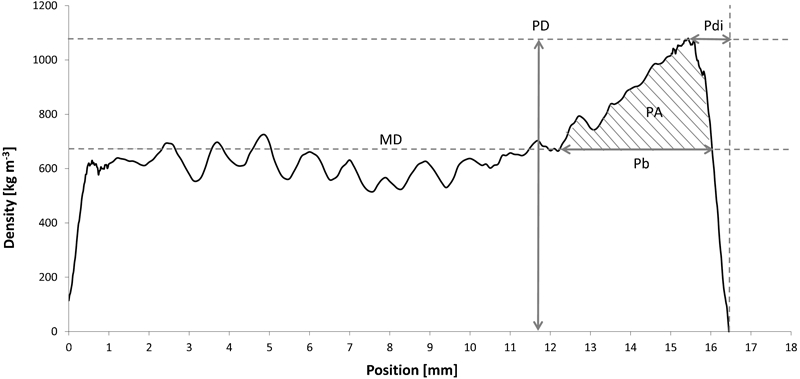
The variables in the through thickness density profiles used for Matlab analysis
Furthermore, Pearson correlation analysis was used to analyse linear dependency of process parameters and the density profile characteristics with the Brinell hardness and elastic recovery of surface densified wood.
Results and discussion
Density profile analysis
In a previous study, process parameters were found to have a strong influence on density profile formation in surface densified wood (Rautkari et al. 2011b) which was also the case in this study. Table 1 presents the correlation between the process parameters and density profile characteristics and the correlation among different density profile characteristics. Correlation among process parameters were insignificant (<0·1), and thus, left out from the matrix to keep the analysis and visualisation more comprehensible. In this study, the process parameters with the highest significance to the density profile formation were CR and closing time. Table 1 shows that a higher compression ratio produces a higher PD and MD (see Fig. 1) with correlations of 0·65 and 0·76, respectively. Changing the CR from 6.7 to 25% the average PD value was increased by 19%; from 778 to 924 kg m−3. Similarly, the increase for MD was 22% from 474 to 580 g cm−3. These results are expected, since with a higher CR a larger portion of the sample is deforming thus enabling higher PD and MD values, which was also noted by Rautkari et al. (2013). In Table 1 the rather high correlation 0·81 between PD and MD is natural because higher peak density increases the average density value too.
Correlations between process parameters and density profile characteristics and correlations among density profile characteristics: higher correlations (> 0.50) are marked in bold
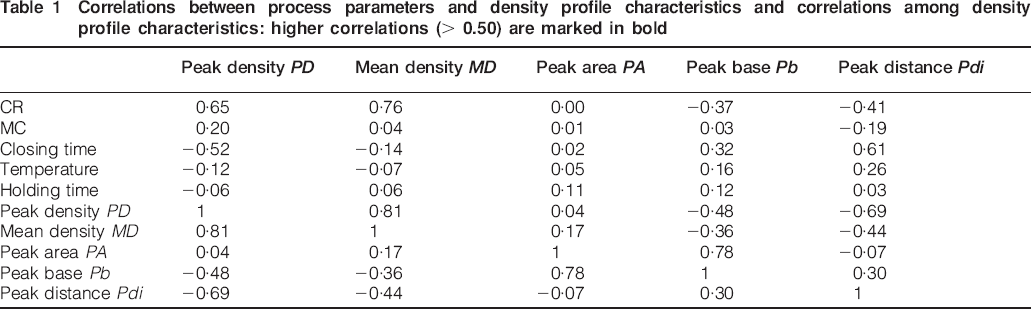
Reducing the closing time from 5 to 0·5 min increased the average PD value by 15% (from 792 to 907 kg m−3). The effect of closing time is most likely related to the viscoelastic properties of wood and heat transfer during press closing as the moisture is migrating deeper and the sample drying on the surface. When the press is closed at a slower rate (closing time 5 min) the wood is deforming from the inner layers as the longer time enables wood softening from the core. This means that wood deformation depends on the time and speed of loading as well as wood moisture content and temperature. A similar effect is also seen in the Pdi values, as the average peak distance from the surface is increased by 107% (from 3·0 to 6·2 mm) when changing the closing time from 0·5 to 5 min. The depth of the deformation can also be described with the Pb value and similarly, it increases by 26% (from 9·1 to 11·5 mm) as the closing time is prolonged. Wong et al. (1998) also found that faster closing increases PD but reduces the Pdi and Pb values.
The relatively high correlation of 0·78 between PA and Pb in Table 1 is expected, since the Pb value determines part of the PA value (see Fig. 1). Furthermore, Pdi and PD have a −0·69 correlation, which suggests that as the peak is further from the densified surface, it is also lower. The correlation between PD and Pb is −0·48, which signifies that wider deformation results in lower density peak, which supports the previous finding on the correlation between PD and Pdi. In the case of particleboard, Pdi and Pb were found to correlate significantly (0·99 significance level) with each other (Wong et al. 1998). However, in this study Pb and Pdi have a 0·30 correlation which means that when the peak is further from the surface, the extent of the deformation through the thickness of the sample might be rather narrow. Thus, in some cases there is a portion at the very surface of the sample that has not been deformed while the inner layers of the sample are densified. This supports the earlier speculation that the samples are most likely drying at the heated surface and at the same time heat is transferred through the inner layers of wood thereby softening the core.
The thermal conductivity properties of wood possibly influence the deformation behaviour of wood in this case. Thermal conductivity is known to be influenced by several factors, such as wood species and grain angle (Yapici et al. 2011). Higher density increases thermal conduction (Wangaard 1940), nevertheless, as the cell wall material is expected to have a constant density of ∼1500 kg m−3, the wood microstructure, especially porosity (diminished conduction through voids), has been found to dominate (Suleiman et al. 1999). The void space in the densified area is reduced, which has been recognised by Kutnar et al. (2009), and therefore, conductivity is possibly increased through the closed cell walls. As the closing time is short, the voids are closed faster, possibly concentrating the temperature increase in a smaller area. On the other hand, diminished void space could transfer the heat deeper into the sample as the voids are instantly closed and heat travels through the collapsed cell walls. However, when it comes to thermal conductivity, the dominating effect of closing time is more likely related to the actual time that the wood is exposed to heat which is 10 times more in the case of the longer closing time (5 min) compared to the shorter one (0·5 min).
Hardness and elastic recovery
It was found that, besides the density profile formation, the process parameters also have a significant effect on the Brinell hardness of surface densified solid wood. The average hardness values according to the process parameters are presented in Table 2 where higher hardness values are marked in bold. Table 2 shows that the highest hardness values are obtained especially when the CR is higher (25%) and closing time shorter (0·5 min). The significant effect of closing time has been previously reported by Laine et al. (2012) and also higher compression ratio has been found to improve the hardness of surface densified wood (Laine et al. 2013a; Lamason and Gong 2007; Rautkari et al. 2009).
Average (10 samples, five indentations on each) Brinell hardness values (N mm−2) according to different process parameters: higher hardness values (> 17.0) are marked in bold
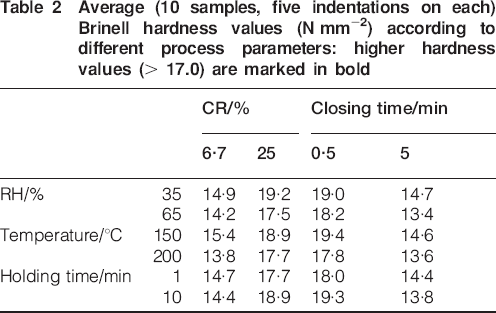
Figure 2 shows the clear relationship between Brinell hardness and the elastic recovery of surface densified wood. This may also be seen from Table 3, where the average correlation between elastic recovery and hardness is 0·76. A strong relationship between hardness and elastic recovery has previously been observed by Rautkari et al. (2009, 2011a) and Laine et al. (2013a). It can be concluded that when the surface is more resistant to point loads, it also recovers from them more easily. Comparing the differentiated dots for closing times 0·5 and 5 min in Fig. 2, it is possible to find higher hardness and elastic recovery values for the shorter closing time. This finding supports the earlier analysis on the significance of closing time on the density profile formation.
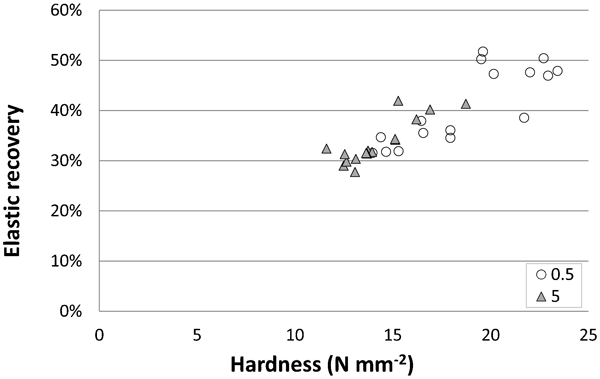
Effect of Brinell hardness on elastic recovery of densified wood: every point is average of 10 samples with five indentations on each sample
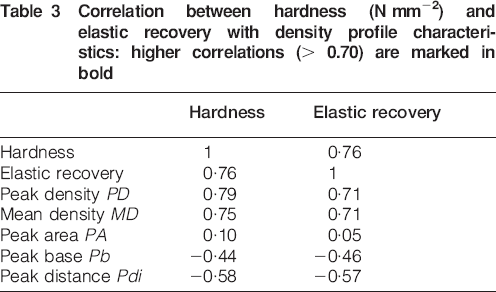
Correlation between hardness (N mm−2) and elastic recovery with density profile characteristics: higher correlations (> 0.70) are marked in bold
Hardness and density profile characteristics
Table 3 exemplifies the relatively significant correlations of PD and MD with the hardness and elastic recovery. This is to be expected since hardness is known to correlate well with density. Pb and Pdi also seem to correlate quite well with hardness and elastic recovery, however, the correlation is negative; the wider the peak and the further it is from the surface, the lower the hardness and elastic recovery. This result is expected, since Brinell hardness is measured from the very surface of the sample, approximately 1–3 mm deep, and as the peak is moved further, the hardness is not being measured at the point of the highest density. In addition, a high Pb value indicates that the deformation has occurred over a larger portion of the sample thickness, presenting a lower peak density and thus, lower hardness. PA, on the other hand, describes the total amount of the localised deformation but does not consider the shape or place of the peak, and thus, has very limited correlation with the hardness (0·10).
In this study, PD was found to have a significant effect on Brinell hardness and elastic recovery of surface densified solid wood. Figure 3 describes the phenomenon in a more detailed manner as all the recorded PD values from this study are separated into five equally divided segments. Unsurprisingly, the hardness and elastic recovery increase as PD increases in every segment.
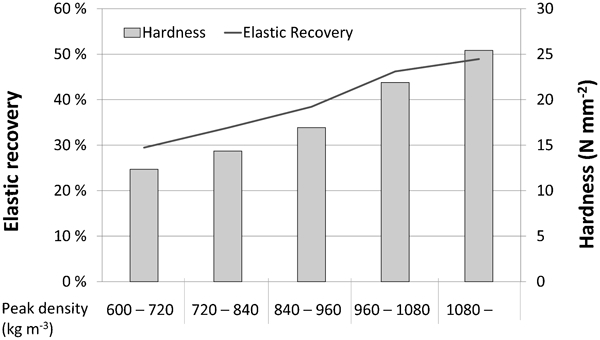
Hardness and elastic recovery according to different PD values
If the target is to improve the surface hardness of solid wood by densification, aiming only for high density peak is not sufficient for obtaining the highest hardness value. The location of the peak should also be controlled, since Pdi was found to have a significant effect on the Brinell hardness, which is further presented in Fig. 4. The correlation value in Table 3 is −0·58 which indicates that the greater the distance from the surface, the lower the hardness. In a similar way to Fig. 2, the effect of closing time is presented in differentiated dots in Fig. 4, showing that a shorter closing time results in the peak being closer to the sample surface and thus, giving higher hardness values.
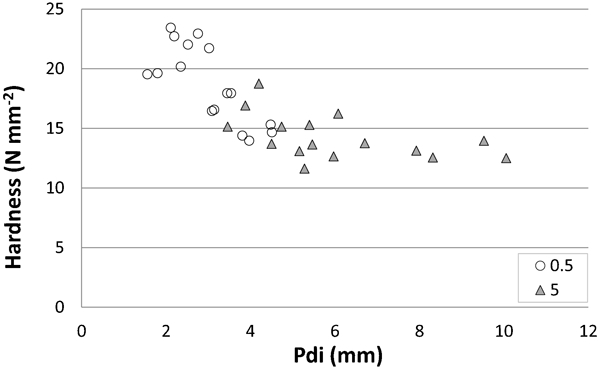
Effect of Pdi on Brinell hardness of densified wood: every point is average of 10 samples with five indentations on each sample
If further processing of surface densified solid wood requires, e.g. sanding after compression, it might be beneficial to have the highest peak slightly deeper from the surface as the first layers are removed. However, the authors have found that as the very surface of the sample has deformed, it becomes very smooth and pleasant to touch and also reduced wettability has been reported (Kutnar et al. 2012; Rautkari et al. 2010) for such surfaces. This might be because of the extractives migrating to the surface during densification (Rautkari et al. 2012), and therefore, the need to sand or treat the surface could even be reduced with this treatment. The process still needs further development for industrial scale manufacturing, since; the deformation will recover when the wood is exposed to moisture. However, this set-recovery phenomenon can be eliminated by, for example, thermal modification after compression (Laine et al. 2013b). Indeed, specific property requirements for the material need to be considered separately for different applications.
Conclusion
Density profile analysis has been traditionally applied to wood based panel manufacture; however, the current study confirms the significance of this method applied to surface densified solid wood as well, since the density is increased locally through the wood thickness. It was found that the process parameters, especially closing time and CR, significantly affect the through thickness density profile formation of surface densified solid wood. With higher CR PD and MD were higher (correlations 0·65 and 0·76 respectively) and with shorter closing time PD was higher and Pdi smaller (correlations 0·61 and −0·52 respectively). Higher PD and MD values and lower Pdi values also resulted in higher Brinell hardness and elastic recovery. Furthermore, Brinell hardness and elastic recovery correlate rather well with each other (correlation 0·76). It can be concluded that the amount of localised deformation (PA) did not have a strong effect on the Brinell hardness or elastic recovery, while the location and height of the density peak (Pdi and PD) dominated the effect.
Footnotes
Acknowledgements
The researchers would like to acknowledge Mr Nick Laflin of the BioComposites Centre, Bangor University, UK and Miss Cara Leitch for technical support in this study.