
Abstract
Tannins are the natural substances that plants use to protect wood. Novel tannin based formulations were tested to evaluate their efficacy in preventing weathering degradation of the surfaces. Scots pine and European beech specimens were treated with flavonoid based wood preservatives and exposed to artificial and natural weathering. The surface properties of the samples before and after weathering were evaluated using contact angle and colour measurements. Tannin treated samples showed a moderate resistance against discoloration and greater wettability than untreated samples. ATR-FT-MIR and FT-NIR spectroscopies combined with principal component analysis (PCA) revealed that weathering mainly degrades the aromatic component of wood. Because the protective tannin network is nothing more than an aromatic polymer, it suffers a similar degradation of lignin. Although the higher amount of aromatics leads to higher degradations, it is still possible to observe via vibrational spectroscopies that the flavonoid enriched surfaces contain more aromatics also after weathering.
Introduction
The term weathering encompasses an ensemble of factors that affect wood surfaces exposed outdoors. The main feature that restrains architects from using wood outdoors is its poor durability. But weathering resistance and durability are connected because in most of the cases in which the wood is used outdoors the wood surface has to retain its mechanical and aesthetical properties (Feist and Hon 1984; Broman 2000; George et al. 2005; Arndt 2006; Grüll et al. 2006).
Nowadays, the use of chlorine free aromatic systems for the photoprotection of wood is increasing. On the one hand, the protection via phenolic resins (Lewis, 1995; Sudiyani et al. 1999; Evans et al. 2013) and on the other hand, the esterification of wood with aromatics (Evans et al. 2002; Jebrane et al. 2009) are very promising alternatives to heavy-metal based formulations. In this context, the use of natural aromatics such as flavonoid tannins assumes a role of great interest.
Condensed tannins are hydroxylated aromatic polymers that are used by plants as natural preservatives and antifungal agents (Zucker 1983). These polyphenols can be found in the outer tissues of the majority of wood species (Laks et al. 1988) and they can be industrially obtained by simple water extraction (Hagerman 1988; Sealy-Fischer and Pizzi 1992). Some research groups have considered using tannin or polyphenolic surface protective agents as wood preservatives. Most of these formulations provide good results except in wet conditions due to the high water solubility of tannins (Sen et al. 2009; Bernardis and Popoff 2009; Tascioglu et al. 2012; Singh and Singh 2012).
According to their chemistry, condensed tannin can produce polymers when combined with bifunctional chemicals such as glyoxal, formaldehyde and hexamine (Pizzi 1994). Following this idea, tannin based wood preservatives capable of polymerisation in situ were formulated and their effect on wood properties was studied in detail (Thevenon et al. 2009). The development of these polymeric tannin formulations prompted a re-evaluation of the durability of tannin treated wood in wet conditions where leaching occurs (Tondi et al. 2012a) and under mechanical and fire stresses (Tondi et al. 2012b). These formulations showed an overall positive outlook. However, the only parameter which indicated contradictory results was the behaviour during artificial and natural weathering tests (Tondi et al. 2012c).
For these reasons, in this work, a study of the surface degradation of some tannin treated wood is presented, compared with untreated specimens. Contact angle, CIELAB colour system, ATR FT-MIR and FT-NIR spectroscopy have been used to explain the reasons for the poor weathering properties, analysing the physical and the chemical properties of the exposed surfaces.
Experimental methods
Materials
Pieces of Scots pine (Pinus sylvestris L.) and European beech (Fagus sylvatica L.) were provided by two different Austrian sawmills and selected in accordance with EN 113 (1997). Wood samples measuring 150×75×20 mm (L,T,R) were cut after 1 week of conditioning at 65% relative humidity and 20°C.
Mimosa tannin (A. mearnsii) extract was provided by Silva Chimica (Italy). The other chemicals such as: hexamethylentetramine (hexamine), boric acid and sodium hydroxide were supplied by Lactan.
Impregnation of sample
Wood samples were dried at 103°C for 3 days before they were impregnated, using a vacuum-pressure system (800 Pa vacuum for 30 min) and by dipping in tannin solution for 24 h under ambient conditions (Tondi et al. 2013).
The wet samples were kept for at least 12 h at 103°C to allow the tannin hexamine resin to harden in situ and they were then stored in a climatic chamber until the equilibrium moisture content reached 12%.
Tannin impregnation solutions were prepared with 10% and 20% (w/w) of mimosa extract in a solution containing 5% (w/w to tannin) of boric acid. The pH of these solutions was always corrected with 50% NaOH at a pH of 9. Finally, 6% (w/w to tannin) of hexamine was added.
Artificial and natural weathering
Series of four samples of treated and untreated Scots pine samples were exposed to artificial and natural weathering.
Artificial weathering was carried out in a QUV/spray accelerated weathering tester (Q-Panel Lab Products, Cleveland, OH, USA). The exposure cycle started with a condensation phase (24 h), followed by short intervals of UV light (2·5 h) with UVA-430 lamps and water spray (0·5 h) according to EN 927–6 (2006). The duration of the artificial weathering test was 955 h.
The natural weathering test was performed by fixing the untreated and the tannin treated specimens to a weathering rack inclined at 45° to the vertical (south exposed), in Kuchl (Austria) for 158 days.
Contact angle measurements
Conditioned wood samples were positioned in the sample compartment of a contact angle measurement device. A distilled water drop was placed on the surface of each sample and a series of pictures was taken with a Nikon D200 (10·2 Mpix) (with 12–24 mm DX Nikkor lens) from 1 s up to 120 s. The test was always done with the wood grain oriented perpendicular to the line of the camera. The contact angle of a water droplet was determined measuring the width and the height of each droplet using XnView software version 1.98.8.
Colour measurements
Wood colour was measured with a Mercury 2000 spectrophotometer (Datacolor) and quantified according to the CIELAB space system with CIE standard illuminates D65 and 10° standard observer.
Colour coordinates, L, a* and b*, were measured before, during and after exposure. Nine measurements per sample were taken.
ATR FT-MIR
The surfaces of the Scots pine and European beech samples were analysed with a Perkin-Elmer Frontier FT-MIR (Middle infrared) using an ATR (Attenuated total reflectance) Miracle diamond crystal accessory. The spectra used 64 scans with a resolution of 8 cm−1 in the wave number range between 4000 and 600 cm−1.
The FT-MIR spectra used for analysis of the weathering effects were normalised with respect to the band at 897 cm−1. The chosen band at 897 cm−1 was assigned to C1–H deformation and ring valence vibration of carbohydrates (Schwanninger et al. 2004a). The fingerprint regions (800–1800 cm−1) of the normalised and second derived FT-MIR spectra were used for the principal component analysis (PCA). The second derivatives were calculated using the method of Savitzky and Golay (1964) by means of a second order polynomial with a 17 smoothing point filter (Bächle et al. 2010). The PCA was performed by the software Unscrambler (Camo).
FT-NIR
The surface of the wood specimens was also analysed with a near infrared spectrometer (Bruker MPA) equipped with a fibre probe (4 mm measurement diameter). The spectra were obtained using 32 scans with a resolution of 8 cm−1 in the wave number range between 12500 and 4000 cm−1. The OPUS 5·5 software (Bruker) was used for the spectra processing using baseline correction and vector normalisation methods. Second derivate of the spectra function in the range between 7600 and 4500 cm−1 was applied to improve the performance of modelling with the same algorithm used for the FT-MIR spectra. The PCA was performed by the software Unscrambler (Camo).
Results and discussion
Contact angle
The water absorption of the unweathered surfaces was low and a measurable contact angle was present for more than 2 min. Conversely, weathered wood surfaces were more permeable and the water droplets were quickly absorbed. Hence, contact angles were measured after 1 s (Fig. 1).
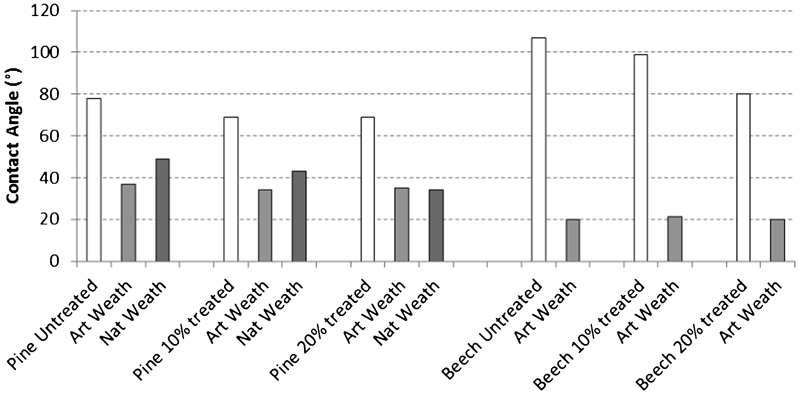
Contact angles of untreated and tannin treated Scots pine and European beech samples: measures collected 1 s after deposit of water droplets
Figure 1 shows clearly that after weathering, the contact angle decreases. Kalnins and Feist (1993) concluded that weathering of wood increased the wettability by reducing the water repellent effect of extractives and degrading the hydrophobic components of wood (lignin). Consequently, the wood surface becomes richer in hydrophilic holocelluloses. Also microcracks caused by the weathering (Kučera and Sell 1987; Kuo and Hu 1991; Evans et al. 2008; Kishino and Nakano 2004) may influence wettability due to a better penetration of the liquid into the surface. In particular, this effect is more marked for the European beech samples which show a more hydrophobic surface before weathering and a more hydrophilic surface after artificial weathering.
Comparing the two types of weathering systems, it can be observed that artificial weathering degrades all the samples to the same extent. The measurements made after natural weathering indicated that the treated Scots pine samples were more degraded than the untreated ones. Such behaviour can be explained by the continuous dimensional stress occurring when the weather conditions change. The already stressed specimens containing tannin polymer are more sensitive to this phenomenon and produce microcracks more easily.
It was also noted that the contact angles of the untreated surfaces before weathering always showed higher contact angles than the samples treated with tannin. This phenomenon can be explained considering that the contact angle is influenced by two phenomena: (1) the penetration and (2) the spreading of the drop (Huang et al. 2012). It is a fact that the tannin hexamine network decreases the wettability/gluability of the treated surfaces and also increases the resistance to leaching, so that the water cannot easily penetrate the wood. Therefore, the smaller contact angle registered for tannin treated samples can be attributed mainly to the spreading of the droplet.
Both effects, namely, the presence of a higher amount of microcracks and the predominance of spreading of the drop clarify the higher decrease of contact angle for tannin treated specimens.
This observation suggests that the surface of tannin treated samples starts to degrade first, but it does not depict the degradation process completely.
Colour measurements
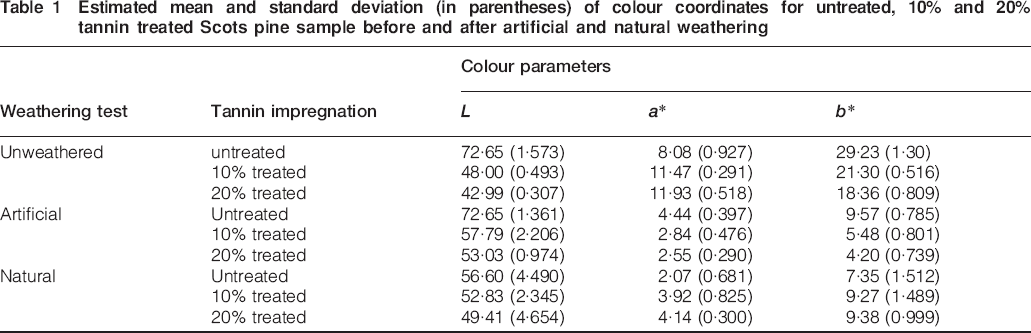
The colour of the surface was investigated according to the CIELAB space colour analysis and the main results for Scots pine and European beech are reported respectively in Tables 1 and in 2.
Estimated mean and standard deviation (in parentheses) of colour coordinates for untreated, 10% and 20% tannin treated Scots pine sample before and after artificial and natural weathering
Estimated mean and standard deviation (in parentheses) of colour coordinates for untreated, 10% and 20% tannin treated European beech sample before and after artificial
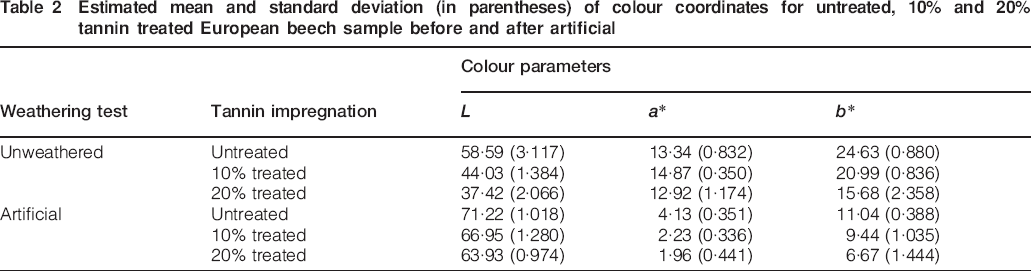
Before weathering, wood samples treated with tannin were darker and more brownish than the untreated ones. This is clearly underlined by the lower value of L which represents the lightness, by an increase in the red component a* and by a decrease in the yellow component b*.
After weathering, untreated samples became grey. This is confirmed by the fact that the a* and b* values decreased, the colour intensity faded due to weathering, while L increased.
With both wood species, artificially weathered untreated samples were very light. This phenomenon is associated with delignification of surfaces, their enrichment with cellulose (Feist and Hon 1984) and the absence of mould fungi and industrial pollution.
The lightness of the weathered samples treated with tannin is slightly lower than that of the untreated ones. This suggests that at least one part of the tannin polymer resists weathering.
Combining these results with contact angle measurements, it appears that the tannin was still present on the surface after weathering, but the tannin treated samples were rougher.
ATR FT-MIR
Chemical information related to treated and untreated Scots pine surfaces before and after weathering was obtained using ATR FT-MIR spectroscopy. Figure 2 shows the spectra in the region (1800–800 cm−1) of untreated (Fig. 2b) and 20% tannin treated (Fig. 2a) samples before and after artificial weathering.
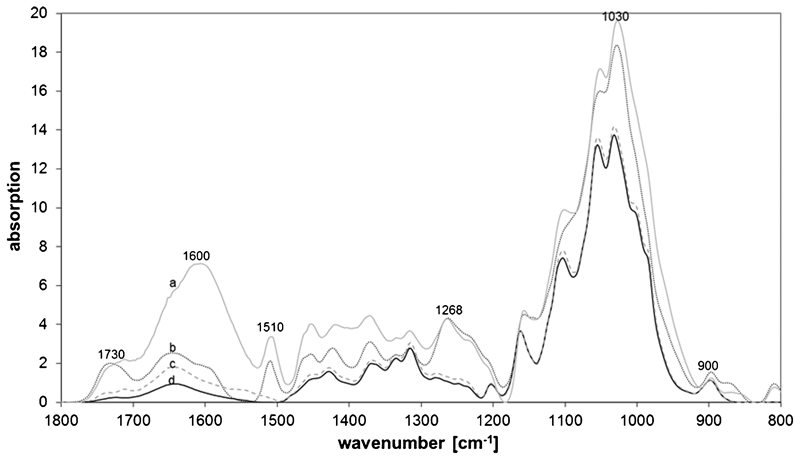
Absorbance FT-MIR spectrum of untreated and 20% tannin treated Scots pine samples before artificial weathering
The spectrum of the untreated Scots pine (Fig. 2b) compared with the spectrum of the artificially weathered untreated samples (Fig. 2d) show decreases in peak at wavenumber 1600 and 1510 cm−1 degradation of lignin while the signals of the holocelluloses are more distinct, namely, 1160, 1105, 1060, 1040 and 900 cm−1 (Evans et al. 1992; Faix and Németh 1988; Feist and Hon 1984; Hon and Chang 1984). This result is perfectly in line with the vibrational spectroscopy results achieved by many other research groups (Tolvaj and Faix 1995; Colom et al. 2003; Schwanninger et al. 2004a).
The degradation of aromatics in tannin treated wood during weathering is pronounced. The region between 1700 and 1500 cm−1 not only includes the main signals of lignin, but it also represents the area in which the signals of tannin are stronger (1650 and 1584 cm−1). The peaks in this area maintain a slightly higher intensity after weathering. This suggests that the presence of additional tannins allows a certain amount of lignin/tannin to remain present in weathered wood surfaces.
The results of previous studies indicate that the higher lignin content causes a rapid induction of the degradation process of wood (Hon and Feist 1981; Kuo and Hu 1991). Also the tannin polymers are aromatic and therefore, it is reasonable to expect a similar weathering behaviour to the one of lignin. This is consistent with the decrease in lignin and tannin peaks at around 1600 and 1510 cm−1 during the weathering test. This effect could be due to the fact that aromatic enriched surfaces absorb more UV light (Norrström 1969), which is synonymous with more energy absorption of wood (Hon 2001), resulting in a faster degradation process.
The analysis of the principal components PC1 and PC2 is reported in Fig. 3. In the score plots, the variance of the data explained by a PC is given in parentheses.
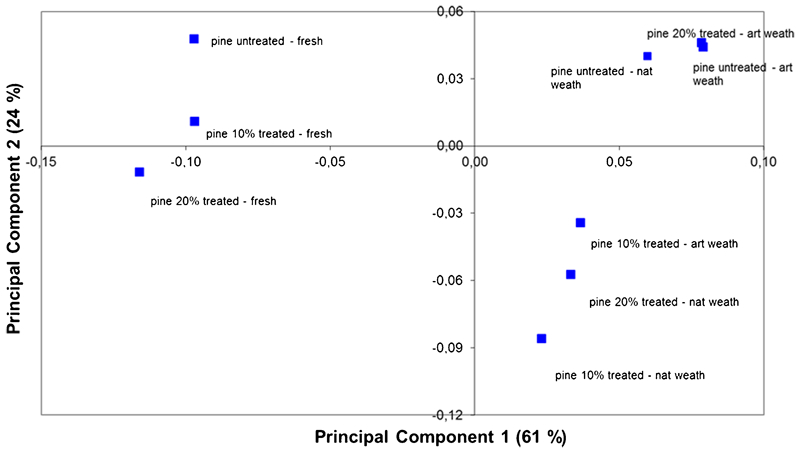
Principal component (PC) analysis score plot of FT-MIR spectra in second derivative mode for untreated and tannin treated Scots pine samples before weathering, after artificial weathering and after natural weathering
A separation among various groups of untreated and tannin treated, fresh and weathered measurements was obtained. The most remarkable result underlined by the PC1 is the lignin degradation due to weathering.
Indeed, the loadings plot of PC1 reported in Fig. 4 shows the highest positive value for the variable at 1510 cm−1, which corresponds to one of the most significant peaks for lignin (Schwanninger et al. 2004b, Windeisen et al. 2009).
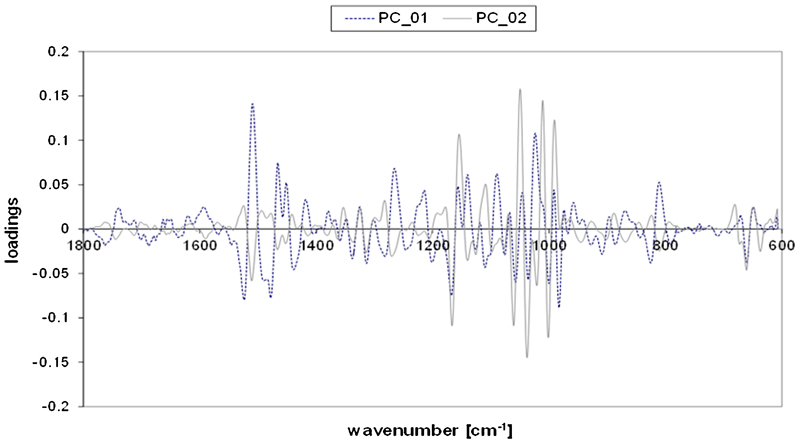
Loadings of first two principal components (PC) of FT-IR spectra in second derivative mode of untreated and tannin treated Scots pine samples before weathering, after artificial weathering and after natural weathering
The PC2 is more related to carbohydrates. The variables 1157 cm−1 (C–O–C valence vibration), 1051 cm−1 (C–O valence vibration), 1012 cm−1 and 992 cm−1 (C–O valence vibration) are characteristic signals of holocelluloses (Faix and Böttcher 1992; Hon and Chang 1984; Michell 1993; Owen and Thomas 1989). The negative values of PC2 registered for tannin treated samples suggest the presence of aromatic components.
The information obtained by FT-IR allows a clearer understanding of the chemical phenomenon of surface degradation. The data analysis through principal components confirms that the effect of weathering is evident: It affects the PC1 (61% of the variance) and indicates very significant distances between fresh and weathered surfaces (Fig. 3). The difference between tannin treated and untreated sample appears less marked. Even if a very good correlation can be observed between fresh samples and tannin concentration (lower PC2 value means higher tannin concentration), the PC2 cannot always distinguish this relationship after weathering.
FT-NIR
The FT-NIR spectra of tannin treated and weathered surfaces do not carry easy exploitable information about the chemical modification of the surface. For this reason, the NIR study of the surface has been monitored via principal components analysis.
Figure 5 states the distribution of the measures for the whole series of Scots pine specimens. Also in this case, the variance of the data explained by a PC is reported in parentheses.
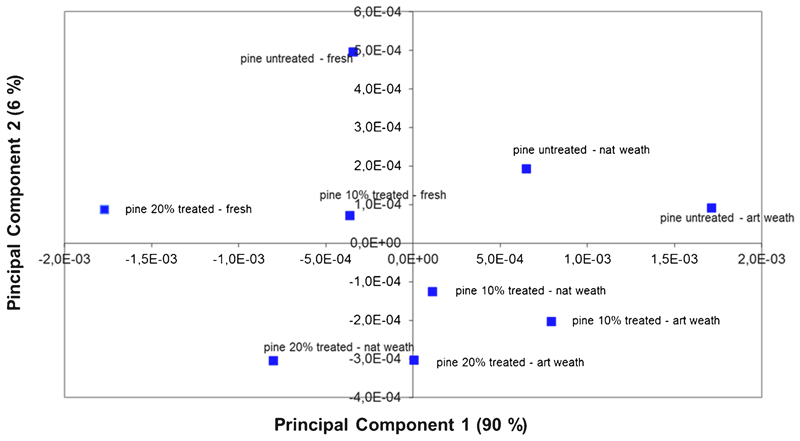
Principal component (PC) analysis score plot of near infrared spectra in second derivative mode of untreated and tannin treated Scots pine samples before weathering, after artificial weathering and after natural weathering
It can be observed that the two principal components allow us to distribute the spectra in a specific area of the two-dimensional chart.
At first, it is possible to observe that the fresh samples all lie on the same quadrant (negative part of the PC1 and the positive part of PC2). Weathering causes significant increases in the values of the PC1 and decreased values of PC2. This analysis also detects tannin. The simultaneous decrease of PC1 and PC2 suggests an increase of tannin on the surface (Fig. 5).
Even though the PC1 explained 90% of the variance, whereas the PC2 explains only 6% of the variance, the combination of the two components describes the two most important parameters: weathering and tannin concentration. This technique combined with the PCA allows us to distinguish the presence of tannin in two concentrations after weathering.
The loadings of the PCs provide information between each wavelength and the corresponding score plot of the principle components (Fig. 6).
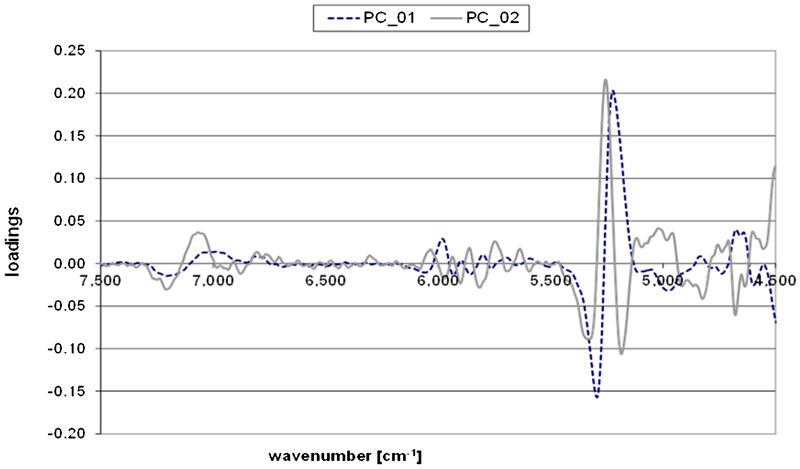
Loadings of first two principal components (PC) of near infrared spectra in second derivative mode of untreated and tannin treated Scots pine samples before weathering, after artificial weathering and after natural weathering
The loadings of the PC1 show high positive values for the variables around 5993 and 4682 cm−1, which represent aromatic vibrations. The band region around 5995–5950 cm−1 is the first overtone of aromatic skeletal C–H stretching vibrations (Osborne et al. 1993; Barton et al. 1992), and the band around 4690 cm−1 assigned to aromatic C–H and C = C stretching vibrations (Michell and Schimleck 1996; Osborne et al. 1993). In the loadings for PC2, contributions of the carbohydrate derived bands can be seen. The highest positive loadings are for the variables around 7070, 5029 and 4590 cm−1. The variable 7070 cm−1 assigned to cellulose (Tsuchikawa and Siesler 2003) as well as the variable 4590 cm−1 corresponding to cellulose (Michell and Schimleck 1996).
The highest positive loading is shown for wavenumbers at 5245 cm−1 (PC1) and 5256 cm−1 (PC2), which are assigned to OH stretching and OH bending vibrations of water, and wood components (holocelluloses and lignin) respectively.
Tsuchikawa and Sielser (2003) analysed in detail this wavelength area around 5000–4500 cm−1 for the OH absorption of the wood components. They concluded that at least six various absorption bands overlap in this region. Therefore, it was not possible to distinguish the multiple OH absorption due to holocelluloses, lignin and tannins.
However, the principal component analysis for Scots pine enables us to define whether the samples have been weathered or not. Even though the separation is not as defined as it is in the FT-IR spectra, in this case the two PCs are able to differentiate more clearly the tannin treated samples after weathering.
Tannin treated wood samples have similar behaviour to the untreated ones during natural and artificial weathering. The degradation occurs in the aromatic part of wood. Lignin signals in untreated wood are weakened after weathering, as is also the case in tannin treated samples. Nevertheless, it can be observed that the tannin treated surfaces maintain a certain amount of aromatics after weathering which can be directly observed via FT-MIR but also via FT-NIR through PCs.
A similar study has also been performed for European beech and the results confirm that ATR-FT-MIR allows us to monitor the weathering directly following the trend of signals at 1600 and 1505 cm−1, while the FT-NIR analysis requires a deeper investigation through PCA to interpret the effects of weathering and the concentrations of tannin on weathered surfaces.
According to the leaching tests carried out on these formulations (Tondi et al. 2012c), it appears that the loss of tannin polymer cannot be explained by simple leaching. Indeed, two other reasons have to be considered: (1) the aromatic enriched darker surface absorbs more light radiation (UV-vis-IR) and because the tannin polymers are structurally similar to lignin, the photodegradation process takes place in both polymers; (2) the continuous change in dimensions of the samples during weathering, stresses the rigid/brittle tannin polymer resulting in cracks forming smaller oligomeric fractions that can be subsequently leached out. With high probability, the two effects are synergistically responsible for the poor weathering properties of the tannin treated formulations.
Nevertheless, it was observed in vibrational spectroscopy investigations that a higher amount of aromatics on the surface before weathering leads to higher amount of aromatics also at the end of the weathering. The tannin treatment is less effective in protecting the wood surface against weathering, but it can contribute to delays in the degradation of the lignin.
Conclusion
Untreated and tannin treated specimens have similar weathering behaviour and therefore, we conclude that cross-linked (inelastic) tannin networks are not suitable photoprotective treatments for wood used outdoors. The weathering renders the surfaces more hydrophilic and induces a grey colour. These results were unexpected considering the good results shown by the formulation during the leaching tests.
Two reasons for the degradation have been proposed: (1) the photodegradation during continuous exposure to light deteriorates the aromatic polymers of the surface; therefore, the tannin enriched surfaces are also affected by this phenomenon. Notwithstanding, the tannin enriched surface still indicates more aromatics in the surface that can be detected via vibrational spectroscopy; (2) the continuous dimensional changes of wood facilitate the breaking of the polymer that can be subsequently leached out.
More elastic tannin based polymers may be better at protecting wood from photodegradation, and they may facilitate estimation of the extent to which photodegradation itself contributes to the aromatic decay of the wood surface. Further research would be needed to confirm this suggestion.
Footnotes
Acknowledgements
The authors acknowledge the Austrian Science Fund: project no. 1232- B16 and the COST action FP1006.