
Abstract
The impact of soil transfer on fungal degradation of Scots pine was investigated using visual inspection, microscopy and DNA profiling. Two test fields in Simlångsdalen with similar soil characteristics were used. Soil has previous been used with the purpose to retain the beneficial original micro-organisms present to imitate field-trials during laboratory condition. We found that fungal degradation in mini-stakes exposed in transferred soil did not correspond to mini-stakes exposed in original soil. Moreover, the type of degradation in the mini-stakes exposed in transferred soil did not match mini-stakes exposed in the original soil. However, established degradation in areas neighbouring the transferred soil was comparable. The fungal community in mini-stakes also varied more between different years than within the field. This suggests that relocation of soil disrupts the original fungal community due to unavoidable mixing of the soil. Therefore, the beneficial micro-organism characteristics of soils is very difficult to transfer elsewhere.
Introduction
There are several studies where soil from a specific test field (e.g. Simlångsdalen old test field) has been used for laboratory decay tests (i.e. ENV 807) with the intention of retaining the beneficial decay microcosm of the original test field (Edlund and Nilsson 1999; Treu and Larnöy 2010; Westin and Alfredsen 2011; Charifo Ali et al. 2011; Segerholm et al. 2012). It is of considerable interest how such a transfer of soil from a test field would influence the inherent micro flora. For example modifications in the composition of micro-organisms could occur due to the change of the surrounding environment. If a change of micro-organism composition occurs and it is evident that not only the decay rate differs but also species, this questions the purpose of moving the soil. The composition of micro-organisms will also depend on where in the field the soil originates, since no test field or soil is totally homogeneous.
To identify the biological hazard of decay fungi in wood exposed in field tests is important. For example, a brown rot fungus of one species may be different than another brown rot fungus by producing a different profile of enzymes that cause different types of decay, by stress tolerance (e.g. temperature and moisture), or have a fast or slow colonisation and degradation efficiency. By studying the enzymes involved in wood degradation and relating them in phylogenetic studies it has been possible to show that white rot fungi are ancestors of the wood degrading basidiomycetes (Eastwood et al. 2011). This means the ability to degrade lignin was developed before conifers had evolved. In contrast, brown rots seem to have evolved at least six independent times within different white rot phylogenetic clades. It is also suggested that the mechanisms of the lignin-degrading enzymes became inactive (Hibbett and Thorn 2001; Hatakka and Hammel 2010). Among soft rot fungi, effective lignin degrading peroxidase enzymes appear to never have evolved. However, numerous soft rot origins are found in both terrestrial and aquatic environments. These have various enzymes activities as well as structural variations in rot type (e.g. soft rot type 1 and type 2).
The ability of a wood degrading fungus to successfully colonise and degrade wood depends on both its stress tolerance and if it is a ruderal- or competitive species. Stress tolerance means the ability of the fungus to resist dry soil and/or wood, low nutrition levels, highly fluctuating moisture conditions and if present natural resins or wood preservative chemicals. Fungal species considered as ruderal are often primary colonisers that utilise the free and empty spaces in wood; where the fungus invests in reproduction and dispersal. Species considered as competitive colonise at a later stage of succession and utilise less easily degraded or accessible organic compound such as cellulose, hemicellulose and lignin. They expand slowly and can eventually dominate the community. Fungal colonisation of wood reflects its ability to absorb water, with slow absorption giving slow fungal colonisation and fast absorption giving more rapid fungal colonisation. Very little is known concerning the time lapse between establishment and reproduction for wood degrading fungi. However, for early colonisers it is evident that reproduction may take place almost immediately after establishment while it is less clear how long species that reproduce during the later stages may be present before the process is initiated. An indication that many fungal species may be latent in wood comes from studies in DNA identified mycelia taken from wood samples compared with fruiting species where only about one-third of the fungal species present in Picea abies logs were represented by fruiting bodies (Gustavsson et al. 2002; Ovaskainen et al. 2010). This indicates the presence of latent fungal communities and suggests a significant time may elapse between colonisation and reproduction in some species. This means that fungi in wood degradation can cause major degradation before becoming visible as fruit bodies.
The objective of present study was to investigate the effect of soil transfer between test fields on the wood degrading fungal community colonising pine wood stakes.
Material and methods
Wood materials
Samples of Scots pine sapwood (Pinus sylvestris L.) were produced with dimension 8×20×200 mm (along the grain) – so called mini-stakes. The wood originated from Uppland (middle part of Sweden) and fulfilled the qualities demanded by the European standard EN 252 for wood in ground exposure. In total, 120 mini-stakes were distributed randomly in six areas (20 in each area) and inserted in soil to half of their length. Exposure started June, 2009.
Field site description
The two test fields (new field: 56° 41’ N13° 05’ E, old field: 56° 43’ N 13° 08’ E) used in this study are located in Simlångsdalen, Sweden and the distance between them is 4·5 km. Both fields have sandy soil, an annual precipitation of ∼1050 mm (Råberg et al. 2013), pH around 4 and a water holding capacity of 14% (unpublished report). The test fields are both considered as brown and soft rot decay fields (Edlund 1998). In the new field at Simlångsdalen, five different areas were defined as test areas (Fig. 1) and one area in the old field (not shown). Each test area was ∼20×20 m and had a defined soil and/or environment condition (Table 1 and Fig. 1). To evaluate the effect of transferring soil on decay and fungal flora, soil from the old field of Simlångsdalen was transferred to the new field. Soil from the top 20 cm layer was transferred from the old field, mixed and distributed in pre-prepared 50 cm deep areas 1 and 4 in the new field (Fig. 1). In total 25 m3 soil was transferred, 12·5 m3 to each area. An overview of experimental set-up and outcome is presented in Fig. 2.
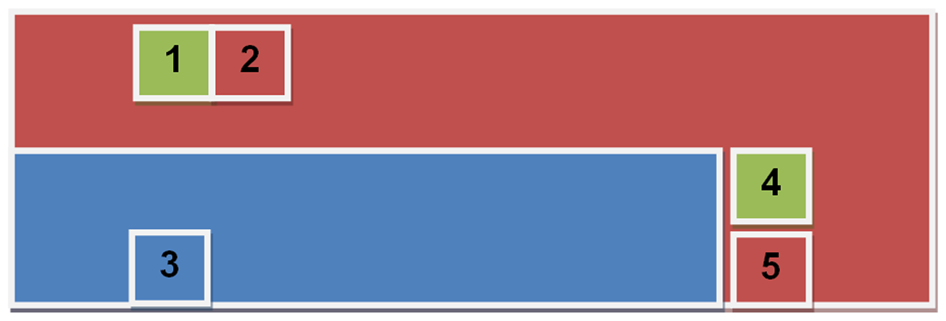
New field in Simlångsdalen and location of test areas. Blue area indicates where test stakes are/have been previously exposed, green areas are relocated soil from old field in Simlångsdalen (i.e. area 6) and red areas have not been exposed to test stakes previously. Note that old field at Simlångsdalen is not shown
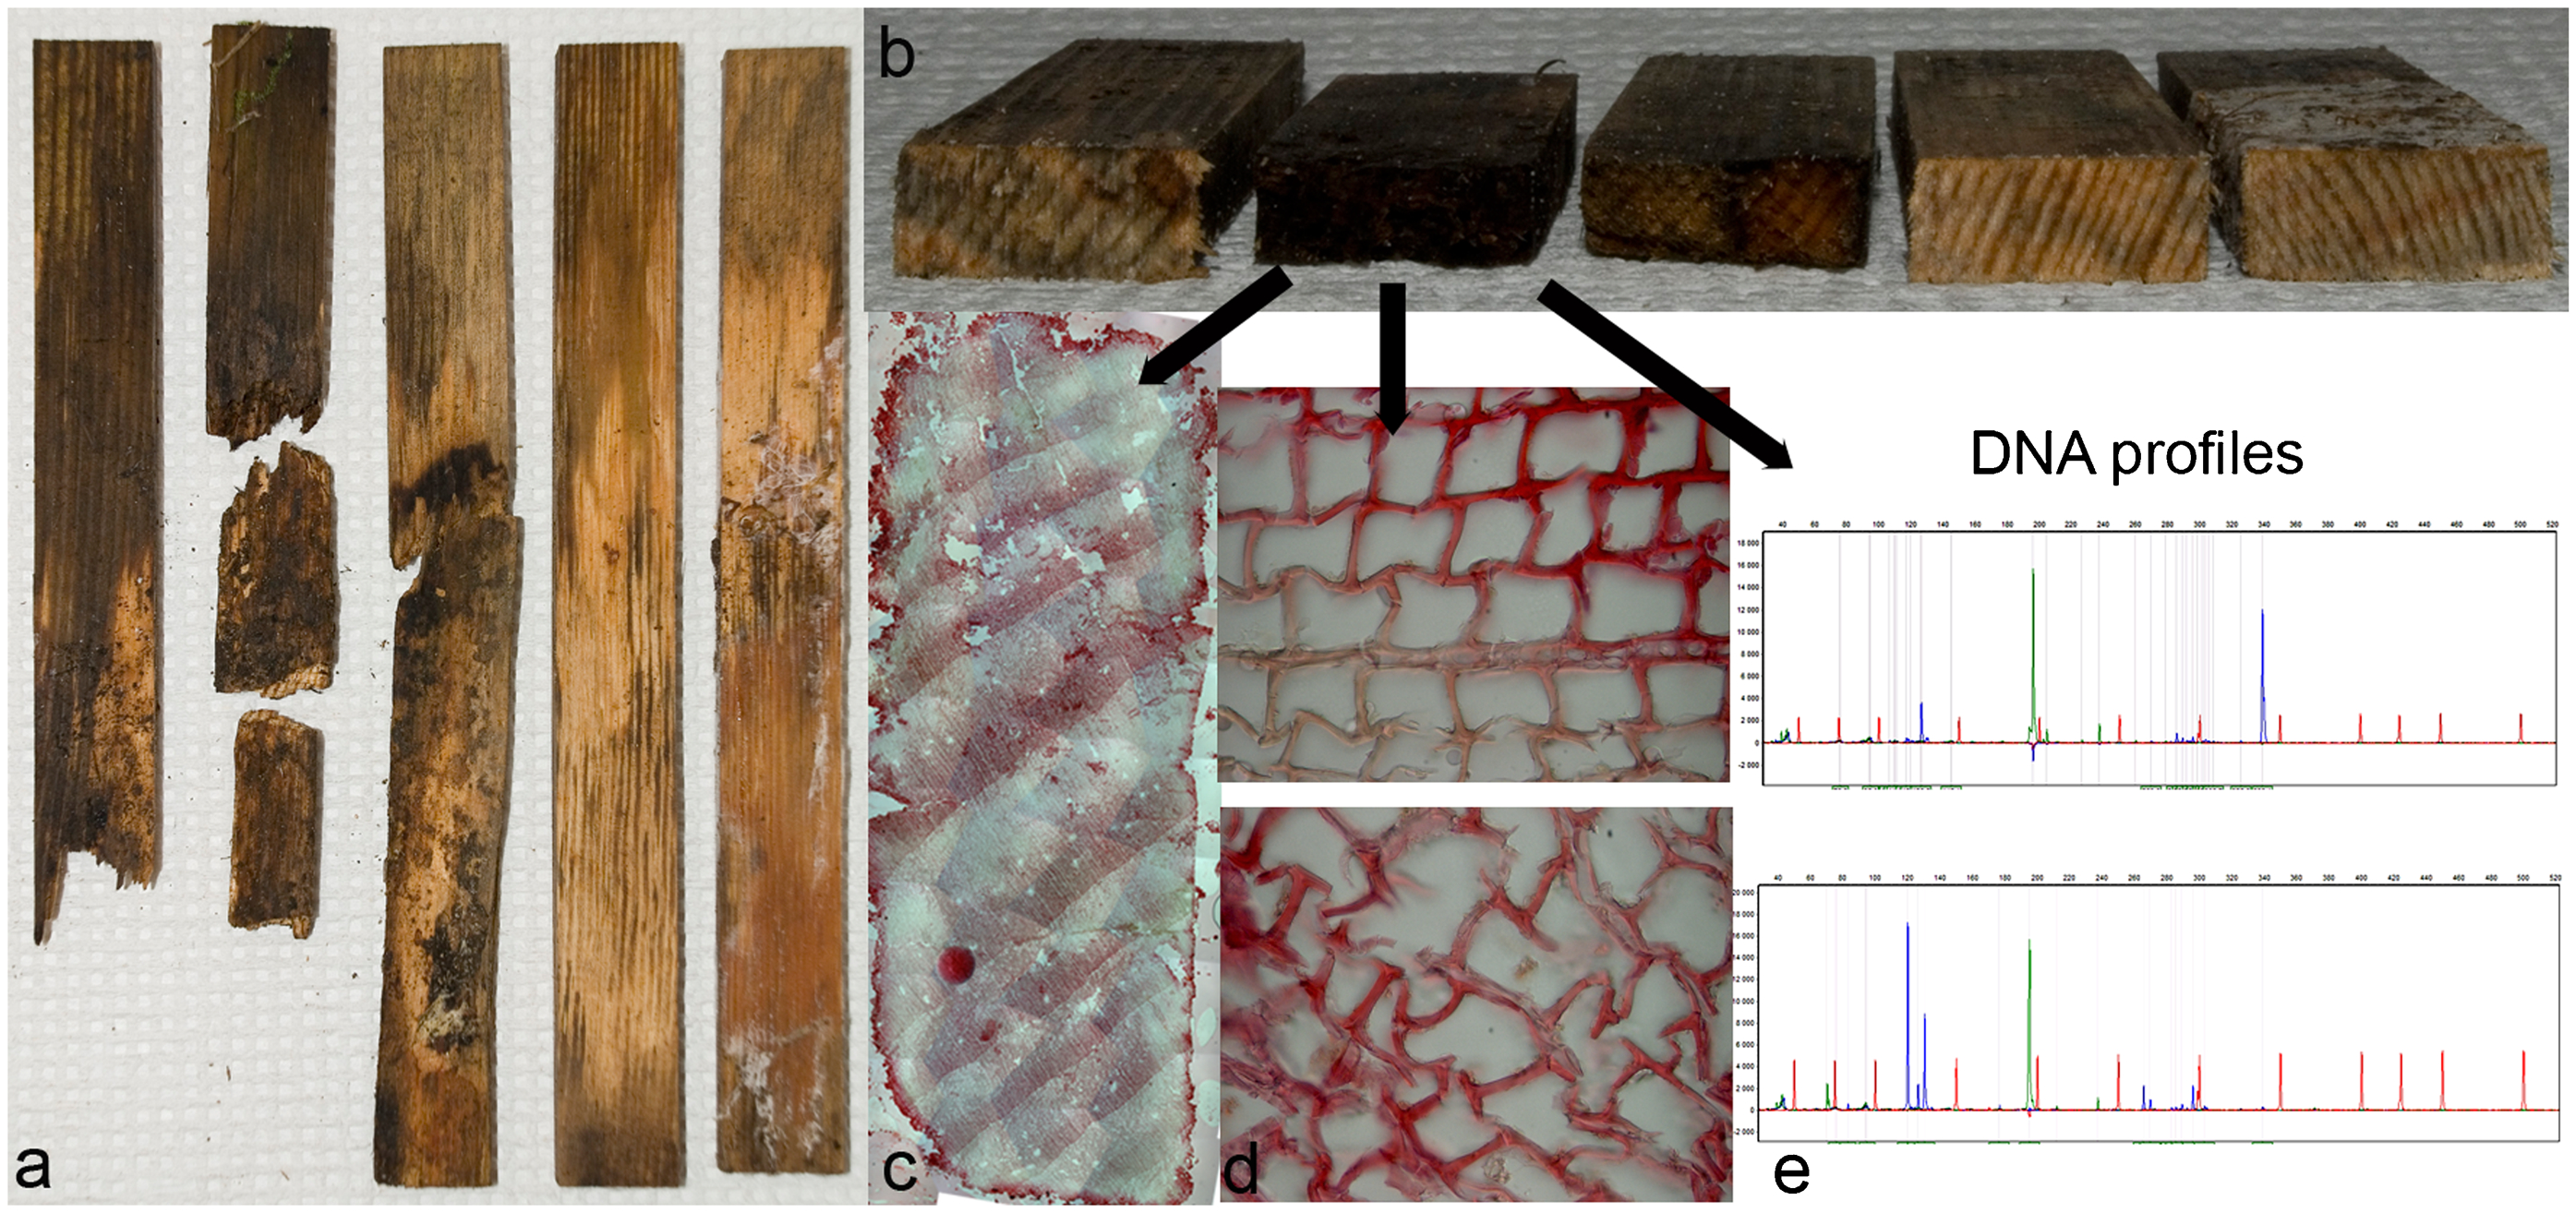
Experimental set-up and outcome: a exposed mini-stakes; b cross-section of exposed mini-stakes; c constructed cross-section from microscopy images (size 8×20 mm); d microscopy images of brown rot; e DNA profiles from exposed mini-stakes
Overview of soil origin and exposure history at different areas
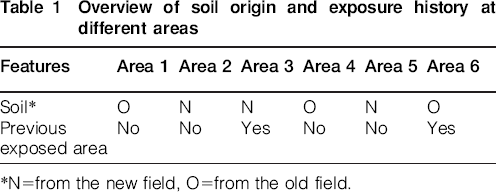
*N = from the new field, O = from the old field.
Cross-sections, image analysis and decay rating
Wood stakes were photographed (Nikon D80) after exposure (4, 12, 18, 24 and 30 months) in the test fields (Fig. 3). Images were taken of both front and back sides of the stakes. Stake sections (i.e. cross-cuts) (Råberg et al. 2013) were also made using a cross-saw in order to expose the inside and progress of decay. Stakes were sawn every 5 cm starting from the lower end (exposed in ground contact). At each point in time a different stake was cut.
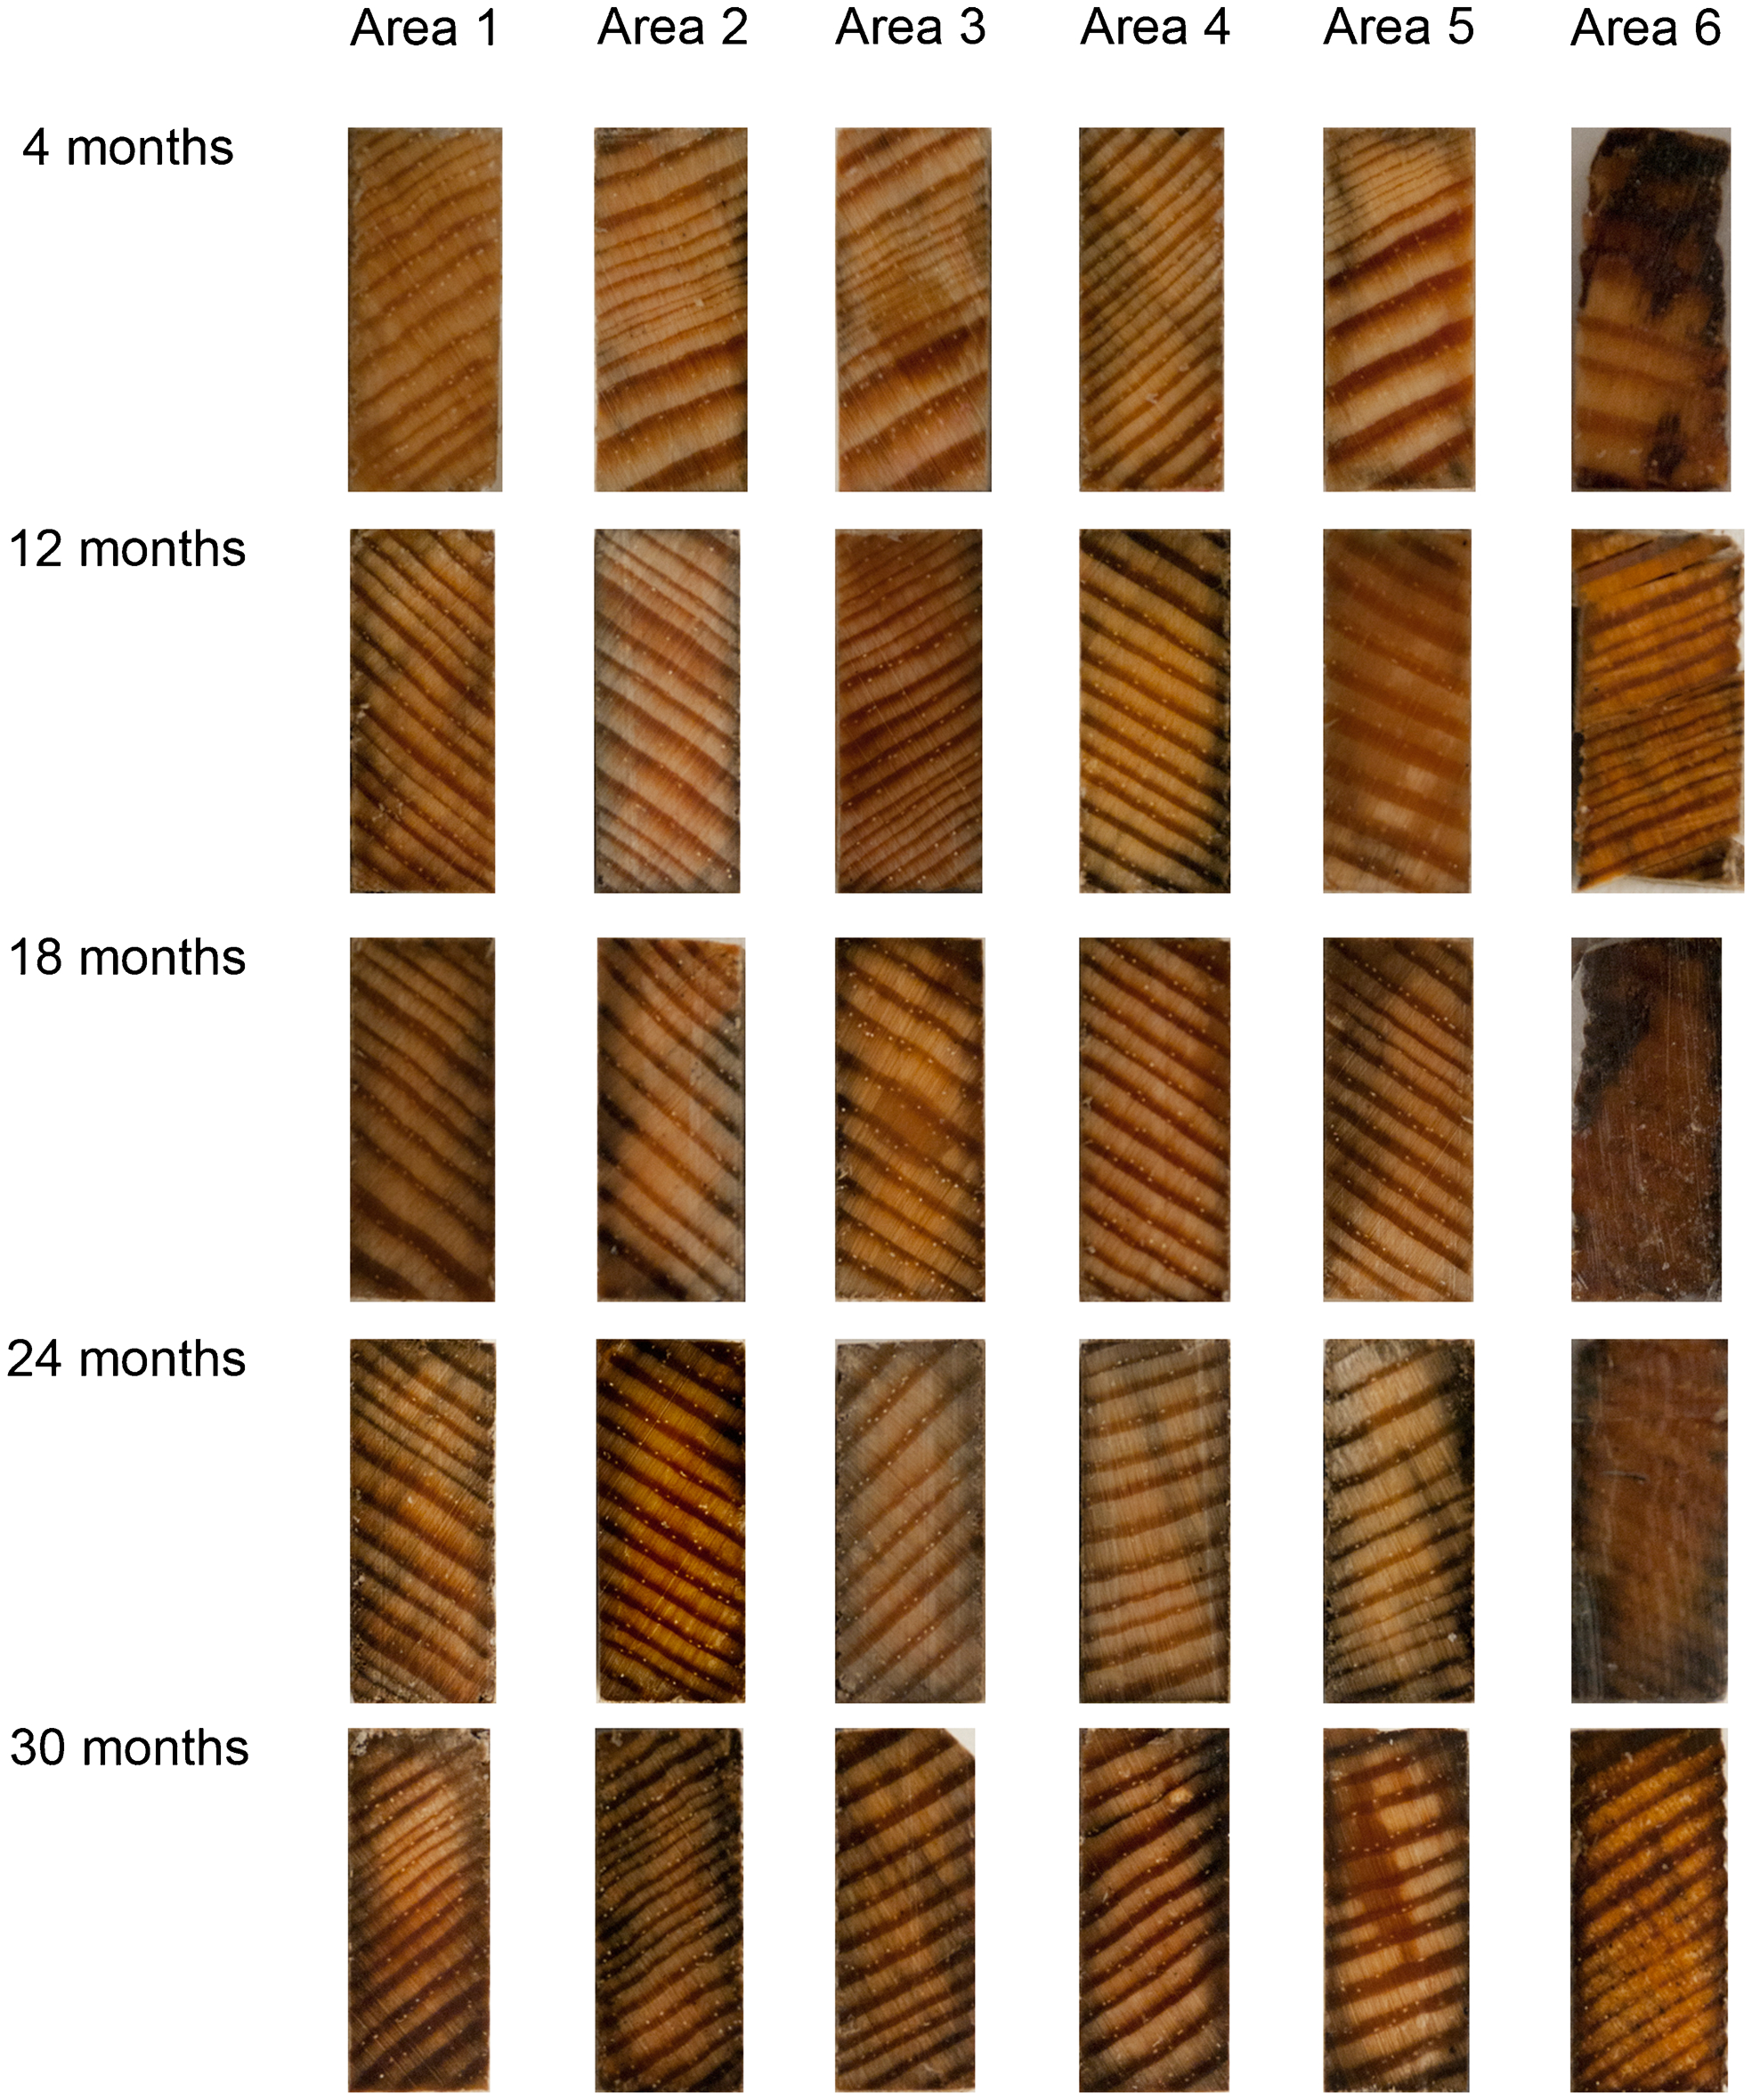
Cross-sections of mini-stakes exposed in different areas and time periods in Simlångsdalen test fields. Cross-sections shown here were made in middle of mini-stake. Areas 1–5 are from new field in Simlångsdalen and area 6 from old field. Note all cross-sections are hydrated
Microscopy
The middle part of each mini-stake was cut into thin slices, approximately 10 to 15 μm thick sections (Fig. 2) using a Microm microtome (HM 350, Microm, Germany). Cross-sections were stained using 1% w/v safranin in glycerol. Sections were analysed using a Leica DMLB light microscope and images recorded digitally with a Leica DC 300 CCD camera at a magnification of 315× to cover the whole cross-section. Images were later used for reconstruction of the whole mini-stake cross-section (8×20 mm) using Adobe Photoshop CS2. As a complement, detailed images of interesting areas of the cross-sections were made at various magnifications (i.e. 2520× and 3969×).
As an indication of extent of decay, each cross-section of the mini-stakes was assessed on a coarse scale of 0 to 3, where 0 means sound, 1 indicates rot around the edges (<1 mm), 2 represents a cross-section that has more than 1 mm rot at the edges and/or is spread along rays, and 3 is given when the sample is totally affected by rot (Raberg et al. 2013).
Molecular methods
To compare fungal colonisation of stakes exposed in different areas, DNA profiles were constructed for each sample. Samples from the middle part of the mini-stakes (Fig. 2) were prepared for molecular analysis by milling the sample to a fine wood powder using a 1 mm screen Cyclone grinder (Cyclotech 1093, sample mill). Samples were frozen in a −20°C freezer directly after milling until further analysis.
Before extracting gDNA, the wood powder was further homogenised using a hand-held homogeniser (IKA T10). Extraction of gDNA was done using 2% w/v cetyltrimethylammonium bromide, and polymerase chain reaction run as described in Råberg et al. (2005) with the exception of using a WVR Mastermix. The primer pairs were ITS 1F-FAM and ITS 4-HEX for construction of terminal restriction fragment length polymorphism (TRFLP) profiles. Terminal restriction fragment length polymorphism profiles were based on enzyme digestion by Taq I and Cfo I (both Sigma-Aldrich). Samples were purified using isopropanol and sent for profile analysis at Uppsala Genome Centre. Profile data were analyzed in software Peak Performance 1·0 (Applied Biosystems) and exported to Microsoft Excel for further analysis.
Results and discussion
Evidence for soft rot was found in all test field areas and decay intensity increased with time during field exposure. Regarding brown rot, no specific decay rate could be characterised. Initial decay in area six (i.e. old field) shows severe brown rot in some of the mini-stakes that later declined (Fig. 4). One explanation for this could be that some of the mini-stakes were exposed in hot spot areas (Råberg et al. 2013) supporting a very aggressive brown rot fungus confirmed when these mini-stakes were removed for evaluation. It is, however, quite possible for mini-stakes removed later to show less decay. This can also be due to mini-stakes evaluated subsequently were exposed in the outer boundary or outside of the hot spot areas. White rot had some impact on decay rating in area 6, where it was established after four months. An impact of white rot decay in mini-stakes exposed in the transferred soil areas was not observed.
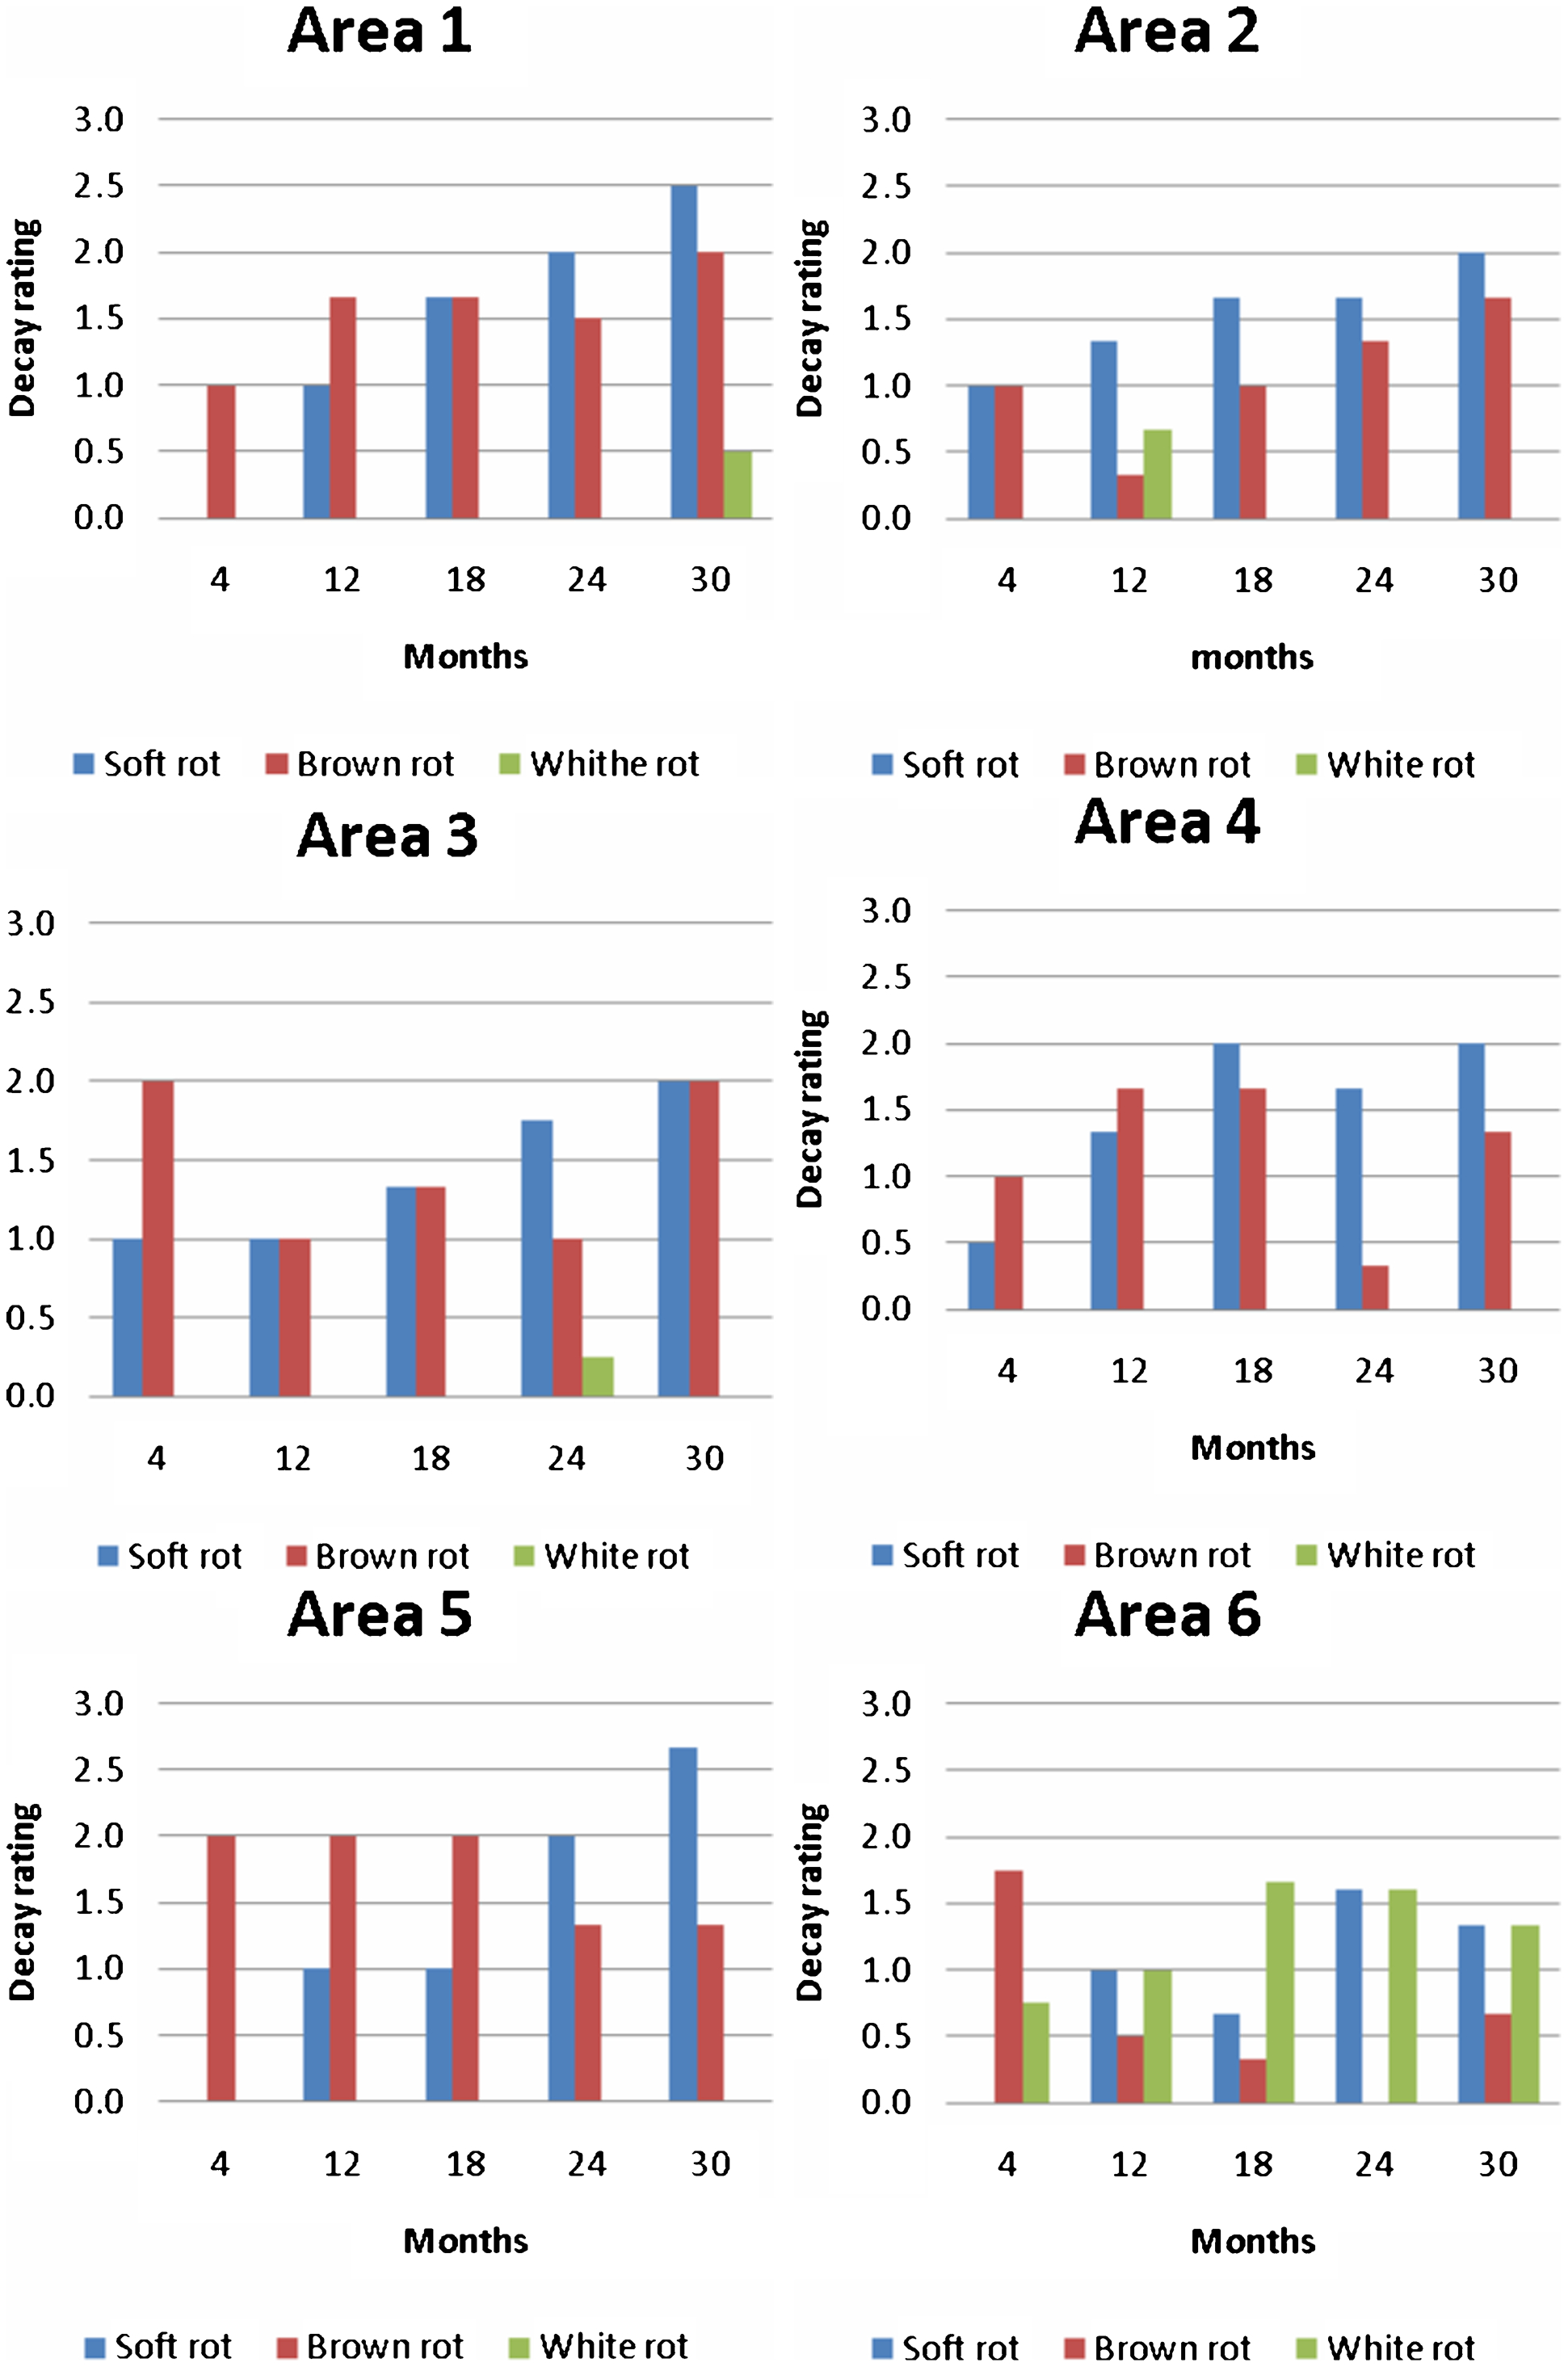
Development of wood decay in mini-stakes over time in areas 1–6. Rating is based on cross-section from middle of mini-stakes viewed using light microscopy (n = 3)
Cross-sections at macroscopic and microscopic levels
Initially the mini-stakes were examined at the macroscopic level by comparing signs of decay from cross-sections from the middle of the mini-stakes (Fig. 3). In all areas, brown rot was visible due to the characteristic brown discoloration. However, to discriminate between soft rot and blue stain on macroscopic level is difficult. At 30 months exposure white rot decay was slightly visible in areas 1 and 6 (Fig. 3). However, cross-sections from areas 1–5 have similar cross-section characteristics whereas in area 6 the cross-sections are slightly deformed due to extensive degradation and dehydration.
For more precise degradation characteristics of cross-sections, microscopy observations were needed. Cross-sections were evaluated with respect to type and extent of decay as described in Råberg et al. (2013) (Fig. 4). In general, when soft rot is established in a mini-stake the decay rates gradually increase over time. Soft rot is typically established around the edges of mini-stakes and develops inwards. With brown rot in mini-stakes, the micro-distribution of degradation varies considerably, even between mini-stakes exposed in the same area and with length of time. Very often, brown rot fungi colonise and spread through the wood via the rays and establish attack in the wood. They do not necessarily become established at the edges of wood and progress inwards like soft rot fungi. This feature was also confirmed in this study. In Fig. 3 it is possible to observe brown areas representing brown rot randomly scattered across the cross-sections. White rot was established in area 6 with decay spreading through the wood via the rays quite similar to brown rot colonisation.
Microscopy studies on wood stakes over time show the state of the stake based on both present and past attack that may not be active. One interesting aspect is how much the winter period in Sweden affects the progress of degradation and if certain decay fungi are more tolerant than others to cold periods. One suggestion is that soft rot fungi as a group are tolerant to cold periods. This suggestion is based on the growth pattern that is expanding from the edges inward in almost all samples and increasing in area over time. The exception from this growth pattern in this study was when soft rot was challenged by brown (or white) rot as in areas 5 and 6 after four month's exposure, where extensive brown rot attack was visible, but no sign of soft rot activity was apparent. Blanchette (2005) has earlier reported that soft rot fungi can grow in extreme cold climates.
Areas 1–5 suggest more homogenous test fields regarding decay than area 6 that varies depending on where the mini-stakes have been placed. This indicates as earlier reported (Råberg et al. 2012; 2013) that area 6 (old test field Simlångsdalen) could include hot spot areas while in areas 1–5 (new test field Simlångsdalen) they were absent. However, the high rate of white rot degradation which is not part of the hot spot brown rot degradation is not apparent in areas 1 and 4 with transferred soil. This suggests that the transferred soil did not retain the characteristics of the original soil over time after transfer.
Service life – comparing standard testing
The service life for the old and new fields in Simlångsdalen evaluated according to the European standard EN 252 for Scots pine was 2·6 and 3·1 years respectively (Edlund 1998). Comparing this result with mini-stakes from this study with duration of 2·5 years gives a service life that would be longer than 2·5 years (Fig. 4). Since the amount of biomass in an EN 252 size stake (25×50×500 mm) is significantly larger than for a mini-stake (8×20×200 mm), the expectation that a mini-stake shall have a shorter service life in the field was not proven. An earlier study reported equal duration for EN 252 size and mini-wood stakes (Westin et al. 2002). One factor that may be of importance in this respect is that a small stake can become very wet quickly and at the same time dries faster which means that the wood is not moist enough to be colonised and/or is inadequate for fungal expansion. This would not be that case in laboratory tests where optimal temperature and moisture is kept during the test period. However, when this study is compared with results from Råberg et al. (2013) where EN 252 stakes were exposed at the same time and in the same field, the degradation of these stakes was also at a lower rate than previously described by Edlund (1998) in the new field. This indicates that climate could also be delaying the progress of degradation. This is however not valid for the old field due to hot spot exposure.
Fungal species
By comparing TRFLP profiles it is possible to compare many samples and distinguish patterns of fungal profiles. Profiles may be identical, partly identical or different. Identical TRFLP patterns indicate that the sample contains the same species of fungi, partly identical TRFLP patterns mean that the sample contains fungi of the same and different species, and different TRFLP patterns mean that the samples do not share any of the same fungal species. The profiles do not identify fungal species, but rather provide an overview of the range of and diversity of fungi likely to be present.
TRFLP results (Fig. 5) after the first year of exposure reveal that the soil transferred from the old field (i.e. from area 6) to the new field (i.e. areas 1 and 4) has partly identical TRFLP patterns, which is expected from area 6. No TRFLP profiles were available due to severely degraded mini-stakes from area 6. The rapid progress of severe decay suggests that area 6 differs from areas 1 and 4, probably caused by a potential hot spot area within area 6. Therefore, to compare the outcome of the soil transferred from areas 6 to 1 and 4 would be of interest. TRFLP results after the second year of exposure for transferred soil in areas 1 and 4 show partly identical TRFLP profiles. The TRFLP profiles from the first year appear different from the second year, suggesting a shift in the fungal community for both areas and that the shift of fungi in the mini-stakes has partly been the same for both areas.
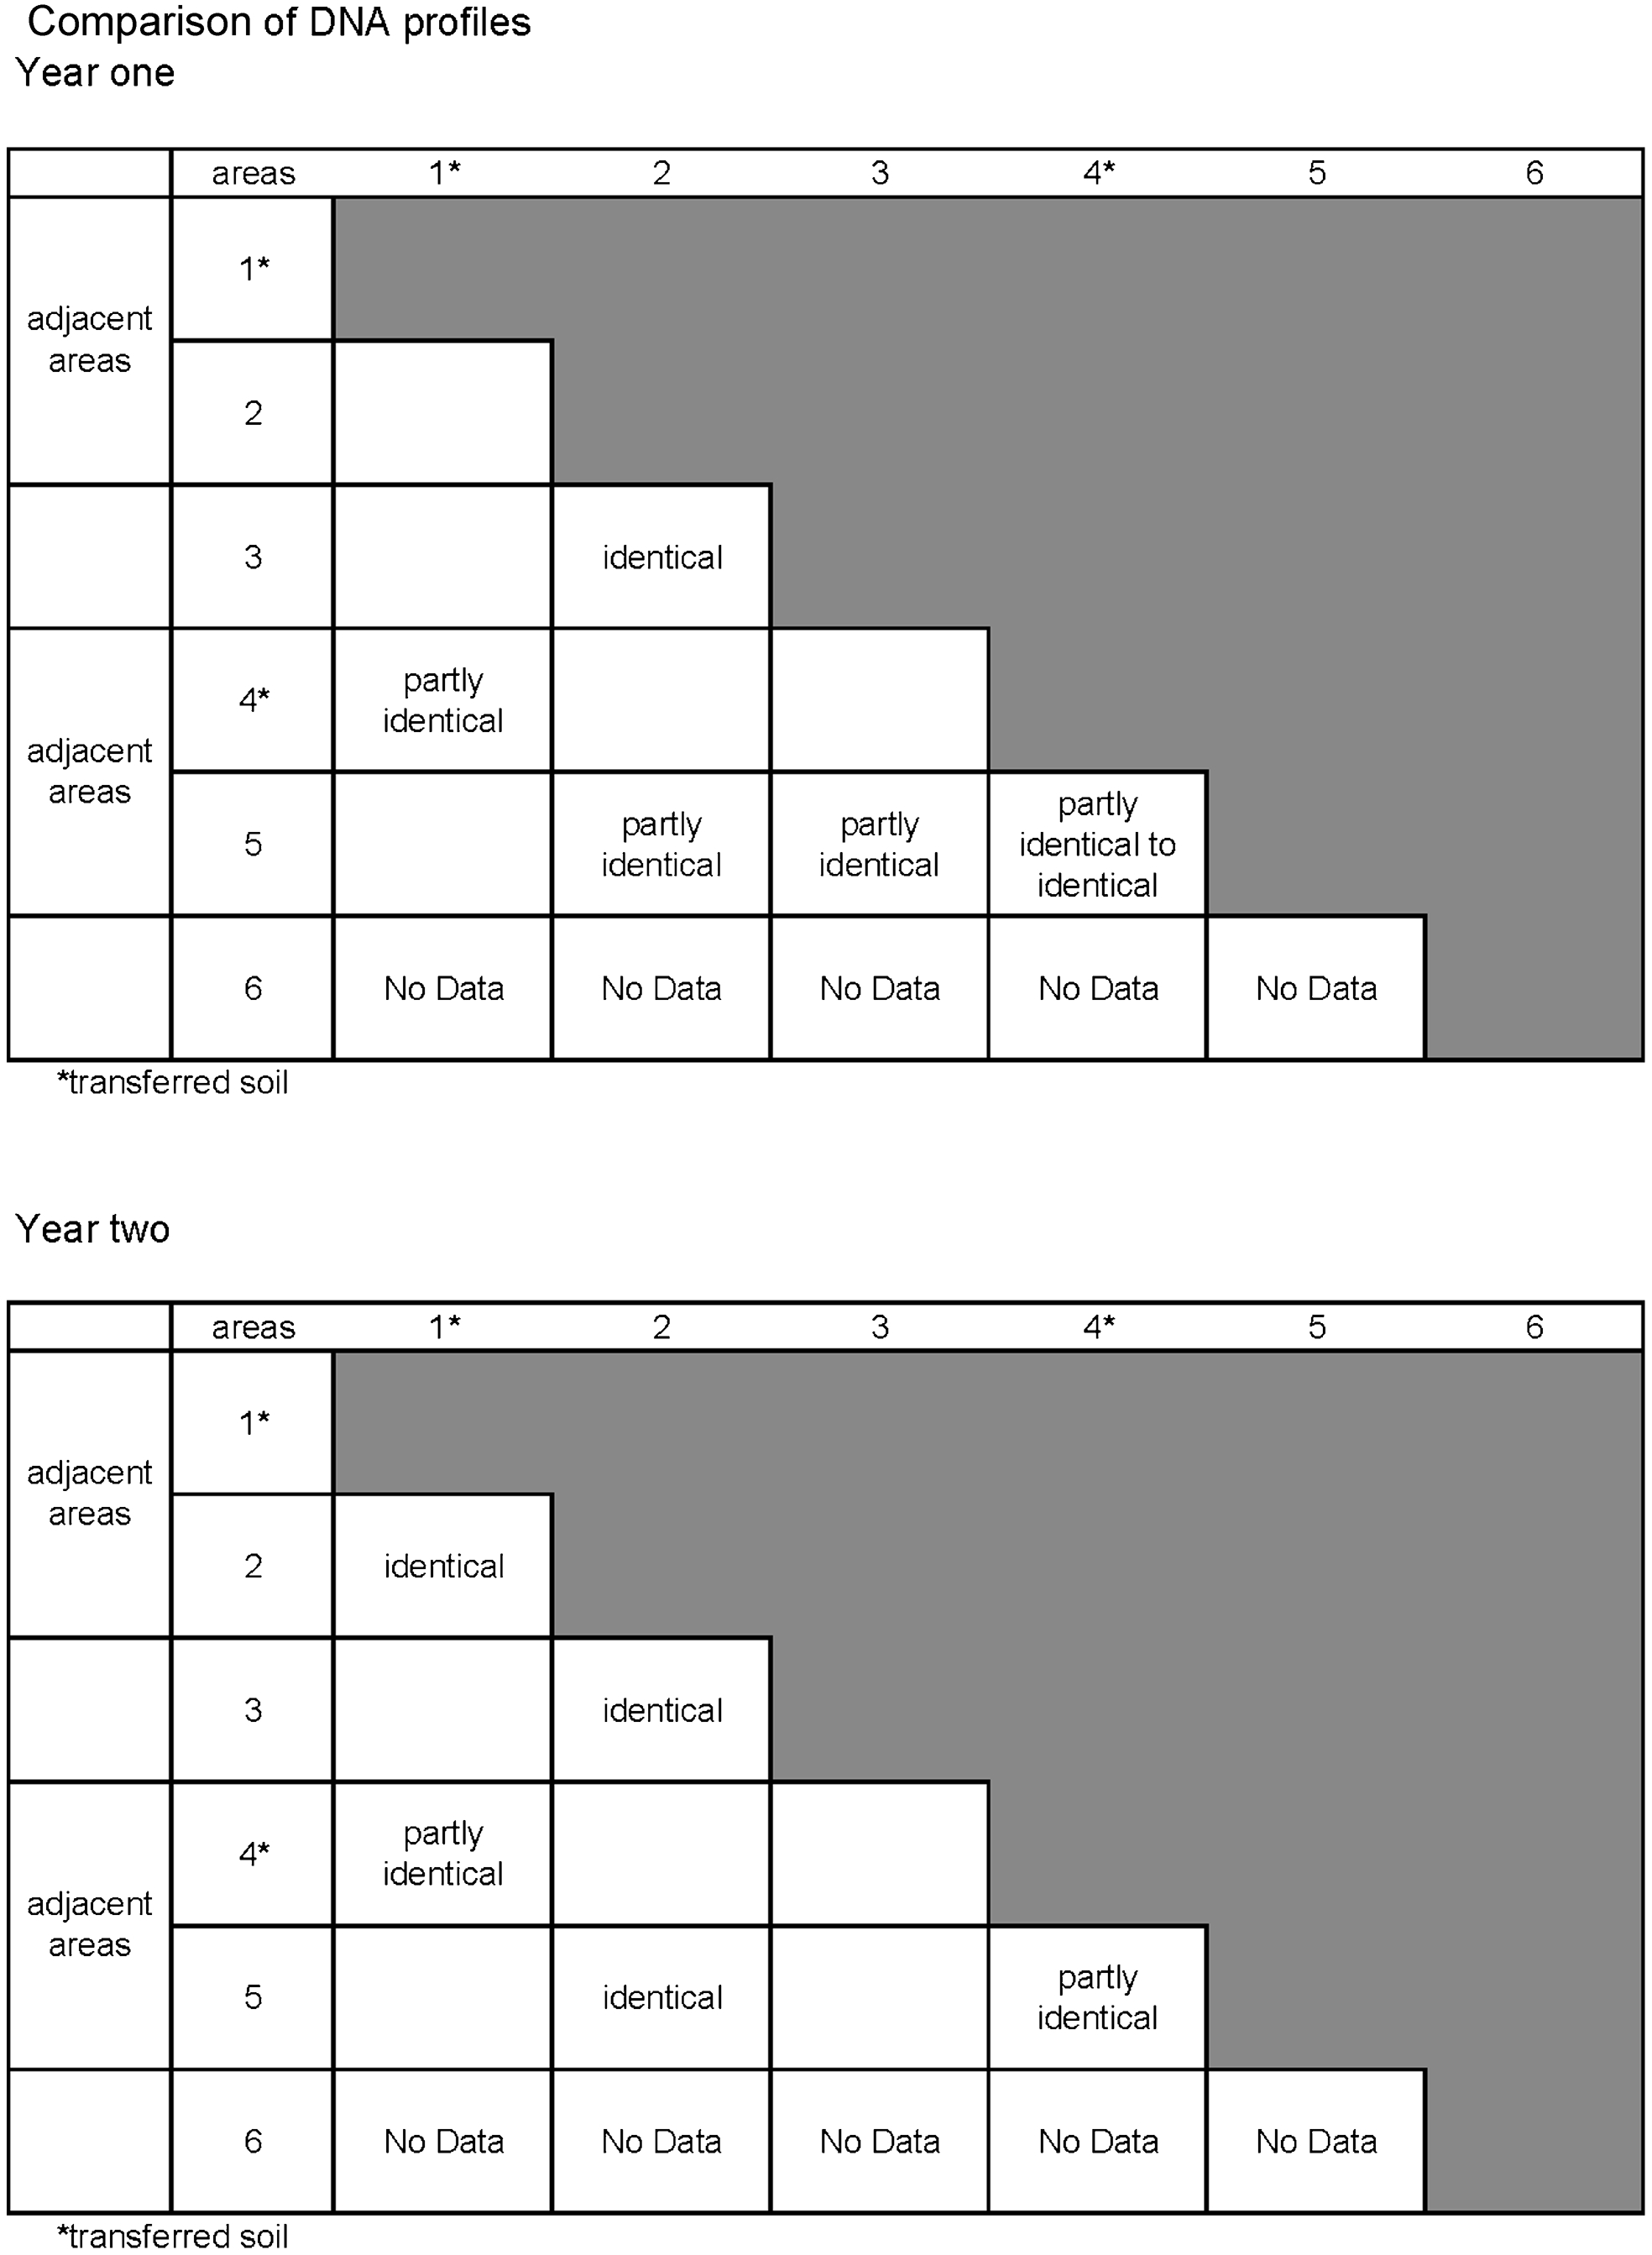
Overview of DNA profiles obtained from TFLP analysis year one and two at areas 1–6. In general, more species are visible in year two compared to year one (i.e. more peaks are present, not shown here)
Areas 1 and 2 as well as 4 and 5 were adjacent to each other (Fig. 1), while areas 1 and 4 had soil transferred and areas 2 and 5 have natural soil previously not used for testing. Comparing the TRFLP profiles from these areas indicates that fungal communities vary between the areas. For example, profiles from areas 2 and 5 (native soil) are partly identical, but the main profile differs. Profiles from areas 4 and 5 (adjacent) are partly identical to identical. TRFLP profiles from the second year show that areas 1 and 2 are almost identical. Areas 4 and 5 had partly identical TRFLP profiles. These results suggest that the fungal community established in the mini-stakes become more identical over time and the areas with transferred soil do not show a different fungal community in the mini-stakes compared to natural soil in neighbouring areas.
Area 3 which had been used earlier for testing wood stakes was compared with non-exposed areas (i.e. 2 and 5) shows identical TRFLP profiles as area 2 and partly identical profiles for area 3 during the first year. In year 2, area 3 has one distinct TRFLP profile that is also found in areas 2 and 5. The main difference during year 2 is that there are more TRFLP profiles in area 5 than in 2 or 3.
Extracting a gDNA from wood samples with severe fungal decay is difficult. This is due to autolysis of older parts of the degrading fungus at this stage in wood degradation (Eikenes et al. 2005; Råberg et al. 2005). This is why DNA profiles of these fungi causing severe decay in the mini-stakes exposed at the old field were not available. With neighbouring wood stakes with dimension 25×50×500 mm an aggressive brown rot fungus belonging to the genus Postia has been isolated and identified by sequencing (Råberg et al. 2013). This stake was exposed at the same date, had the same exposure time (i.e. 4 months) and was degraded to failure (EN 252 1989). This suggests that the fungal species causing brown rot was probably the isolated Postia sp. from EN 252 wood stakes (Råberg et al. 2013) in the old field (area 6). Isolated soft rot fungus at area 6 was Lecythophora sp. In the new field (areas 1–5) the main degrading fungal species have not yet been identified.
When soil has been taken from field test sites and used for testing previously, measurements have been primarily about mass loss, which does not give any indication of fungal communities. At least two of these studies have reported low activity of transferred soil or uneven activity (Segerholm et al. 2012; Edlund and Nilsson 1999). This indicates that the old field in Simlångsdalen is either very inhomogeneous or more probably that by transferring soil the original fungal community is disrupted and therefore not retained. Presumably the only way it could be retained is if the soil was transferred without any form of mixing and disruption. These results therefore question the suitability of transferring soil for performing laboratory investigations and where the aim is to simulate the decay microcosms of field situations.
Conclusion
The fungal degradation rate of mini-stakes in transferred soil was not consistent regarding new areas and the origin of soil due to inhomogeneous fungal distribution in the soil.
Fungal degradation type in the mini-stakes exposed in transferred soil did not match mini-stakes exposed in the original soil and test site. However, fungal degradation types in neighbouring areas were comparable.
Fungal community in mini-stakes varied more between different years than within the field. This probably reflects the course of fungal colonisation. Unfortunately no record is available from the old field for comparison that would have been of most interest.
Results further question the feasibility of using transferred soil to laboratory situations where the aim is to reflect field decay situations.
Footnotes
Acknowledgements
The authors gratefully acknowledge the Swedish Research Council for Environment, Agricultural Sciences and Spatial Planning (FORMAS) for the financial support of project ‘Micro- and nano-structural studies on the cell wall distribution and efficacy of modern and novel wood protection systems’. The authors also gratefully acknowledge Rico Kaden for technical assistance.