
Abstract
Increasing environmental pressures against deforestation in Central America has increased harvesting restrictions and subsequently caused disruption in the supply of raw materials to primary and secondary industries. A conceptual model was developed based on literature review to describe perceptions of wood products distributors, retailers, and manufacturers regarding supplier and product attributes, retailer/manufacturer and supplier promotion strategies, potential importing barriers and company performance. After verifying internal reliability with Cronbach's alpha, confirmatory factor analysis was conducted to confirm the structure of proposed marketing constructs. Results supported only one of the proposed factors in the model, (i.e. supplier attribute). Exploratory factor analysis was conducted to determine the structure of the remaining factors. The strongest correlations were between product attributes and retailer/manufacturing marketing factors, and the second strongest correlation found was between product and supplier attributes factors. These correlations are critical to developing innovative marketing strategies to increase access to markets in Central America.
Introduction
Importance of exports in wood product industries
To strengthen their competitiveness, wood products industries must engage in international sales (Parhizkar 2008; Parhizkar et al. 2009; Wang et al. 2010). Marketing research in the forest products industry has identified several factors that impact the successful export of forest products, such as abundant local supply, production capacity, production costs, favourable export policies, logistics, supply chain practices, language barriers and promotion strategies (Ponce et al. 2007; Marinescu 2008; Turner et al. 2008). Ifju and Bush (1993) and Parsons (2002) suggested that small, domestically oriented companies in the wood products sector view themselves as non-exporters, but they still have the potential to export. More recent research from Bumgardner et al. (2004) indicated that information on import/export statistics is not a high priority for US hardwood industries, suggesting that US firms in this sector might be mostly focused on local markets. However, other authors indicated that many non-exporting forest products companies in the USA and internationally are trying to enter into a global market by transitioning from centrally planned to market driven strategies (Branko et al. 2009; Hammett et al. 2009). This transition is not happening smoothly and for non-exporting forest products firms, it is difficult to engage in exporting activities mainly because predetermined or lack of marketing information on the target markets perceptions (Geldres-Weiss et al. 2010).
Imports and main exporters to Central America
Importing forest products into Central America may be necessary to meet the growing demand for building materials because of an increase in population, tourism, and deforestation (Fallas 2008; Rogers 2009; World Bank 2010; Montagnini et al. 2003). Turner et al. (2005) suggested that trade free agreements with Latin American countries might open the opportunity for forest products exporting countries to gain market share in the region. Current trade figures for Central American countries indicate an increased trend in the import of wood products. In 2011, total import of wood products was $309·4 million, a 56% increase from 2007. Costa Rica was the largest importer of wood products with $124·3 million in 2011 and the second largest was Panama with $68·5 million for the same year. Nicaragua was the smallest importer with only $11·5 million for 2011 (ITC 2012). Costa Rica, Panama and Nicaragua showed the highest increment in imports with 154%, 92% and 32% respectively when 2007 was compared to 2011. The only country that shows a decrease in imports between 2007 and 2011 was Honduras with a 10% decrease.
Chile, China, the USA and Guatemala exported the most wood products to the Central American region in 2011 (ITC 2012). Chile has gained an important market share in Central America by providing softwood lumber products with low cost, high quality and reliable supply (Ponce et al. 2007). In the case of China, Chinese wooden products (mostly composites such as plywood and medium density fibre boards) have also grown their presence in Central America in recent times, competing mostly by low prices and high volumes (Castillo and Hiratuka 2012). Recent analysis on wood products exports from China have suggested that China might be losing exporting competitiveness due to the country's increasing labour costs, scarcity of high quality raw materials and an increasing share of local market (Gu 2011). It is interesting to learn that US wood products exports to Central America are the third behind Chile and China. In the past few years, the wood products industries in the USA have suffered from the economic crisis, including forest product mill closures and loss of employment due to an increase in global competition (Quesada and Gazo 2006). The remaining US forest products industry might return to a competitive level by expanding export markets to regions such as Central America (Wang et al. 2010). Even though the forest resource and forest industry in Guatemala is large and it seems to be a natural fit for exporting wood products to the other Central American countries, the wood products industry in this country is not export oriented. According to Tanaka (2012), the Guatemalan wood products industry does not meet the bottom line in terms of prices, product quality, volume and services.
The background information on each country in Central America indicates that there are critical factors that limit the production of wood products to meet local demand such as environmental pressures to stop deforestation (legal and illegal), limited access to technology and technical knowledge, availability of training opportunities, government support and access to sources of funding. These factors seem to negatively impact the local industries as local producers are incapable of fulfilling demand and the same factors open the door for the increasing presence of wood products imports from countries such as Chile, China and the USA.
The goal of this research was to investigate factors impacting the import of wood products in the Central American market. The identification and understanding of those factors might lead to the development of innovative marketing strategies and the establishment of long-term relationships between potential importers and customers in Central America.
Literature review: Research framework construction
In order to understand how distributors, retailers and wood products manufacturers perceive marketing factors in Central America, a conceptual research model was developed based on a literature review similar to Li (2002), Lee (2009) and Sanchez (2011). The main constructs of the conceptual research framework are:
Supplier attributes (SA)
Refers to the willingness of the supplier to service the customer (Reid and Riegel 1989; Dasmohapatra and Gonzalez (2010). Smith (2002) indicated that emphasises in close personal relationships is also important to establish long term partnerships between suppliers and customers. According to Anderson and Weitz (1992), Robicheaux and Coleman (1994), Olsen and Ellram (1997) and Leonidou et al. (2006), wood products firms need to pay special attention to certain supplier attributes. Based on this previous research, the following hypothesised structure for the factor SA is formulated:
H1: Factor supplier attributes is composed of the items honesty, patience, commitment, compromise, cultural sensitivity, supplier's visits, communication, information sharing and offering of quality products.
Product attributes (PA)
Refers to the product characteristics consumers are looking for in a product (Cesa 1987; Hammett 1996; Sun 1998; Cossio Antezana 2007; Aguilar and Vlosky 2008; Sungchul et al. 2011). Lippke et al. (2010) also indicated that it is critical to highlight attributes relative to wood products such as carbon sequestration properties in order to reach out to markets that are interested in environmental factors. Therefore, the following list of items is hypothesised as part of the factor product attributes (PA):
H2: Factor product attributes is formed of the items machinability, availability of a range of species, availability of a range of grades, availability of a range of sizes, colour, density (specific gravity), kiln dried, environmentally certified, price, volume discounts, product quality, reputable supplier, geographic closeness to supplier, warranty on product, brand, packaging and delivery on time.
Retailer/manufacturer promotion strategy (RM)
Refers to the promotional strategies for selling products to the end consumer (Cesa 1987; Parhizkar 2008; Yi and Yoo 2012). In promoting wood products, it is important to consider how the product benefits are being communicated to potential customers, selecting the right type of media and preparing the right kind of materials such as brochures, fliers or banners (Walter and MacKenzie 1988; Szymanski 1988; Cumbo et al. 2001; Abad 2003; Howe and Bratkovich 2005; Hammett et al. 2009). These suppliers’ attributes are important for potential buyers, given their need for identifying high performance suppliers. Good promotional activities might lead to an increase in sales; therefore, the performance of the company might be increased (Walter and MacKenzie 1988; Cumbo et al. 2001; and Hammett et al. 2009). Based on these previous findings, the following hypothesis is formulated:
H3: Factor retailer/manufacturer promotion strategy (RM) is formed of the items personal selling trade shows, magazines, radio commercials, TV commercials, advertisement in local newspaper, advertisement in store flyer, store website, attractive display rack, point of purchase product literature, sales and products discounts, and word-of-mouth.
Supplier promotion strategy (SP)
Refer to the strategies that suppliers use in promoting products to customers (Cesa 1987; Parhizkar 2008). Recent research from Saeed (2012) indicates that in business to business (B2B) markets, the buying process is often more complex as compared to business to customers (B2C) markets due to the purchasing of risky products. Anderson et al. (2008) indicate that any supplier can use three approaches to sell their products: basis of price, claiming exceptional value to realise higher prices and developing a customer value management approach. Considering the previous research outcomes, the following hypothesis is formulated:
H4: Factor supplier promotion strategy is formed of the items personal selling, participation in trade shows, advertisement in magazines, advertisement in local newspaper and word-of-mouth.
Barriers (BA)
Refers to restrictions on trade of products in an international or domestic market (Ifju and Bush 1993; Hammett 1996; Parhizkar 2008; Naka et al. 2009). When developing a marketing programme to export wood products, barriers, such as inefficient internal and external transportation, lack of government support, lengthy custom procedures, language skills, outdated technology and different meeting schedules (with buyers) might be encountered by potential exporters (Perera and Vlosky 2009; Wang et al. 2010; Lyon et al. 2012). Parhizkar (2008) indicated that importing barriers have a negative effect in company (buyer) performance and Ringe et al. (1987) and Ifju and Bush (1993) concluded that importing barriers might also have a negative impact on suppliers’ attributes. Given the importance of barriers when importing/exporting wood products, the following hypothesis is formulated:
H5: Factor barriers (BA) is formed of the items transportation and logistics, price, language barrier, quality of Appalachian forest products, delivery on time, industry production capacity, US governmental policies, international policies, knowledge of Appalachian wood products, lack of agents/brokers, paperwork and bureaucracy, payment methods and past experience.
Company performance (CP)
Although this particular factor does not relate specifically with marketing practices, it was included as part of the analysis to measure the impact of the previous marketing factors on company performance (Perkins 2009). The authors would like to understand if certain marketing practices have an impact or if it is related to company performance. Thus, the following hypothesis is formulated:
H6: Factor company performance is formed of the items, number of orders received, sales, costs, customer satisfaction, profit, product quality, employee satisfaction, supplier's relationship, competitive price and employee turnover rate.
Methodology
Questionnaire design
A questionnaire was constructed with information from literature and the results of interviews of forest products importers and government officers in Central America (Lyon et al. 2012). Rating type of questions was used to support the proposed factors’ structure that included 66 content questions and also demographic questions. Rating questions, arranged in a five-point balanced Likert scale (Blaikei 2003; Jamieson 2004; Lissitz and Green 1975), were used in the questionnaires to ask multiple related questions about a single concept (Vaske 2008). Before the questionnaire was delivered to the potential sample firms, it was reviewed by wood products marketing experts and changes were made as suggested. A pre-test of the questionnaire was not possible due to time and cost limitations.
Survey management
Surveys were conducted from January 2011 through April 2011. Owing to the lack of an appropriate method for identifying the target sample, a contracted company was hired to administer the survey. The contracted company employed individuals familiar with the wood product markets in each Central American country to locate firms to be included in the survey. Using contracted surveyors who are native language speakers is courteous to the interviewee and respondents feel more comfortable and surveys tend to be of better quality (Davis and Young 2002). The five countries of interest were Guatemala, El Salvador, Honduras, Costa Rica and Panama. Nicaragua was included in the original sampling, but after carefully reviewing the data, some anomalies were detected and it was decided not to include the data from Nicaragua in the survey analysis.
Data analysis
Questionnaires were scrutinised for validity and reliability of data (Cronbach 1951; Babbie 2010). If the individual constructs had acceptable internal reliability, the next step was to confirm the structure of the designed constructs and the relationships among the constructs using confirmatory factor analysis (CFA). The procedure CALIS available in the statistical software SAS was used to conduct the CFA. If the model turns out to be statistically significant, then the null hypothesis is rejected (H0, the model is a good fit for the data). If that is the case, exploratory factor analysis (EFA) is conducted in order to determine the factor structure of the data as recommended by Suhr and Shay (2009). Once the new structure is determined, the Cronbach's alpha coefficient was used again to check the internal reliability of the new factors’ structure (Lattin et al. 2003). Lastly, correlations were calculated among the resulting factors. The analysis of these correlations was important to identify potential unique marketing strategies for wood products firms that wish to export to Central American countries.
Results and discussion
Sample demographics
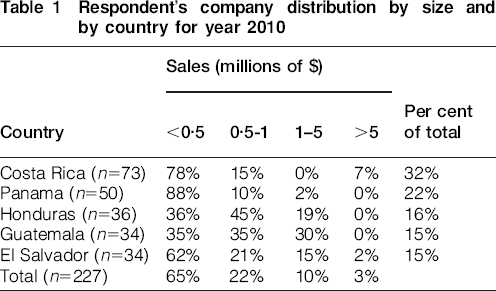
A total of 300 firms were contacted via phone call, direct visit, or email with a response rate of 76%. Given that companies were only contacted once (due to cost and time limitations) and the response rates were higher, a non-response bias test was not conducted. The majority of respondent firms were from Costa Rica (32%), followed by Panama (22%) and Honduras (16%) (Table 1). Most of the respondents indicated that sales were equal or less than $500 000 (65%), followed by 22% in the range from $0·5 million to $1 million, and 10% of the surveyed firms had sales in the $1 million to $5 million range. Only six companies (3%) reported sales over $5 million. Therefore, it can be affirmed that results in this research might only apply to small to medium size firms.
Respondent's company distribution by size and by country for year 2010
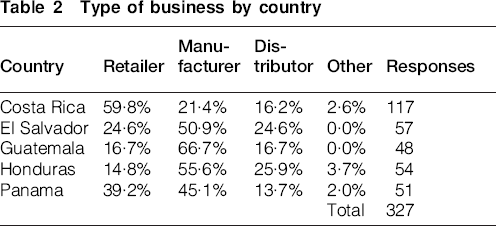
Related to the type of business the companies are in, the majority of respondents in Costa Rica indicated that they are retailers. In the case of El Salvador, the majority indicated that they are manufacturers, the same as in Guatemala, Honduras and Panama. Overall, the majority of respondents indicated that their main type of business was manufacturing. Some respondents indicated that their company can be classified as more than one business type (e.g. manufacturer and/or retailer) (Table 2).
Type of business by country
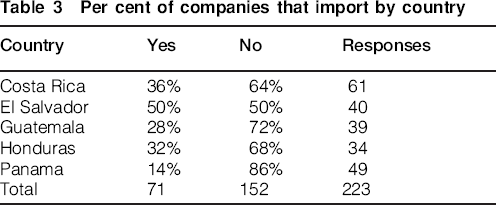
Most companies indicated that they imported forest products (32%) (Table 3).
Per cent of companies that import by country
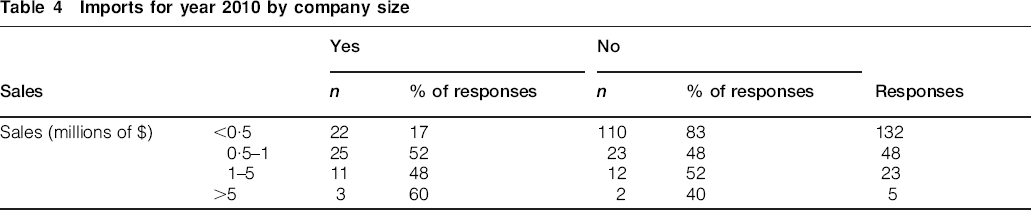
Companies reported total yearly sales for 2010. Table 4 shows that the larger the company size, the likelihood of importing.
Imports for year 2010 by company size
Factors confirmation
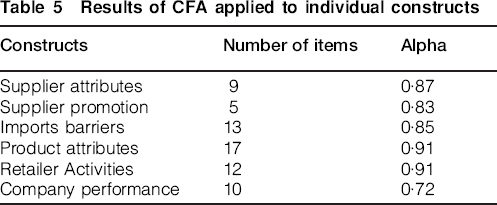
Before running CFA, an internal reliability analysis was performed using the alpha coefficient of Chronbach as shown in Table 5. In all cases, the coefficients range from 0·72 to 0·91. Since the alpha values are acceptable, CFA was conducted to confirm the individual factor structure (testing of the hypothesis described in the previous section).
Results of CFA applied to individual constructs
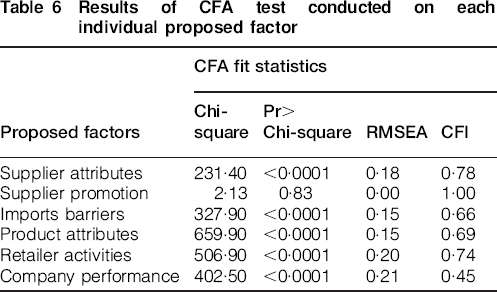
The fit summary statistics of the CFA performed on each individual factor is shown in Table 6 and in all cases, the factor structure was not confirmed (statistically significant), except for the supplier promotion structure. Consequently, EFA needs to be conducted to determine the best factor structure of the other items.
Results of CFA test conducted on each individual proposed factor
Exploratory factor analysis was conducted using the procedure FACTOR available in the statistical software SAS. Square multiplied correlations were used as communality estimates and a cutting value of 1 (Kaizer criterium) was set up for factor retention. The method of extraction was maximum likelihood and it was followed by a varimax rotation. This resulted in 28 factors that could have been retained by the Kaizer criterion. In addition to this criterion, the scree plot test (Cattell 1966) was used to spot factor separation. By analysing the scree plot, it was noticed that after factor 5, the remaining factors were not visually separated, forming an elbow shape in the plot. Given this, only five factors were retained accounting for 69·7% of the total variance. For each factor, all items with loadings higher than 0·50 were assigned to the specific factor. However, items with loads higher than 0·5 in more than one factor were deleted. Using this cutoff value, a total of 35 items were deleted. The remaining 31 items and their loadings are shown in Table 7.
Results of application of exploratory factor analysis procedure (loads rounded up to two digits and multiplied by 100)
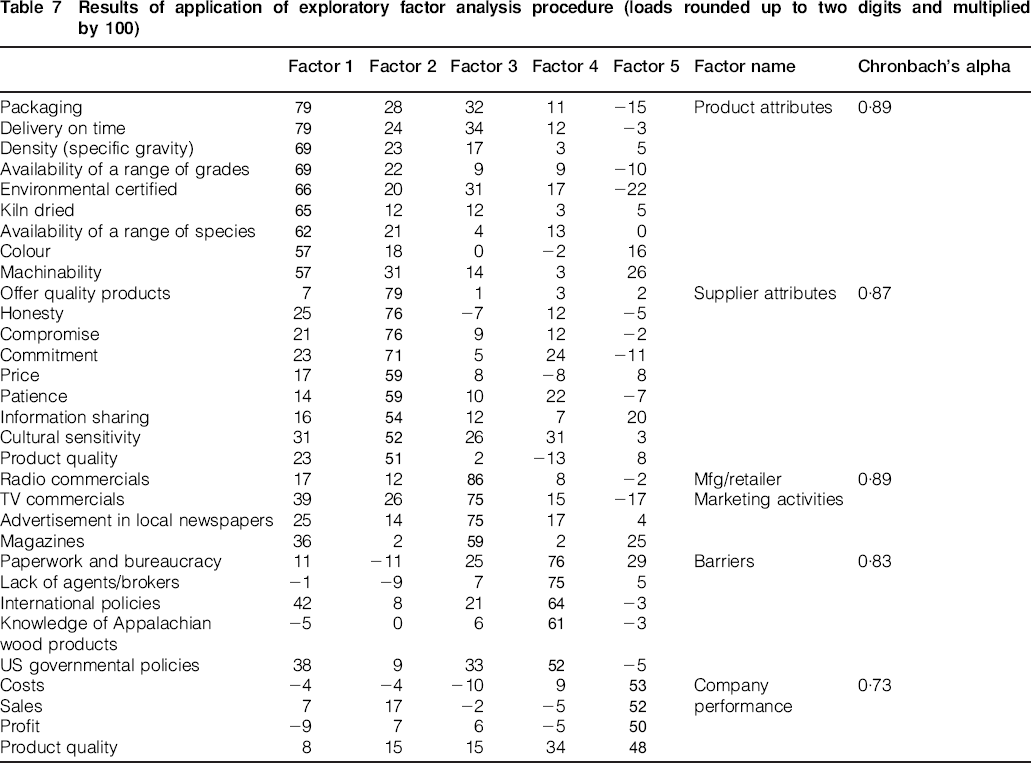
The first factor was named Product Attributes (PA). All of the items with loadings greater than 0·5 in factor 1 were related to promotional activities and they correspond with previous research by Parhizkar (2008) and Hansen and Bush (1999). Other items with smaller loadings or having heavy loads in multiple factors were eliminated. After performing these operations, a total of nine items are retained in this factor. Chronbach's alpha coefficient of internal reliability was calculated with the final nine items and an acceptable value of 0·89 was obtained.
Items related to supplier attributes (SA) are identified in factor 2. All items loading 0·5 or higher were part of the original structure of this factor. However, there are two items: price (pa_9) and pa_11 (product quality) that also have loadings greater than 0·5 in factor 2. Most likely, respondents consider price and product quality as part of the critical attributes any supplier needs to offer. After performing an internal consistency test, a value of 0·87 was obtained for the alpha coefficient of Chronbach. Similar study results were found in previous research by Parhizkar (2008).
In the case of factor 3, only four items have loads greater than 0·5, but they all come from the same structure of the original factor Manufacturer/Retailer marketing activities. Given this, this factor is named as before Manufacturing/Retailer Marketing Activities (RM). It is interesting to notice that the original RM factor had 12 items. This will only have four which are: radio commercials, TV commercials, advertisement in local newspapers and advertisement in magazines. The internal reliability coefficient for factor 3 is 0·89.
Five items loaded in factor 4 with loads greater than 0·5. These items are all related to barriers affecting the imports of wood products, especially from the USA. Cossio Antezana (2007) also indicated that these items (paperwork, product knowledge, international policies, lack of agents/brokers, government policies) have been found to be a potential barrier when foreign buyers are looking for new sources of international wood products.
The final factor determined using EFA is named Company Performance (CP). There are three items with loads higher than 0·5 and one item with a load of 0·48. It was decided to keep this factor to reflect at least one more dimension that measures company performance. These items tend to be important attributes of how well a company is performing (Perkins 2009). The reliability coefficient is 0·73, an acceptable value according to Nunnally and Bernstein (1994).
Correlation analysis
In order to proceed with the CFA test, a subscale was created using the function SUM in SAS. To analyse relationships between the six factors, all items in each construct were summed to get a single variable (data reduction), as suggested by Suhr and Shay (2009). After calculating the factors-based scores (subscale), a correlation analysis was performed using the SAS procedure CORR. The results of the correlation analysis are shown in Table 8.
Pearson correlations and p values for the new factors
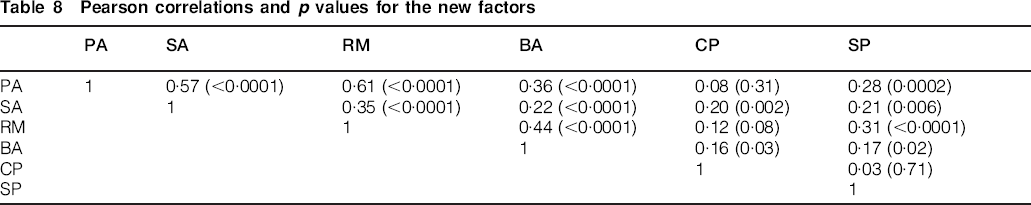
Stockwell (2008) defined that correlation values above 0·30 are considered moderate, suggesting that further examination is needed. Based on this criterion, correlations between PA and SA (0·57), PA and RM (0·61) and RM with BA (0·44) are considered important. Other found correlations are PA and BA with 0·36, SA and RM with 0·35 and RM and SP with 0·31. For correlations between PA and SA and between RM and PA, it can be seen that the data follow a linear pattern. In the case of the correlation between RM and BA, no pattern is detected. Also the scatter plot for BA and PA visually indicates a linear trend. The rest of the correlations are considered weak. It was expected to have higher correlations with the factor CP; however, that was not the case. As results from the EFA test showed, the loadings on this factor (factor 5 in Table 7) were lower than loadings on other factors. Also, the reliability coefficient was the lowest (0·73). This might explain why the correlations with factor CP are low and not very strong
Discussion and conclusion
Correlation analysis suggests (PA and RM correlation value of 0·61) that local wood products companies in Central America put a lot of emphasis in advertising their products based on product attributes. Foreign companies that plan to export to Central American markets should also pay attention to the way local companies advertise and what characteristics they would like to highlight in the products they are selling. This could be a marketing strategy that aligns well with local companies. An innovative approach would be promoting imports in these countries based on colour, species and physical attributes.
The second highest correlation was between factors PA and SA with a Pearson correlation value of 0·57. This high correlation might be an indication that suppliers of local companies in Central America have an acceptable performance as far as providing products and services that satisfy local purchasers. Current suppliers are perceived by local companies as honest, committed, patient and with an offer of high quality products, and it seems that current suppliers are highly sensitive to cultural aspects and information sharing. Any importer planning on developing a long term business relationship needs to outline a good marketing strategy to make sure that these values are included in the strategy. Setting up a local office or developing a business relationship with a broker could be the way to enter into the market since much of the values described here might be overcome by having local representation.
Retailer marketing activities (RM) and import barriers (BA) had a strong correlation (0·44) and BA and PA resulted in a correlation of 0·36. The correlations of RM and PA with BA are quite similar in nature. This suggests that companies may need to invest more time and resources focusing on barriers to understand product attributes that come from importers, as indicated by Parhizkar (2008). It might also imply that imported products might require the development of special marketing materials where the product attributes are reflected in order to overcome the lack of knowledge of imported species. Especially important is to develop a strategy of open communication where customers have easy access to the potential supplier when questions arise including product literature in the native language. While literature suggests a negative relationship of BA to SA, this model suggests that the relationship with barriers is positive. Previous studies have found that companies entering a new export market need to overcome barriers (Douglas and Wind 1987; Jain 1989; Cavusgil et al. 1993; Cavusgil and Zhou 1994) and this might lead buyers to believe that overcoming barriers is a positive attribute from suppliers.
The correlation between RM and supplier promotion activities (SA) was found to be moderate (0·35), similar to the correlation between RM and SP (0·31). Even though these correlations are moderate, this still might be an indication for wood products importers that local customers perceive or gain knowledge of suppliers through radio, television, newspaper or magazine advertisement. Interesting was also to find out that CP had low correlations with all the other factors. This might be an indication that companies in Central America do not see a good relationship between imports and company performance.
Perceptions of wood products retailers and manufacturers from Central America regarding supplier attributes, product attributes, retailer/manufacturer promotion strategy, supplier promotion strategy, potential importing barriers and company performance were tested against a conceptual model based on the literature. After applying the confirmation factor analysis and exploratory factor analysis procedures, the original proposed factors were retained. However, in five out of the six factors, the internal composition changed.
The results suggested meaningful groupings within many of the constructs, including factors such as product attributes, purchasing attributes and supplier services. These factors may be important to consider when wood products companies are interested in exporting to Central American countries. Models that explain a greater proportion of the variability would help individuals and companies in the wood products industry and research sectors understand the important driving factors predicting company performance and supplier attributes. If these drivers are known, then companies in the wood products industry can develop strategies to address the areas that would improve their company performance. Companies may need to focus on breaking the barriers to better conduct international business.