
Abstract
The gas analysis method according to EN 717 part 2 is a well-known technique to measure the formaldehyde emission of plywood and coated wood-based materials for quality control purposes. There is an increasing interest to apply this method also for uncoated wood-based panels compared to the perforator method (EN 120: 1992) owing to many reasons. As there is still limited experience in testing particleboard with this method, it is the aim of this study to evaluate the effect of some parameters to ensure correct and precise testing using the gas analysis method. Furthermore, the study aimed to show how the m.c. of panels before testing affects the Gm, and to calculate an m.c. correction factor from these results for particleboard with modern bonding systems at a low emission level. Gas analysis value and m.c. show a very good correlation. Based on this correlation an m.c. correction factor can be determined, which facilitates an m.c. correction of Gm data. This may help to improve the quality of Gm data for quality control and data comparison (i.e. for round robin tests). Combining the sampling for hour 3 and 4 as well as 2, 3 and 4 has no significant effect on the level of formaldehyde emission tested. Also the accuracy of testing was not reduced. Consequently, the change in sampling procedure may lead to a reduction on the required number of water analyses needing to be performed in the laboratory, and therefore to a reduction in consumption of chemical consumables and expenditure of human labour. The reduction of overpressure during gas analysis did not have a major effect on the values as such, but increased the coefficient of variation. Also, an increase in air flowrate did not affect the Gm at lower emission levels.
Keywords
Introduction
The gas analysis method according to EN 717 part 2 is a well-known technique to measure the formaldehyde emission of plywood and coated wood-based materials for quality control purposes. There is an increasing interest to apply this method to uncoated wood-based panels as well. Compared to the perforator method (EN 120: 1992), the gas analysis method (GAM): requires no toluene; is easy to handle in the laboratory; has good sensitivity at low formaldehyde levels; has an improved correlation to the reference method, and therefore requires less safety margins; and is applicable to CARB requirements. Additionally, the updated version of EN 13986, which is still under discussion, will allow also the GAM to be used for internal quality control of uncoated wood-based panels, if the correlation with the reference method (EN 717 part 1: 2004) is established. In addition, it would be beneficial to decrease the testing time for the gas analysis procedure or at least the amount of expended work for this technique.
Meyer and Schwab (2011) showed that a general correlation for each panel type between the reference method (EN 717-1: 2004) and perforator (EN 120: 1992) cannot be established satisfactorily for panels at emission levels below E1. It was indicated that a more suitable general correlation might be possible between the reference and gas analysis method (EN 717-2: 1994). Nevertheless, the gas analysis method is in use for quality control purposes for plywood and coated panels, but there is a lack of long-term experience with this method for un-coated particleboard, OSB and MDF.
Round robin tests for the gas analysis method (EN 717-2: 1994) commonly show quite high inter-laboratory deviations determining the formaldehyde release of wood-based panels. Some variations during the testing procedure may have a significant effect on the testing results, e.g. testing parameters and moisture content of the samples before testing.
The influence of panel moisture content on the results of the so called perforator method (EN 120: 1992) is well known. Consequently, an m.c. correction factor was determined to refer the tested value on a panel moisture content of H = 6·5%. The limit values for E1- and E2-level as well as correction factors are given in EN 300 (2006) for OSB, in EN 312 (2010) for particleboard, and in EN 622-1 (2003) for MDF.
Jann and Deppe (1989, 1990) already demonstrated the correlation between formaldehyde release tested with the gas analysis method and the initial moisture content before testing of UF-bonded particleboard panels. They calculated an exponential function for the moisture correction factor.
As there is still limited experience in testing particleboard, it is the aim of this study the effect of some parameters (i.e. sampling procedure, air flowrate, overpressure) shall be tested to ensure correct and precise testing by the GAM. Furthermore, it was to demonstrate how the m.c. of panels before testing affects the Gm, and to calculate an m.c. correction factor from these results for particleboard with modern bonding systems for an emission level below E1.
Material and methods
To evaluate the effect of m.c. on the gas analysis value, industrial particleboard on the CARB emission level and a nominal thickness of 19 mm were used. Particleboard were taken from industrial production and initially tested for their formaldehyde release according to EN 717-1 (2004) (resulting steady state concentration C = 0·064 ppm). Additional samples were formed for testing moisture content according to EN 322 (1993) and for performing the gas analysis according to EN 717-2 (1994) with the device GA5000 by GreCon, Alfeld, Germany. Samples were taken from one large scale panel (length×width = 5370×2010 mm) and were randomly distributed excluding the edges of the panel (taken as a width of 500 mm). These samples were conditioned under various climate conditions until mass constancy was reached before testing. The climate conditions were:
testing of samples without conditioning
20°C and 35% r.h. (relative humidity)
20°C and 65% r.h.
20°C and 85% r.h.
23°C and 45% r.h.
directly before testing samples were dried for 24 h at 103°C.
Another set of panels and samples were utilised to study the effect of a different formaldehyde sampling regime during four of hours testing: Samples were taken from a 16 mm and a 19 mm industrial particleboard, respectively, both with a CARB emission level. These samples were tested with the gas analysis method after conditioning in standard climate conditions (20°C and 65% r.h.), and under three different procedures:
according to the standard
the outlet air of sampling time 3 and 4 was led through the same wash bottle without changing the water
the outlet air of sampling time 2, 3 and 4 was led through the same wash bottle without changing the water.
Consequently, during sampling according to procedure (ii) and (iii) the formaldehyde was accumulated in the same water and the number of water samples which needed to be analysed was reduced. It was the intention to evaluate if the accuracy was sufficient and coefficient of variation did not increase. For each panel and sampling procedure six samples each were tested.
For analysing the influence of overpressure in the gas analysis chamber during testing another set of samples was utilised: samples were taken from two 16 mm industrial particleboards with an emission level of E1 and CARB, respectively. These were tested with the gas analysis method at an overpressure of 1050 Pa (as it is according to the standard) and of 550 Pa, respectively. To achieve a low pressure during testing the amount of water in the gas wash bottles was reduced and the height of the glass inlet for the air into the wash bottle was adjusted.
Additionally, to demonstrate the effect of air flowrate, samples from 19 mm industrial manufacture CARB and E1 panels, respectively, were tested. The air flowrate was set to 60 L h−1 (as required in the standard) as well as to 90 L h−1 for testing these samples. If was possible to adjust the air flowrate with the control unit of the gas analysis device.
Results and discussion
Effect of m.c. on gas analysis value
The mean value, number of values and coefficient of variation for the Gm and m.c. of the samples after conditioning at different levels are given in Table 1. The coefficient of variation is higher somehow than expected and compared to other studies (e.g. Ohlmeyer et al., 2012). This might be explained by the large amount of samples tested: the samples from all conditioning steps were tested in a randomised order. Consequently, the total testing period was about six weeks. During this period a minor drift of values was determined, which lead to a higher variation of Gm values over all.
Results of Gm (EN 717-2: 1994) and m.c. after conditioning – mean values, number of samples, and correlation of variation
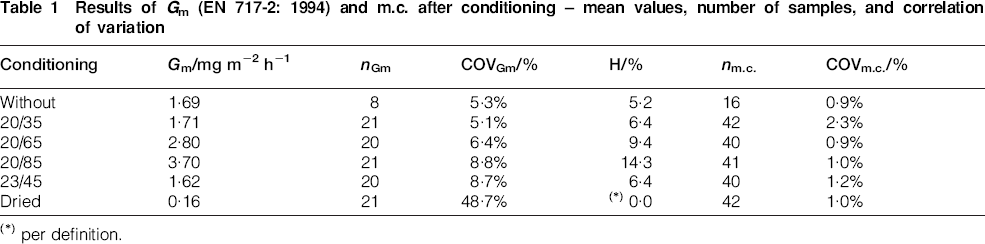
per definition.
A very good correlation of the Gm and m.c. was found up to the maximum m.c. of H = 14% (Fig. 1). From these values, the correction factor for the m.c. of the panels can be calculated to adjust to a reference m.c. of H = 6·5% (Fig. 2). Concordantly to the standards for perforator testing of particleboards the Gm can be corrected with a factor to eliminate the effect of panel m.c.
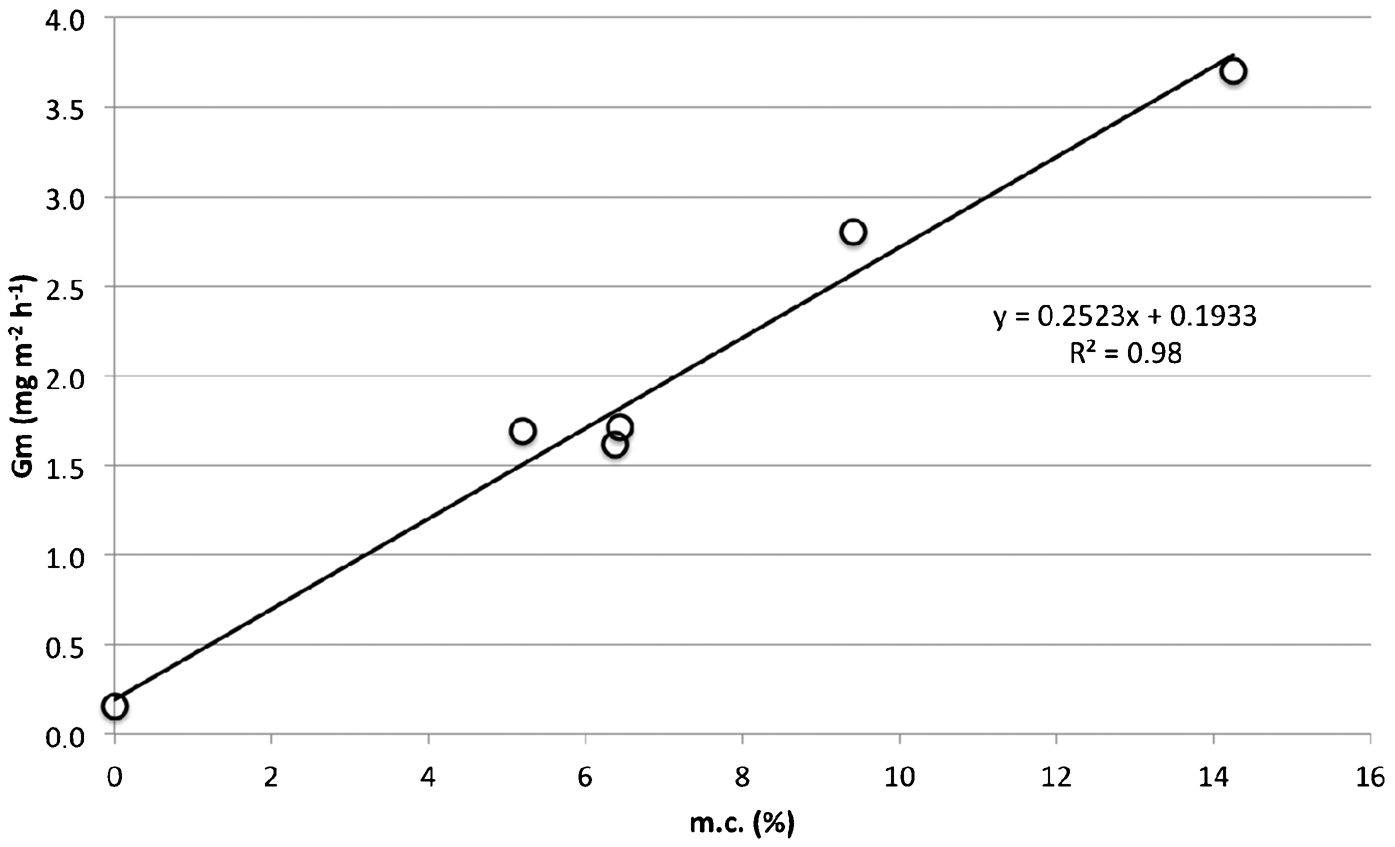
Correlation between panel m.c. before testing and Gm
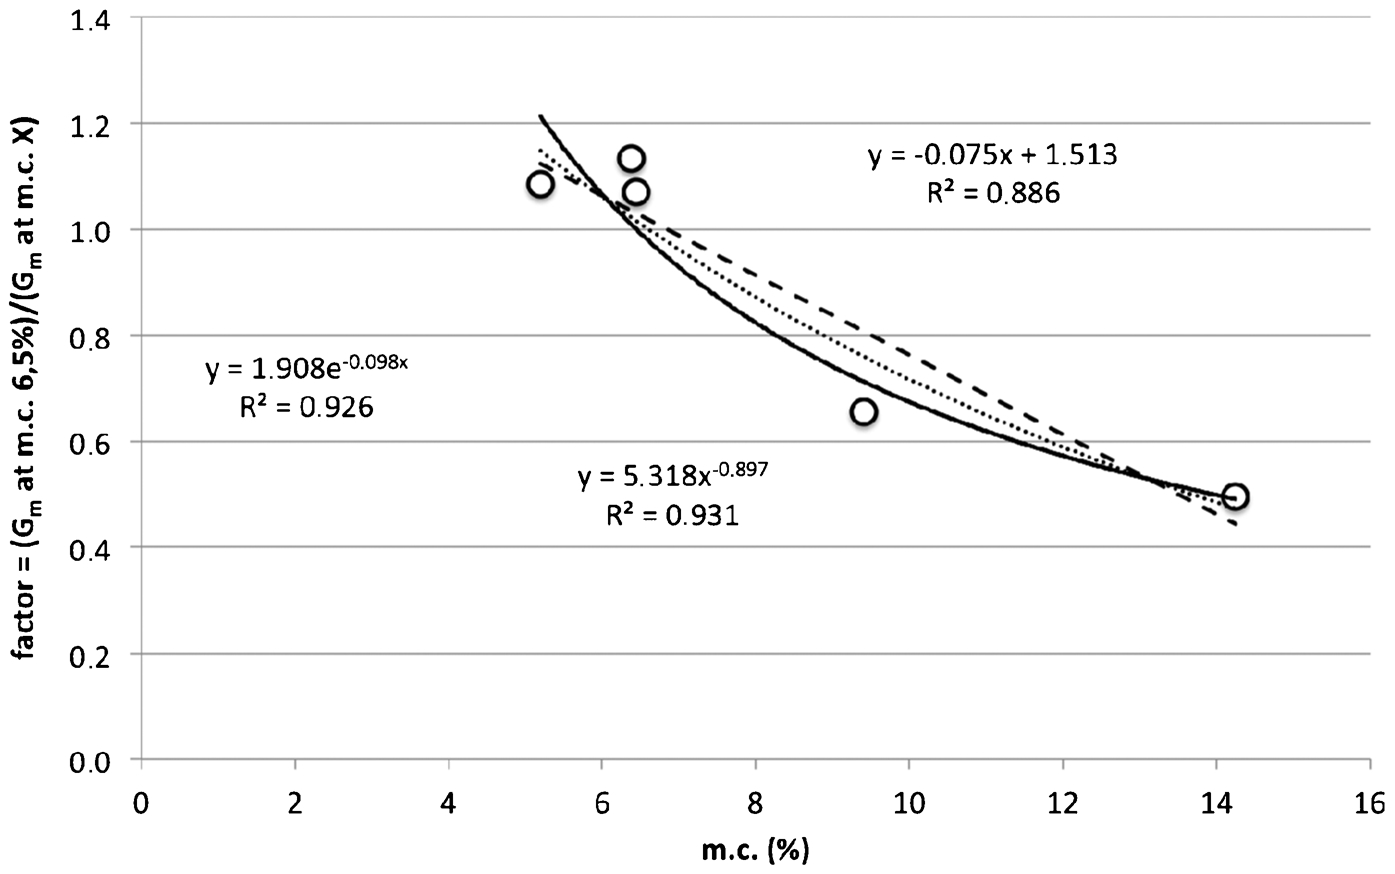
Calculation of m.c. correction factor from relation between m.c. and quotient of Gm at m.c. H = 6·5% and Gm at m.c. X
For the tested material the following equation was found to fit best: F = 1·908e−0·098H.
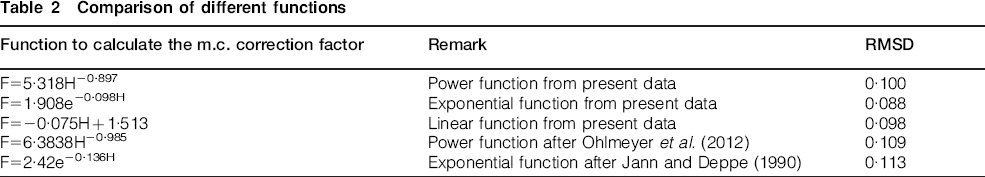
The equation given in the standard for particleboard, MDF and OSB are linear of exponential one. In comparison to Jann and Deppe (1990) and Ohlmeyer et al. (2012) the exponential function fits best to present data. In Table 2 the different equations are given to calculate the m.c. correction factor. For the evaluation of the quality of the equations the root mean square deviation (RMSD) was applied: the lower the RMSD, the better the fitting of the equation. The above mentioned formula can be applied to correct the Gm within an m.c. range of 5%≤H≤14%.
Comparison of different functions
Different formaldehyde sampling during four hours testing
Figure 3 shows the results for the varied sampling procedure for the gas analysis method. The left graph represents the result for the 16 mm CARB panel and the right one the result the 19 mm CARB panel. Each graph shows three columns: Gm for the standard procedure, Gm (3+4) for the procedure where the outlet air of sampling time 3 and 4 was led through the same wash bottle without changing the water, and Gm (2+3+4) for the procedure where the outlet air of sampling time 2, 3 and 4 was led through the same wash bottle without changing the water. The values do not vary significantly on changing the sampling procedure. For the 16 mm CARB sample even the coefficient of variation did not increase when sampling the outlet air with one wash bottle. The samples of the 19 mm CARB panel exhibited a minor increase in the CoV but it was still less than 5%.
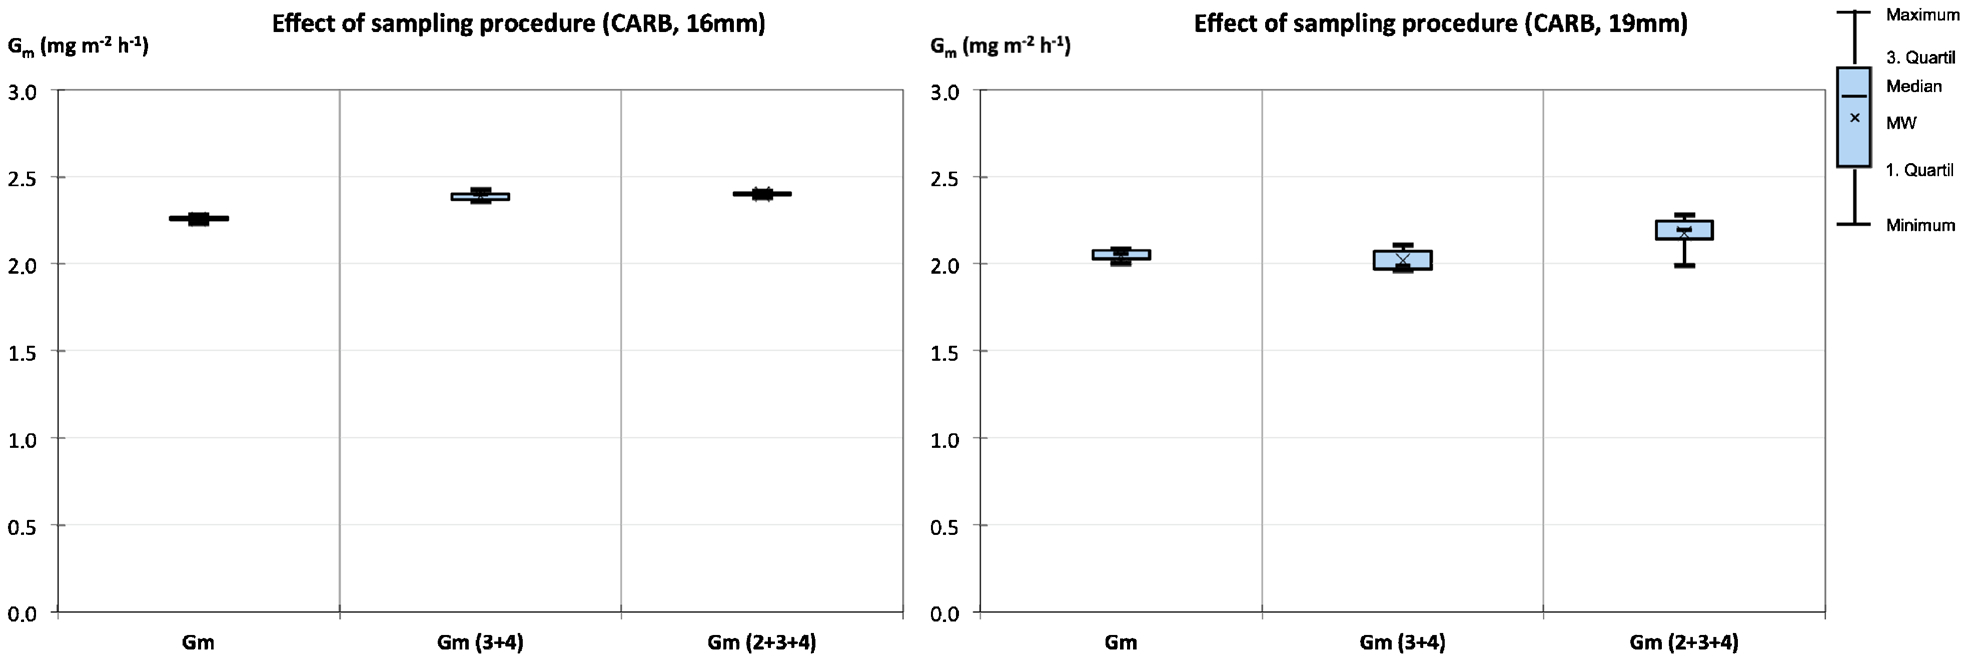
Effect of sampling procedure for different panels (each n = 6): CARB 16 mm (left) and CARB 19 mm (right)
Consequently, no significant effect was determined sampling the outlet air after the first hour together. This leads to a reduced number of water analysis samples processed in the lab without a reduction in accuracy. Although, the emission level of the samples and resulting amount of formaldehyde needs to be considered and the amount of other parameters needs to be taken into account in order to avoid the formaldehyde concentration in the water exceeds levels, which are suitable for the analysis.
Reduced overpressure during testing
Varying the overpressure during testing has a minor effect on the level of the results, considering the large change applied (about factor 2). Especially at the low emission level the difference can be neglected. However, the coefficient of variation increased remarkably (Fig. 4). This can be explained by the conditions of the testing procedure: to achieve a lower overpressure in the chamber, the amount of water in the wash bottles was reduced, and the height of the glass inlet for the air into the wash bottle was adjusted.
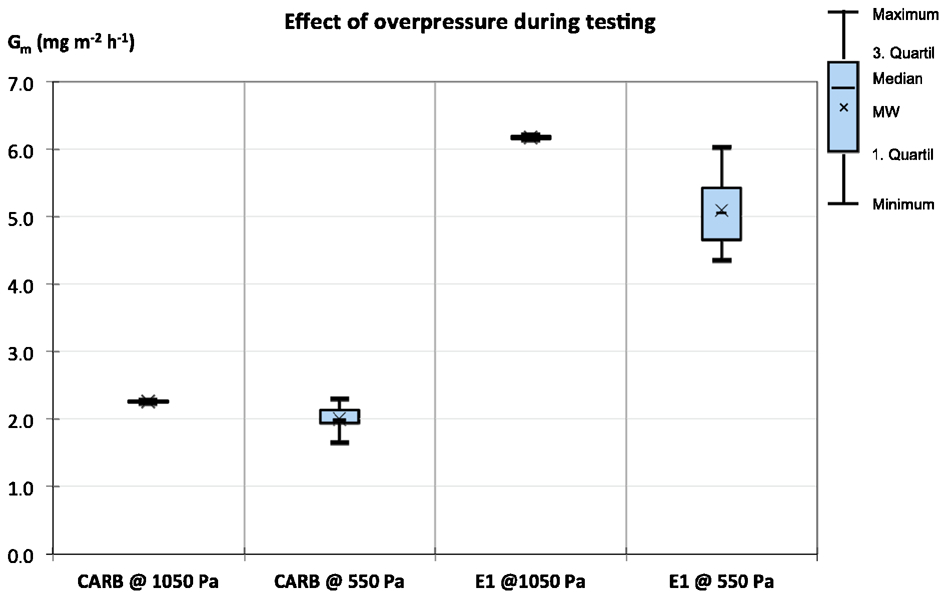
Effect of overpressure during testing on Gm (n = 6)
The reduction of hydrostatic pressure led to a reduced water depth for the air to pass. The time for the formaldehyde in the air to be absorbed by the water was consequently much shorter. This implies a reduction in accuracy for the testing procedure. However, changing the equipment (i.e. glass tube diameter or air outlet geometry) suitable accuracy might be achieved as long as the Gm is not dependent on the overpressure.
Increased air flowrate during testing
The air flowrate had a minor effect on the level of Gm for low emitting samples (Fig. 5). For E1 panels the mean value was lower at the higher air flowrate, and again the coefficient of variation increased. This may be due to the same reason as stated above for the overpressure. With a higher air flowrate the velocity of the air passing the wash bottle increases. This decreases the time for the water to absorb the formaldehyde from the air. Consequently, some formaldehyde may not be absorbed by the water.
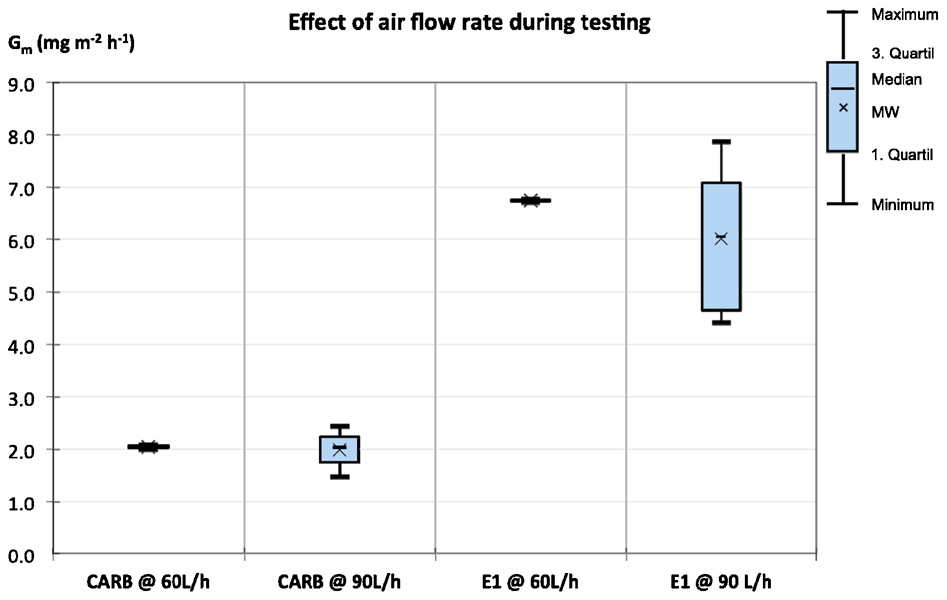
Effect of air flowrate during testing on Gm (n = 6)
Conclusion
The gas analysis value and m.c. showed a very good correlation in the panels studied. Based on this correlation an m.c. correction factor can be determined, which facilitates an m.c. correction for Gm data. This may help to improve the quality of Gm data for quality control and data comparison (i.e. for round robin tests). However, more data is still needed to check the validity for a broader variety of panels (i.e. panel thickness, MDF, OSB) and emissions levels.
Combining the sampling for hour 3 and 4, or for hour 2, 3 and 4, had no significant effect on the level of formaldehyde emission tested. Furthermore, even the accuracy of testing was not reduced. Consequently, the change in sampling procedure may lead to a reduced number of water analyses which need to be performed in the laboratory, and therefore to a reduction in consumption of chemical consumables and expenditure of human labour.
The reduction of overpressure during gas analysis did not have a major effect on the values as such, but increased the coefficient of variation. Also, an increase in air flowrate during gas analysis did not affect the Gm at lower emission levels, but increased the CoV. Consequently, the parameters given in the standard are most suitable for optimal data quality on E1 emission level, but at lower emission level (i.e. CARB) a higher air flowrate had a minor effect.