
Abstract
The United Kingdom emitted 628 Mt CO2 equivalent (CO2e) as greenhouse gases in 2008. United Kingdom (UK) policy is to decrease these emissions to 154 Mt by 2050. This paper investigates the role that wood construction products and wood-based panels may play in mitigating these greenhouse gas emissions. In this paper, we have concentrated on production and consumption in 2005: all solid wood products and wood based panels consumed in the UK in 2005 contained almost 16 Mt CO2e. Using established international methodologies and the ‘stock change approach’ to carbon storage, the net increase in CO2e stored in all UK wood products in 2005 was calculated to be 7·1 Mt CO2e. Applying the newer UNFCCC ‘production approach’ gave a net increase in CO2e stored in wood based panels and solid wood of 3·4 Mt CO2e in 2005, approximately half of this storage was in wood based panels.
The focus of previous UK studies of carbon in construction has been new housing. We estimate that only 10% of CO2e contained in all UK solid wood and wood based panel products consumed went into new housing in 2005. We have modelled the storage of CO2e in solid wood and wood based panels for other construction sectors and used this to model changes in construction methods: if current trends in UK housing construction methods continue and are extended to other construction sectors, there is the potential to increase the annual increment of CO2e stored in wood products in construction from 9 Mt CO2e to 14 Mt CO2e (more than 2% of the total annual UK greenhouse gas emissions).
Introduction
In response to predicted changes in climate, the UK government has passed the Climate Change Act (HM Government, 2008). From this act, UK policy is to reduce greenhouse gas (GHG) emissions by 80% by 2050 against the 1990 baseline. In 2008, UK GHG emissions were 628 Mt CO2e (Department of Energy and Climate Change, 2010) (Fig. 1). There has been a decrease of around 150 Mt CO2e from the 1990 values. Within these total emissions, around 85 Mt CO2e (about 15% of the total) are currently emitted from residential sources, with the vast majority of these emissions coming from domestic combustion for energy. These residential emissions have not changed much from the 1990 levels (though this is against a background of increasing housing stock).
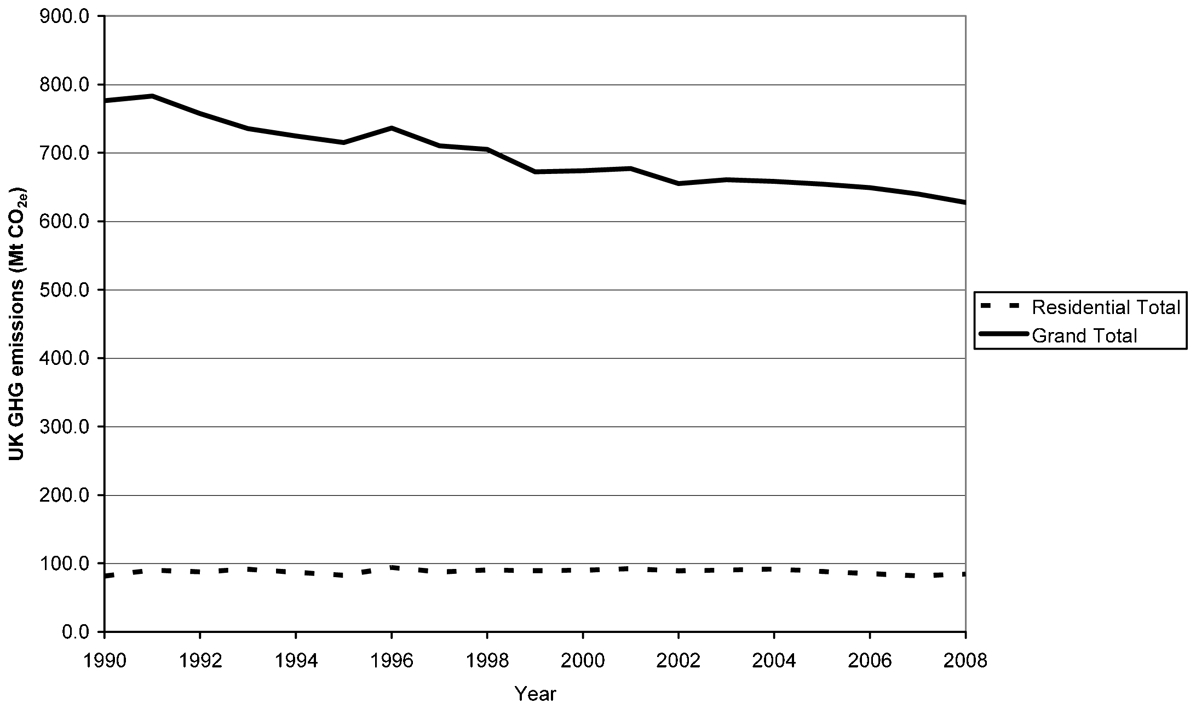
Decrease in total UK GHG emissions and residential GHG emissions from 1990 to 2008
The 80% reduction target means that the UK needs to reduce GHG emissions to 154 Mt CO2e (Fig. 2) by 2050. Reaching this target is a big task and we propose in this paper that both counting and increasing the amount of carbon stored in harvested wood products (HWPs) could assist in reaching this target.
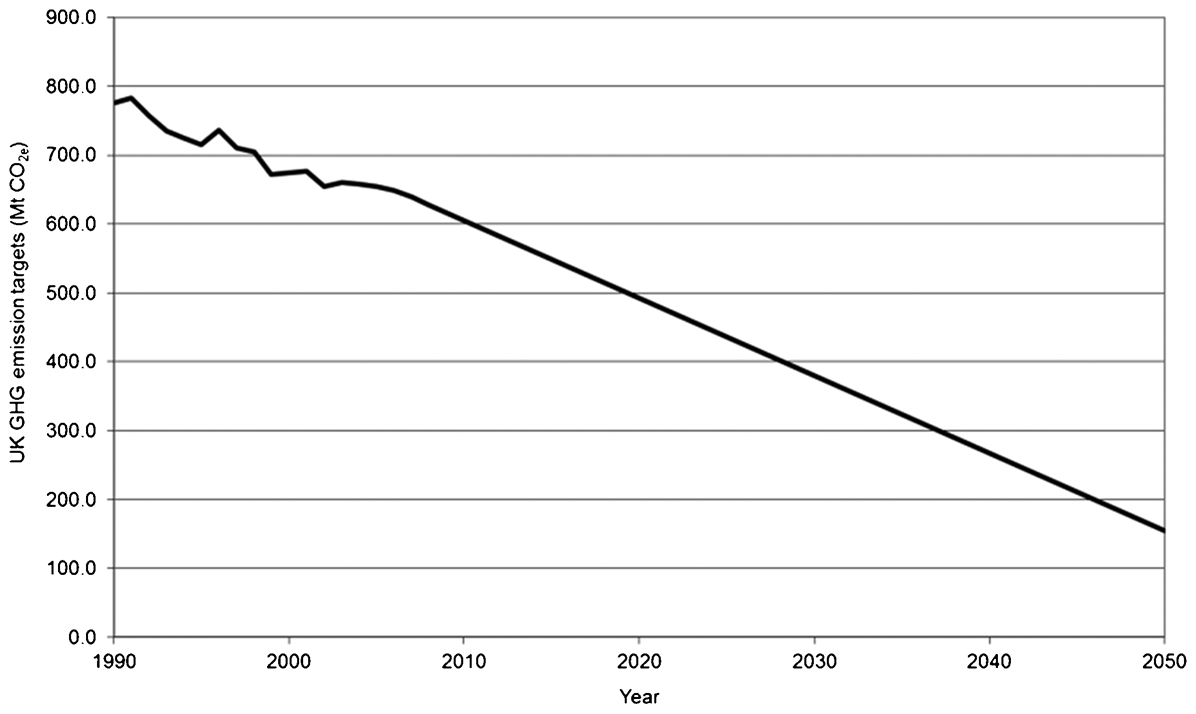
Decrease in UK GHG emissions needed to meet 80% reduction target by 2050
This work came about because the authors were asked by the UK's National Non-Food Crops Centre (and particularly their technical working group on renewable construction materials) to investigate the current state of knowledge about how building materials made from renewable materials might be included in the UK's carbon accounts, and to gauge the potential impacts of their inclusion on the national carbon accounts. While there is growing interest in using agricultural products and co-products in construction (and the use of non-wood products is continuing to increase), it was quickly apparent that wood products dominated this area and this work on wood products forms the basis of this paper.
In this paper the authors looked first at applying the Intergovernmental Panel on Climate Change (IPPC) guidelines and their Tier 1 methodology to the UK consumption of harvested wood products; applied the more recent decision on harvested wood products taken at the UNFCCC Conference of Parties in Durban (known as COP 17); reviewed the previous work which has largely been focused on wood used and carbon stored in new UK housing; and, modelled the use of wood and carbon stored in all construction sectors. Finally, the potential to store more carbon in construction by changing construction techniques is considered.
Applying IPCC guidelines to UK wood consumption
At an international level, the IPCC updated their national guidelines for GHG inventories in 2006. Volume 4 of these guidelines covers Agriculture, Forestry and Other Land Use and within this volume, Chapter 12 is on Harvested Wood Products (Pingoud et al. 2006). This development is important because it changed the previous IPCC approach to wood products. In previous guidelines, it was assumed ‘that all carbon biomass harvested is oxidised in the removal [harvest] year’ and that the inflow and outflow of carbon into products was assumed to be zero for inventory purposes. These guidelines supersede the previous assumptions and set out a number of methodologies for counting harvested wood products in national GHG inventories.
More recently, at the climate change meeting in Durban in late 2011, it was decided to include harvested wood products in the second international climate commitment period (UNFCCC, 2012), which started at the end of the first commitment period (at the end of 2012).
Potential carbon dioxide stored in UK wood product consumption
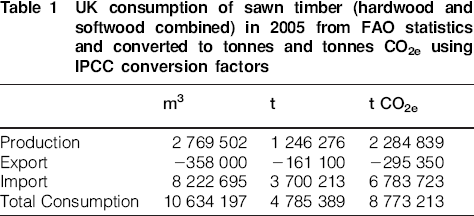
Using available FAO statistics for the United Kingdom (Food and Agriculture Organisation of the United Nations, 2012), the apparent consumption of solid wood and wood based panel products which can be used in UK construction can be calculated (Tables 1 and 2). In addition, using the conversion factors from the IPCC (Pingoud et al. 2006), these products are represented in these tables in terms of CO2e.
UK consumption of sawn timber (hardwood and softwood combined) in 2005 from FAO statistics and converted to tonnes and tonnes CO2e using IPCC conversion factors
UK consumption of all wood based panels in 2005 from FAO statistics and converted to tonnes and tonnes CO2e using IPCC conversion factors
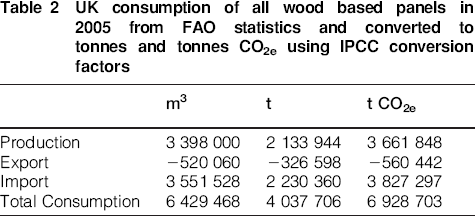
The combination of these amounts of CO2e stored in sawn timber and wood based panels is a total UK consumption equivalent to 15·7 Mt CO2 and a total UK production equivalent to 5·9 Mt CO2. The total UK consumption figure represents 2·4% of the total GHG emissions for 2005 and 17·8% of residential emissions.
Applying IPCC ‘harvested wood product’ approaches to UK wood consumption
While there is carbon dioxide stored in the wood products consumed each year, as time progresses these products are taken out of service to be recycled, burnt for energy recovery, disposed of to landfill or through decay in service. The downloadable model (IPCC Task Force on National Greenhouse Gas Inventories, 2006) produced by IPCC uses the available historic FAO data and applies a ‘first order decay’ method (Pingoud and Wagner, 2006) which estimates the amount of products taken out of service each year to develop a ‘Tier 1’ estimate of CO2e stored in harvested wood products. In this paper, apart from this first order decay, the carbon in wood either ‘stored’ in landfill or carbon dioxide and methane emitted from landfill have not been included. The Tier 1 methodology does not use a full life cycle inventory of UK wood products. In the terms of the IPCC methodology, this would entail a Tier 3 analysis to be performed.
Within the original IPCC model (IPCC Task Force on National Greenhouse Gas Inventories, 2006), the standard first order half-life function is applied to two product categories: wood products (including wood based panels); and, paper products. The default half-lives for these products are thirty years and two years respectively. This allows the proportions of these product categories remaining in service to be calculated using the following equation

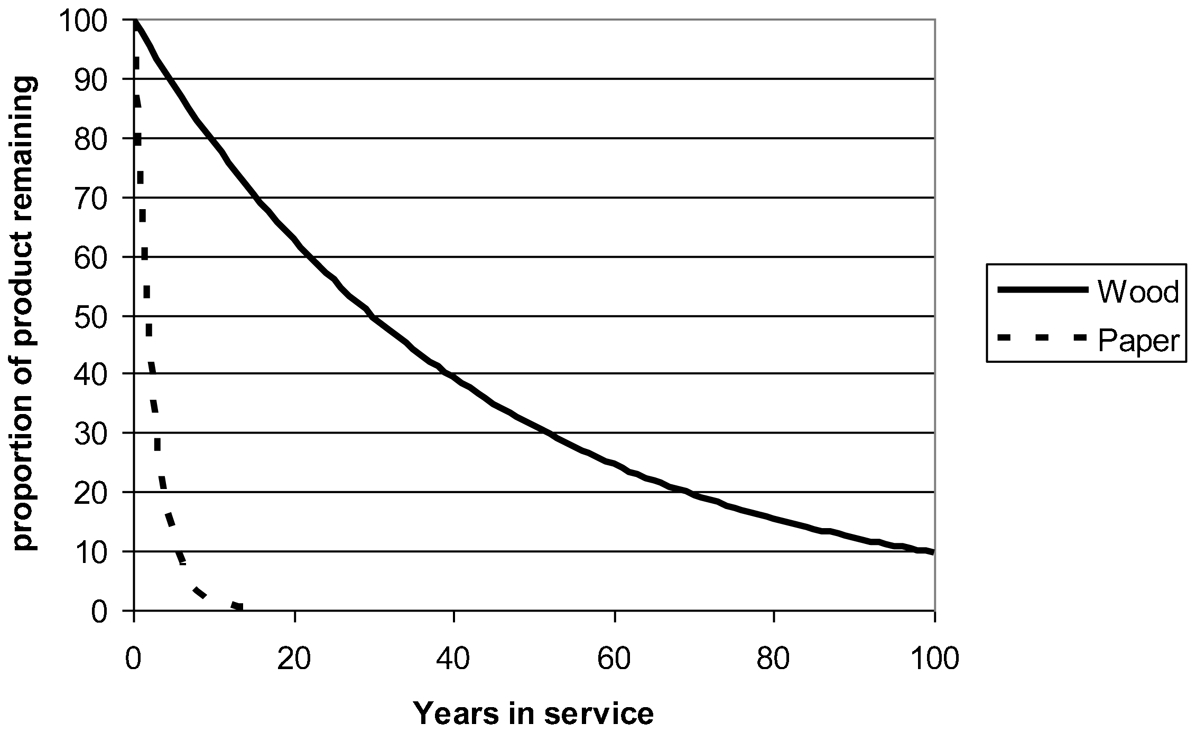
Proportion of product categories remaining in service (%) with half-life of thirty years for wood products and two years for paper products
Applying the IPCC HWP ‘stock change’ model (which includes the carbon dioxide stored in imported harvested wood products) to UK wood consumption since 1990, gives a net annual increase in storage of carbon dioxide equivalent in 2005 of 7·1 Mt for all wood products (1·1% of all UK greenhouse gas emissions) and 5·7 Mt for only wood and wood based panels (0·9% of all UK greenhouse gas emissions). As can be seen in Fig. 4, the stock change approach calculates that the carbon dioxide stored in solid wood and wood based panels accounts for most of the annual increment in carbon dioxide stored in all harvested wood products in recent years.
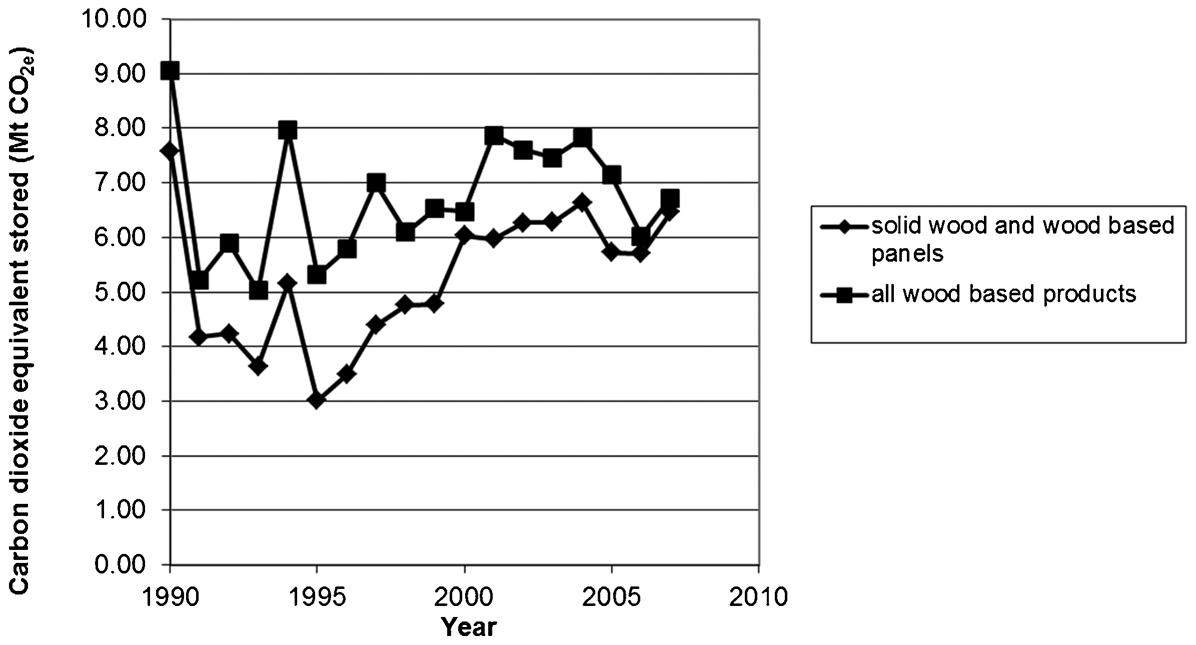
Net annual storage of carbon dioxide in UK wood products calculated using IPCC model (stock change approach)
The IPCC's ‘production’ approach (which excludes the carbon dioxide stored in imported HWPs, and has been adopted by the UNFCCC) gave a net storage of 3·6 Mt CO2e for solid wood and wood based panels.
It should be noted that current ‘official’ approaches used by the UK government for the official reporting of greenhouse gas stored in harvested wood products also use half-lives (Dyson, 2009). However, these half-lives are somewhat arbitrary, with no relationship to end uses. Half-lives are currently related to the growth rotation length of the trees: 0·9 years half-life for thinnings; 14 years half-life for softwoods; and, 21 years half-life for hardwoods. These half-lives are quite different to the half-lives used internationally.
Applying UNFCCC decision to UK wood consumption
The decision taken at Durban (UNFCCC, 2012) is that if ‘transparent and verifiable activity data for harvested wood products …. are available’ a country can use the IPCC production approach (i.e. excluding imported wood products) and three product-types based half-lives of 2 years, 25 years and 30 years for paper products, wood based panels and solid wood respectively. If verifiable country specific half-lives are available for product groups these can also be applied.
Applying this recent decision and half-lives to the available FAO statistics for wood based panels and solid wood, using the IPCC production approach gave a net storage of 3·4 Mt CO2e in 2005 (0·52% of total UK GHG emissions in 2005). For the UK and for solid wood and wood based panels, the change in product half-lives had a minimal impact on calculated CO2e storage and the decision to use the production approach rather than the stock change approach reduces the UK storage in 2005 by 2·3 Mt CO2e.
Carbon stored in UK produced wood based panels
If we just look at the CO2e stored in UK produced and UK consumed wood based panels in 2005, 2·7 Mt CO2e was stored in new composites and, using the 25 year half-life for wood-based panels, it is estimated that 0·96 Mt CO2e was in wood-based panels coming out of service. The estimated net storage was 1·74 Mt CO2e in 2005. As UK production and consumption has grown, so has the net storage of CO2e stored in wood based panels (Fig. 5).
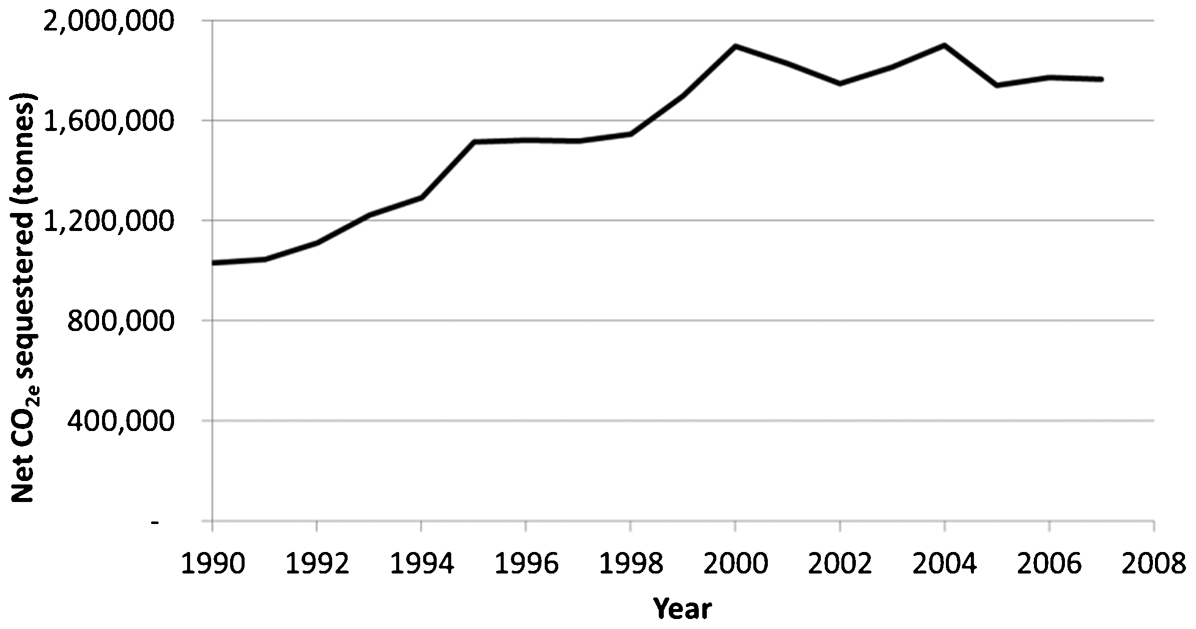
Net annual storage of carbon dioxide in UK produced and consumed wood based panels
Carbon stored in UK housing
While the IPCC model described above gives an overall picture and flow of wood products in the UK, we are aiming to quantify the importance of HWPs in construction in carbon storage. In order to gauge this importance, the rest of this paper concentrates on modelling the consumption of wood products in the UK construction sector. Most previous studies have concentrated on housing.
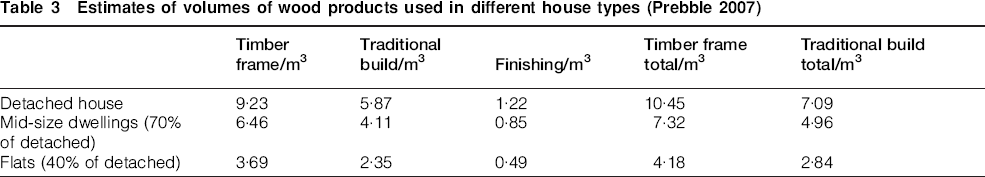
Housing statistics for the United Kingdom are readily available (Department for Communities and Local Government, 2009) and most studies of wood product utilisation in UK construction are based on the housing market. In 2005 there were 235 460 housing starts in the United Kingdom. There are two major construction techniques in the United Kingdom: traditional brick and block production; and, a growing amount of timber frame housing. It is estimated that in 2005, approximately 17% of the housing starts were timber framed. Previous studies (Prebble 2007; Suttie et al. 2009; Sadler 2010) developed estimates of wood use for these construction methods. Prebble (2007) estimated the amounts of structural wood products used in different housing types and these are summarised in Table 3.
Estimates of volumes of wood products used in different house types (Prebble 2007)
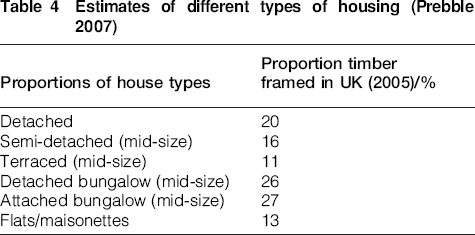
Combining these estimates with estimates of different types of houses, building techniques (Table 4) and conversion factors, gives an estimate of wood used in houses (1·3 Mm3) and CO2e (1·1 Mt CO2e) stored in new houses in 2005.
Estimates of different types of housing (Prebble 2007)
The more recent Read Report (2009) provided data on the wood content of different building components in an average house. Using data from the Read Report, different long term wood product components were combined in average size UK timber frame (and wood component rich) and non-timber frame houses. In addition, estimates were made of the wood products contained in interior and exterior joinery, furniture, fencing and garden timber for an average sized house (Table 5). It was assumed that all wood products used were solid wood in these calculations.
Volumes of wood in house elements for timber framed and traditional build houses (Suttie et al. 2009)
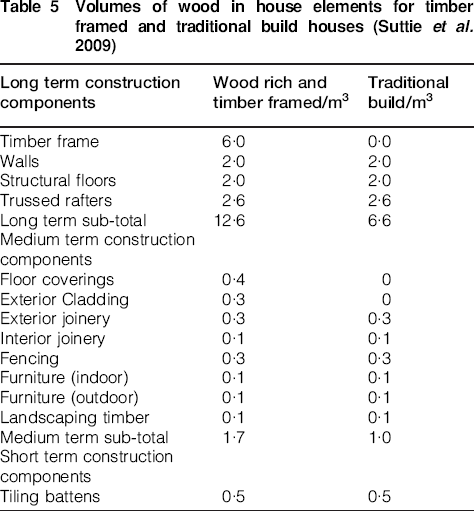
Combining these figures with the housing starts in 2005 and the estimated proportion of timber framed houses (17%) gives 2·2 Mm3 of wood used, containing 1·8 Mt of CO2e stored, in houses.
Sadler (2010) estimated the wood usage in different types of house in tonnes divided by square metres (t m−2). Sadler divided timber frame into ‘timber frame brick clad’ and ‘timber frame timber clad’. The timber frame timber clad category was developed for future projections and the proportion in 2005 was not significant. Sadler's calculations were all based on an average house size of 88 m2. The wood usage from Sadler (2010) is presented in Table 6, together with the calculated wood usage per house in cubic metres.
Estimates of volumes of wood used in different house types (Sadler 2010)
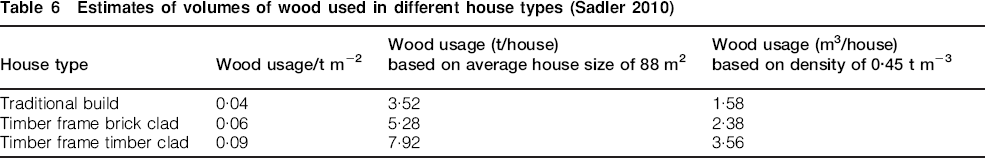
Using the proportions of each house type in Sadler (2010) for 2005 and combining these with the housing starts in 2005, gives 1·7 Mm3 of wood used in the new houses, containing 1·4 Mt CO2 stored.
Clearly, there is a large gap between these estimates of wood used in new houses (1·3–2·2 Mm3) and the total UK wood consumption (17 Mm3). Only about 10% of total wood consumption is in new house construction.
Modelling carbon storage in wood products across ALL UK construction sectors
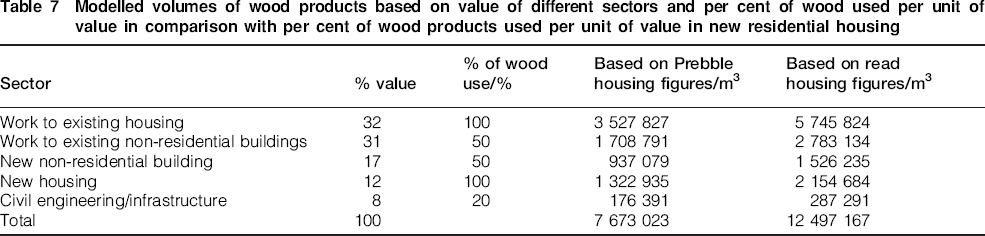
Unfortunately, there is a lack of accurate statistics for wood product use in other UK construction sectors. In order to estimate the use of wood products across UK construction a simple model has been constructed by using the value of different construction sectors and making estimates of wood utilisation rates, in comparison with the housing sector. A report by Davis Langdon (Davis Langdon Consultancy 2004) looked at the value of construction materials used in the UK in the year 2000 and estimated that the demand for building materials in the new build housing sector was only 12% of total value of demand.
Other sectors were estimated at: work to existing housing 32%; work to existing non-residential buildings 31%; new non-residential building 17%; and, civil engineering/infrastructure 8%.
However, for the purposes of this model, it is also estimated that the non-residential sector uses approximately 50% of the amount of wood used in housing (for every unit of value) and that the civil engineering/infrastructure sector only uses 20% of the amount of wood used in housing (for every unit of value).
Applying this value–volume model across other construction sectors, while using the housing usage figures as a baseline, gives an approximation of the wood product utilisation in construction within the UK (Table 7). These estimates are based on the minimum [Prebble housing figures (Prebble 2007)] and maximum [Read Report housing figures (Suttie et al. 2009)]. The Sadler (Sadler 2010) result is close to the mean of these two.
Modelled volumes of wood products based on value of different sectors and per cent of wood used per unit of value in comparison with per cent of wood products used per unit of value in new residential housing
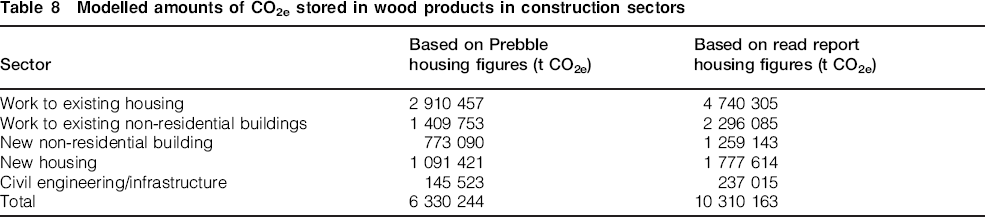
From these modelled figures, the amount of total carbon stored in the different construction sectors can also be estimated (Table 8). The Read Report figures in Table 8 are equivalent to 1·6% of total UK greenhouse emissions in 2005.
Modelled amounts of CO2e stored in wood products in construction sectors
Future construction trends and carbon storage
According to government targets, the UK Code for Sustainable Homes has a role in contributing to the targeted 12 Mt CO2e emissions reduction for homes and communities (Department of Energy and Climate Change 2009). In addition, sustainable and low carbon construction has risen to become the central theme for construction over the past 10 years (although most current initiatives focus on reducing energy consumption, rather than materials). Timber rich house construction has also been increasing: timber frame is already the dominant type of house construction in Scotland and has a steadily rising market share in England (from 8% in 1996 to 25% in 2010).
We have considered three approaches to estimating the increase in carbon dioxide storage in UK construction.
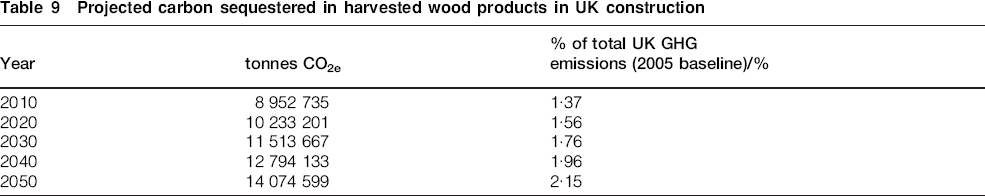
First, we have assumed that current house construction trends continue (and that these trends are reflected in all other construction sectors). In this approach, it is assumed that there is a long-term average of 200 000 housing starts/year, with the percentage of timber frame housing increasing by 2% of the total/year. Using the construction sector model outlined above and basing the projection on the 2005 wood consumption figures, the gross amount of CO2e in all harvested wood products in construction are shown in Table 9.
Projected carbon sequestered in harvested wood products in UK construction
Second, we have recommended a series of interventions to accelerate the increase of timber rich construction in the UK, particularly using UK grown wood. These recommended policy interventions are detailed in our other paper prepared for this conference (Newman et al. 2013).
Third, we modelled the potential effect that policies to support the increased use of HWP (including other building materials containing biogenic carbon) might have on the growth of the carbon store in UK construction (Sadler and Robson 2011). The model is based on the intensity of HWP use measured in tonnes/m2 of floor area. The key assumptions and model inputs are as follows:
the starting year for the model is 2010
modest growth of the building sector by 0·5% annually to 2030 and 0·25% to 2050
initially a 4% annual increase in HWP usage per total building floorspace is assumed, slowing to 2% by 2030 and 1% by 2040
initial HWP quantity in buildings based on existing floorspace and HWP intensity of 0·03 t m−2
demolition removes 0·1% of the total HWP quantity annually
methane emissions reduce overall benefits of carbon sequestration by 15%.
The results of the model are illustrated in Fig. 6 which shows growth in net (after removals) annual HWP carbon sequestration from 7·8 Mt CO2e in 2010 to about 10 Mt CO2e in 2020 and 22 Mt CO2e in 2050.
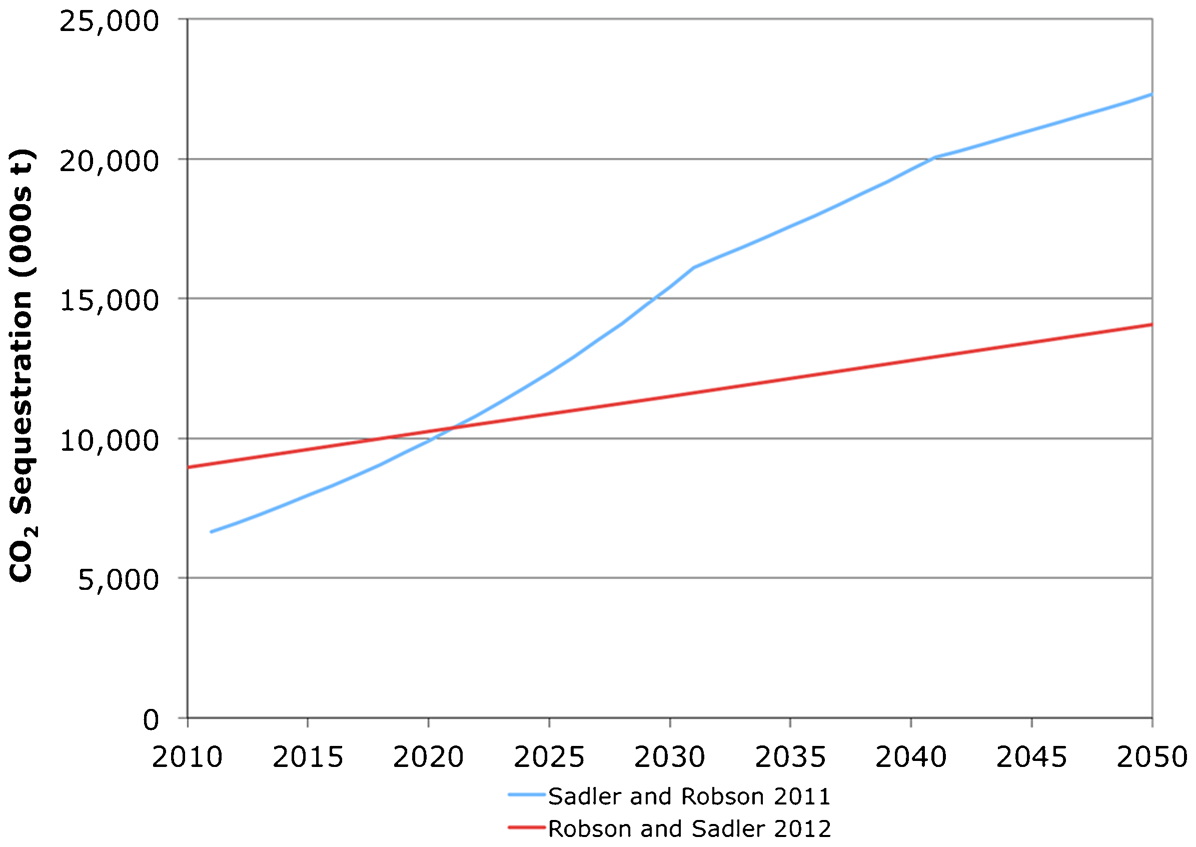
Carbon sequestration by buildings: future projections
Conclusion
In terms of the original objectives of this work and the limitations of a Tier 1 approach, there is the potential to store a significant percentage of UK greenhouse gas emissions in harvested wood products and in wood products being used in construction. In addition, if construction methods and materials continue to change, the proportion of GHG emissions stored will increase. The recent decision (UNFCCC 2012) to only use the IPCC production approach in national carbon accounts will increase the focus on using home grown wood products in long term applications such as construction. In addition, if the UK is to include harvested wood products in the UK's overall carbon accounts the amount of wood used in construction may need to be measured and reported more accurately.
Footnotes
Acknowledgements
This work was supported by the National Non-Food Crops Centre Technical Working Group on Renewable Construction, now incorporated as the Alliance for Sustainable Building Products (![]() ). The work was funded by the Department of Energy and Climate Change. David Robson was supported by the National School of Forestry at the University of Cumbria while this study was performed.
). The work was funded by the Department of Energy and Climate Change. David Robson was supported by the National School of Forestry at the University of Cumbria while this study was performed.