
Abstract
Following the 27 February 2010 (Mw = 8.8) Offshore Maule, Chile earthquake, a temporary, 16-channel, real-time data streaming array was installed in a recently constructed building in Viña del Mar to capture its responses to aftershocks. The cast-in-place, reinforced concrete building is 16 stories high, with 3 additional basement levels, and has dual system comprising multiple structural walls and perimeter frames. This building was not damaged during the main-shock, but other buildings of similar design in Viña del Mar and other parts of Chile were damaged, although none collapsed. Dynamic characteristics of the building identified from the low-amplitude (PGA of about 2 Gal) response recordings of aftershocks are found to compare well with those determined from modal analyses using a design level FEM model. Distinct “major-axes” translational and torsional fundamental frequencies, as well as frequencies of secondary modes, are identified. Evidence of beating is consistently observed in the response data for each earthquake. Results do not match well with U.S. code formulas.
Introduction
During the reconnaissance mission organized by the Earthquake Engineering Research Institute (EERI) to investigate the Mw = 8.8 Offshore Maule, Chile, earthquake of 27 February 2010, a collaborative effort by the authors facilitated deployment of a temporary, real-time data streaming structural monitoring array comprising 16 channels of accelerometers distributed throughout a 16-story building (with 3 additional basement stories) in Viña del Mar, Chile. A picture of the building is shown in Figure 1a.
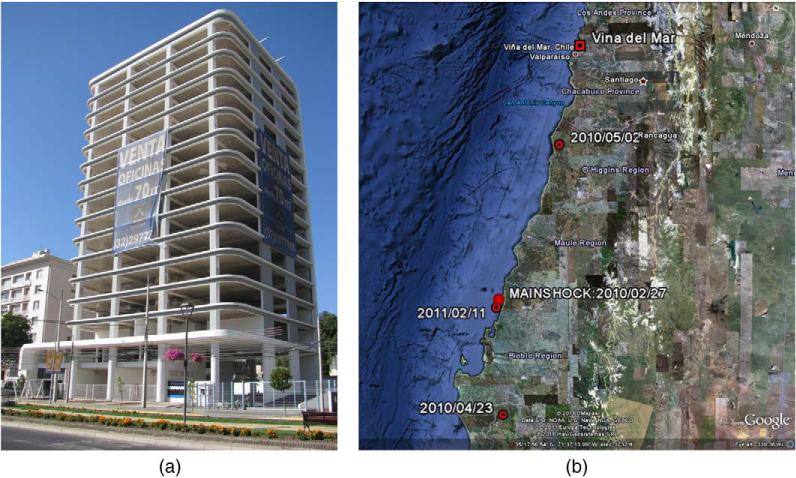
(a) Picture of the “unoccupied” building in Viña del Mar, Chile, depicts perimeter columns and shear walls. (b) Google Earth depiction of the locations of epicenters of the main-shock, the three aftershocks from which response data of the building are studied, and the cities of Viña del Mar and Santiago, the capital of Chile.
The building was chosen in order to understand the dynamic characteristics of a dual system (i.e., core structural wall and perimeter moment frame-wall) building, which is a typical construction type found in Chile. This type of construction, in general, performed well during both the M7.8 Valparaiso earthquake in 1985 and the recent Maule event. Located approximately one block away from the Viña del Mar Centro strong motion station that recorded peak acceleration of ~0.33 g (Borosheck et al. 2010, Saragoni et al. 2010) during the main shock of Maule event, the selected building was not damaged while many other tall buildings in Viña del Mar were damaged and some are slated to be razed. As of today, this station is the only strong motion station in downtown Viña del Mar and its beach areas. Therefore, rightly or wrongly, as was done following the 1985 Valparaiso earthquake, during and following the 27 February 2010 earthquake also, all references to shaking in Viña del Mar has been and are still referenced to this station1. Hence, due to many considerations, it does not necessarily imply that the building input motions had a peak acceleration of 0.33 g, but it only points to a range of peak input value. Furthermore, the effective peak acceleration (Ao) for design on the site is Ao = 0.4 (the Chilean Code amplifies this by 1.4 and then uses a reduction factor). Analysis of the building using the mainshock record is outside the scope of the paper.
1The referenced Viña del Mar Centro strong-motion station is in the basement of a seven- to eight-story building.
In the absence of widespread permanent accelerometer arrays in structures, which often is due to cost issues, as was the case in Chile, an effective approach for non-destructive testing and for extracting critical information on response characteristics is to deploy temporary arrays following large earthquakes to record significant aftershocks. This approach allows assessment of actual dynamic characteristics and significant modal behaviors that may not always be identified or accurately determined by modal analyses with mathematical models. In this case, a finite element model (FEM) of the building was available, thus providing additional incentive to identify dynamic characteristics using observed data for comparison with those computed by modal analyses. The results of such comparisons help to better understand the approach for Chile, where the code (NCh433.Of96 1996) specifically includes fundamental periods in the computations of design base shear forces, but unlike codes in the United States (UBC2007, IBC2009, and ASCE7-10) and in other countries, does not provide empirical formulas as an alternative way to compute fundamental periods, if needed. Instead, the Chilean code suggests using modal analyses to determine the fundamental frequencies. In addition, it is deemed important to understand the dynamic characteristics of such buildings for further assessment of their behavior and performances.
During the time that the array was deployed, the shaking responses of the building to numerous aftershocks were recorded and transmitted via the Internet to the authors. In this paper, only three of the numerous response data (selected on the basis of largest amplitudes of input motions in the basement of the building) are used. The particulars of the mainshock and the aftershocks referred to in this study are provided in Table 1. Figure 1b depicts the locations of the epicenters of the mainshock and selected aftershocks relative to the City of Viña del Mar and to the Capital City of Santiago.
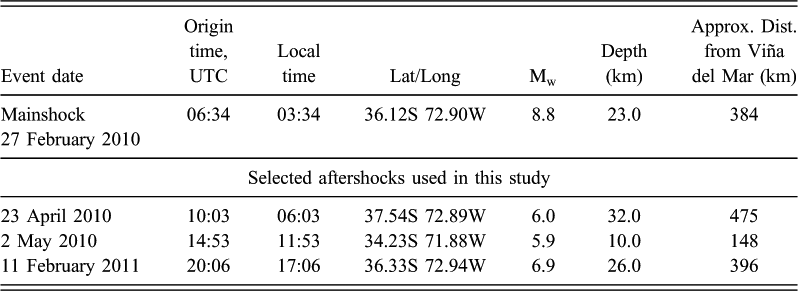
Dates, times, epicentral coordinates, magnitudes, depths, and distances from Viña del Mar, Chile (from http://www.ncedc.org/anss/catalog-search.html). Approximate distances from Viña del Mar to the epicenters were determined from Google Earth
In this paper, spectral analysis techniques (Bendat and Piersol 1980) are used to extract the significant frequencies. In addition, system identification techniques are used extensively to extract similar dynamic characteristics for comparison. These techniques are also used to show variations in fundamental frequencies over a short duration of time comparable to the data length of an event. Furthermore, we took advantage of the availability of Finite Element (FEM) model of the building developed and used during the design analysis process (Bonelli and Associates 2010) to compare modal analyses results with those identified from earthquake response data. During the months it was temporarily instrumented, the building was in a skeletal condition—no windows, no doors, and no live loads. Hence, additional modal analyses reflecting this condition were performed using the same model and are included in this study.
The Building, Model, and Site
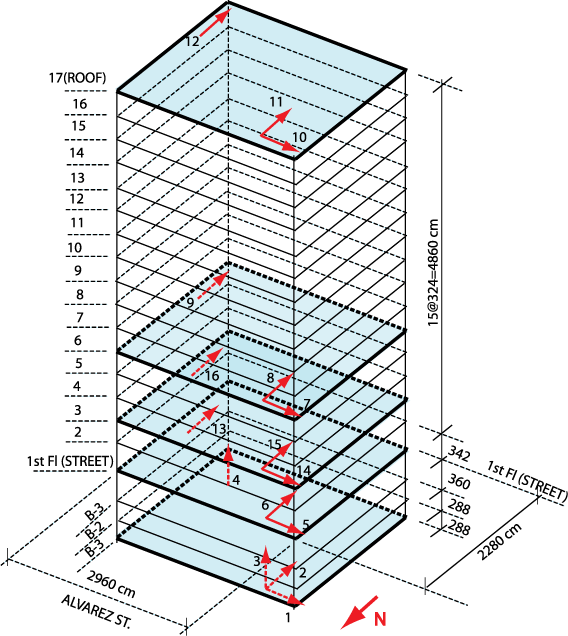
A typical plan view showing the distribution of shear walls and column lines, and a typical vertical section showing the basements and variation of story heights are shown in Figure 2. The lateral force resisting system of the building is a dual system comprising a central core consisting of two reinforced concrete (R/C) walls, each with a C section, coupled only by the slab. In the perimeter, there are special frames in one of the directions, and coupled structural walls in the other. As shown in the plan view, core shear walls are typically 35 cm and 45 cm thick, while the shear walls in the perimeter on the west and east edges are 30 cm thick, and the two in the south edge are 40 cm thick. Columns located on the column line intersections that do not have shear walls are typically 80 cm × 80 cm in plan. Pre-stressed 18 cm thick slabs are supported by 35 cm deep perimeter and internal beams. Such a distribution of walls and columns with non-coincidental mass and rigidity centers naturally is expected to cause torsional behavior. Furthermore, the basement foundation is a 100 cm thick mat without piles. The combination of lack of piles, a thick mat foundation, and a stiff structural system situated on a sub-foundation of approximately 100 m thick alluvial material make this building an ideal target to investigate possible rocking effects.
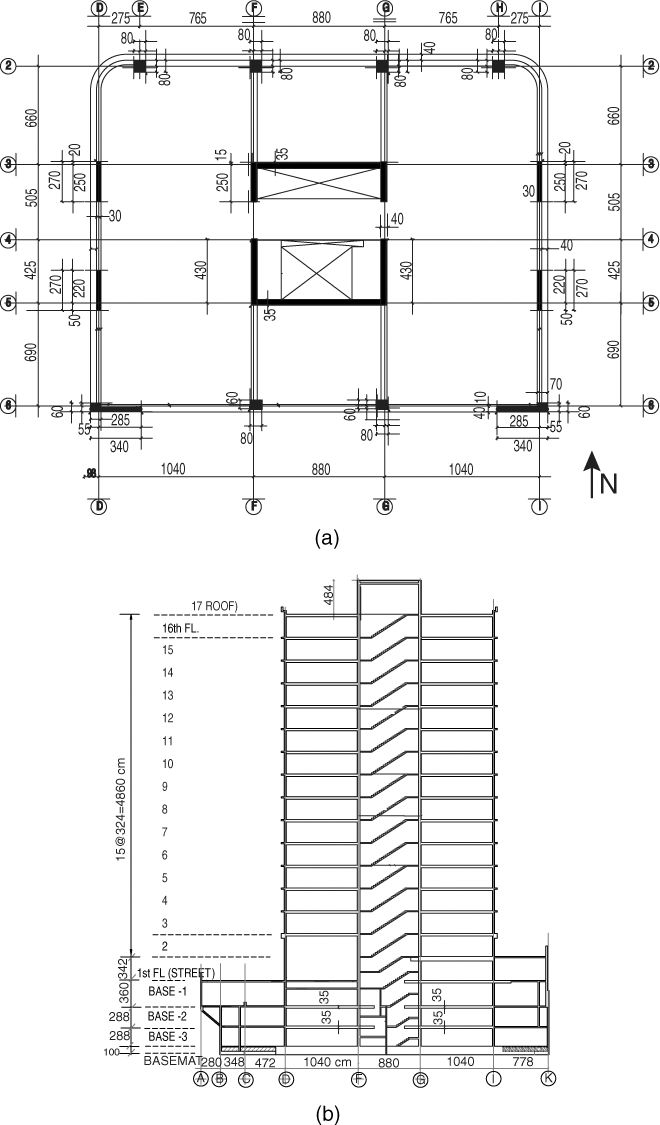
(a) Typical plan view shows distribution of shear walls and columns as well as dimensions. NS direction is indicated. (b) Typical vertical section of the building exhibits the extension of the basements below the street level (written communication, P. Bonelli and Associates, Viña del Mar, Chile, 2010).
As was followed during the design of the subject building, in Chile, typically, design considerations are as follows (a) Gross section analysis is carried out, (b) elastic modulus assessed according to ACI318, (c) Inertial live load (LL) is accepted as 25% of LL. (d) fix base foundation assumed, and (e) slabs are modeled in public domain software ETABS as rigid diaphragms. However, to reiterate, for better correct comparison with results from observed aftershock data, the analysis with no live load was carried out because building was under construction and no partitions or architectural or mechanical components were present.
Finite Element Model
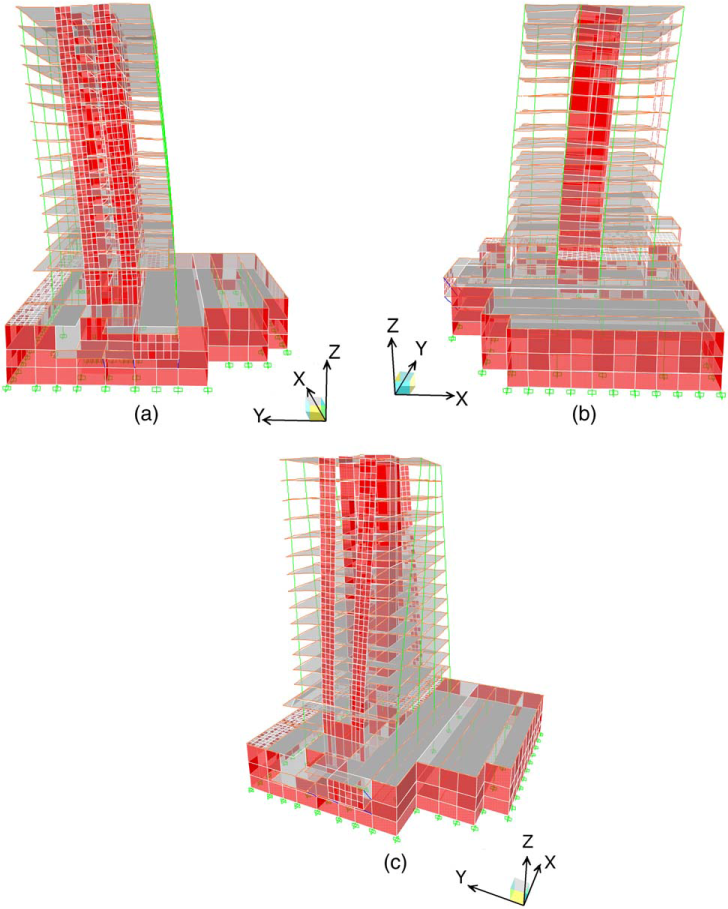
The FEM model of the building developed during the design/analysis process is shown in Figure 3. Both the page-upward direction in the plan view in Figure 2 and the Y-axis in Figure 3 are oriented to North.
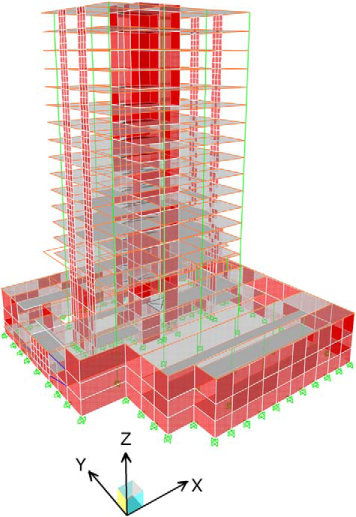
Original FEM model used during design/analysis process of the building (Bonelli 2010). Y axis is in NS direction.
During the design/analysis process, modal analysis performed with this model has yielded the first 6 modal frequencies (periods) as 0.5, 0.65, 0.88, 2.13, 3.23, and 3.70 Hz (2.01, 1.532, 1.14, 0.47, 0.31 and 0.27 seconds). The first two correspond to the fundamental modes in the NS and EW directions respectively. The third corresponds to torsional mode. These three mode shapes are shown in Figure 4. However, upfront, it is important to emphasize that the FEM model used for the modal analysis performed during design process included live loads (as part of the mass) as required by Chilean code. This distinction is critical to the description of the background and comparison with the results of the analyses from observed data from the building without live loads as presented herein. As will be noted later in Table 2, which summarizes all of the results, the FEM model was also used to perform modal analyses by removing the live loads for realistic comparison with the results obtained from recorded earthquake response data. The FEM analyses did not include soil-springs to represent the media below and surrounding the building (Bonelli 2010). An average value of elastic modulus of concrete, E = 25,742,960 kN/m2 for fc′ = 30 MPa was used in modal analyses.
Fundamental mode shapes: (a) NS translational mode, (b) EW translational mode, and (c) torsional mode (Bonelli 2010).
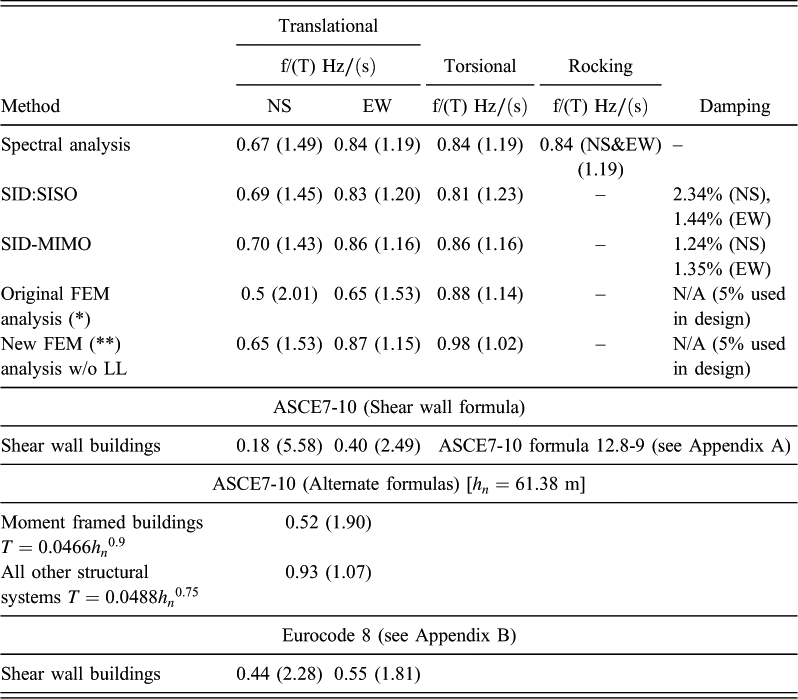
Comparison of frequencies (periods) from spectral analyses, SISO and MIMO system identification, FEM modal analyses using design level model (* indicates the original analyses included LL [Live Load], ** indicates new analysis with LL removed and ASCE7-10 formulas). Damping percentages determined by both SISO and MIMO. For SISO analyses, input-output channel pairs are: (EW) CH1 and CH10, (NS) CH2 and CH11, and (torsion) CH6-CH13 and CH11-CH12
Site Transfer Function
A profile of shear wave velocity, Vs versus depth, is available for a borehole near the strong motion station at the City Center of Viña del Mar. This station is only one block away from the building, and so the profile is assumed to be representative of that beneath the building. Figure 5 shows both the profile and transfer function computed for that profile. The depth to base rock is approximately 100–110 m below the ground surface.
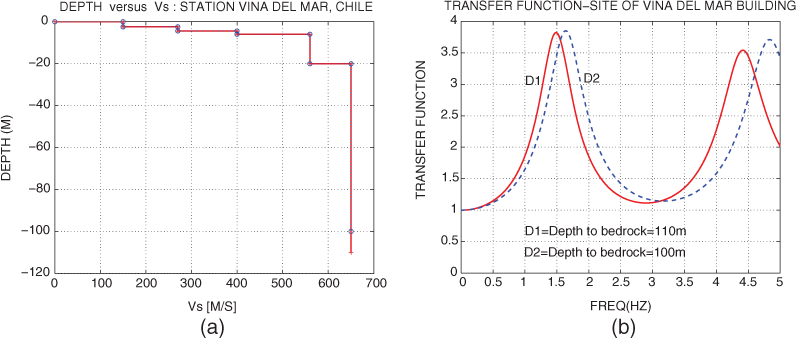
(a) Borehole site Vs versus depth profile of the Viña Del Mar City Center strong motion station that is one block away from the building. (b) Site transfer function computed for the available borehole log.
Although other methods are available, computation of site transfer functions is performed by using software developed by Mueller (1997) based on Haskell's shear wave propagation method (Haskell 1953, 1960). In this method, the transfer function is computed using linear propagation of vertically incident SH waves and has, as input, data related to the layered media (number of layers, depth of each layer, corresponding Vs, damping, and density), desired depth of computation of transfer function, computation frequency (df), half space substratum shear wave velocity and density. Damping (ξ) in the software is introduced via the quality factor (Q), a term used by geophysicists that is related to damping by ξ = 1/(2Q). Q values used in calculating the transfer functions range between 25–60 for shear wave velocities between 200–600 m/s—having been approximately interpolated to vary linearly within these bounds.
Based on the method used and the Vs-depth profile, the fundamental site frequency estimated for the site of Viña del Mar Center strong motion station (and therefore the site of the building) is ~1.5 Hz. This assessment will be useful when considering whether any site related resonance occurs during shaking of the building.
Temporary Instrumentation and Data
Figure 6 shows the array of 16 accelerometers temporarily deployed in the building. Preliminary analyses of the numerous data sets recorded by the array exhibit very similar response characteristics. Hence, in this paper, we use only the response data from the three aftershocks listed in Table 1 and plotted in Figure 1b. Detailed analysis is presented for one aftershock, while the other two sets are analyzed only to show repeatability.
Schematic of temporary deployment of accelerometers. Note: Only the tower imprint of the basements are shown in this figure. All accelerometers were deployed within the tower and its imprint in the 3rd basement.
Detailed Spectral Analyses of One Set of Response Data
Shown in the left frame of Figure 7 are acceleration time-histories of the response recorded by channels 10–12 at the roof level (ceiling of the 16th floor) of the building to the event that occurred on 23 April 2010 (Table 1). This Mw = 6.0 event was located 65 km south of Concepcion and approximately 475 km south of Viña del Mar. Response data from this event will be used to perform detailed analyses. In the center frame of Figure 7 is an expanded 100-s interval of these records to better display the building behavior, which may include beating effects and low damping that most likely contributed to prolonged shaking. The prolonged response of the building to this and other aftershocks is further emphasized when it is now known that the length of the Maule event mainshock Viña del Mar Centro station record (as exhibited in the report by Boroschek et al. 2010) is ~120 s with a strong shaking duration of ~40–50 s. The beating effect is discussed later in the paper. In the right frame of Figure 7, acceleration time histories of the horizontal components in the basement (CH1, EW, and CH2,NS) are presented.
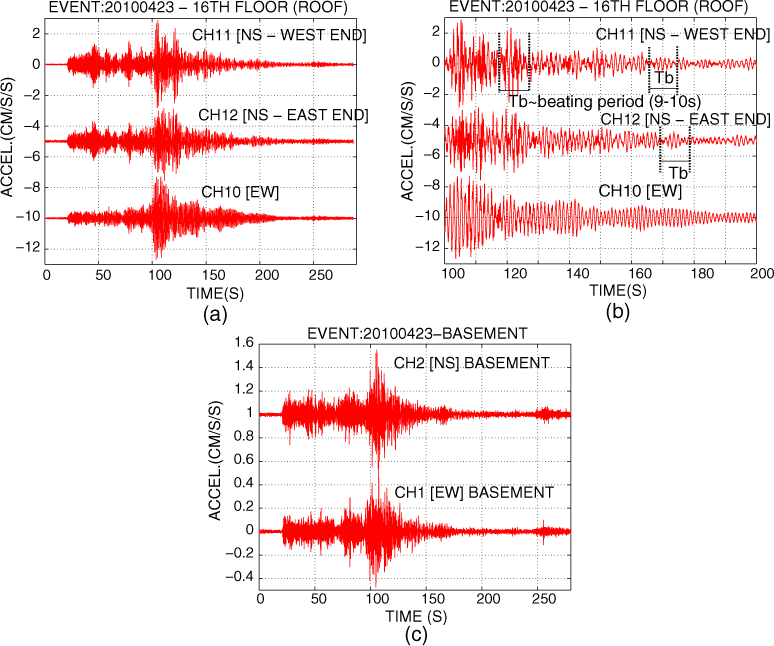
Acceleration time histories recorded at the roof level of the building. (a) The complete record. (b) Expanded portion of record, windowed between 100–200 s, to display possible beating and low-damping associated with the building at this level of shaking. (c) Horizontal components of accelerations recorded at the basement. Note the higher relative amplitudes at the roof versus those at the basement.
Amplitude spectra computed from the acceleration records from all channels are shown in Figure 8. The spectra show predominant peaks at several frequencies in the NS, EW, and vertical directions. In the low-frequency range of about 1 Hz or less (the expected range of the fundamental frequencies), several peaks are clearly identifiable (e.g., EW frequency of 0.84 Hz and NS frequencies 0.67, 0.84, and 1.05 Hz). These significant frequencies and those of higher modes are seen in the transfer functions in the left frame of Figure 9 as well. In the EW direction, the transfer function, computed as the ratio of amplitude spectra of accelerations at the roof (CH10) to those in the basement (CH1), clearly indicates three distinct peaks at 0.84, 3.3, and 6.7 Hz, which correspond to the first three modes. It is noted that these frequencies are identical to those obtained from amplitude spectrum for torsional response represented by the difference of the two parallel NS motions (e.g., CH11 and CH12) as shown in the right frame in Figure 9. Thus, in the EW direction, translational and torsional motions are coupled. Naturally, in the NS direction, similar torsional frequency (0.84 Hz) is identified (as seen in both frames of Figure 9 as well). The NS transfer functions also exhibit two additional peaks at 0.67 and 1.05 Hz that do not appear in the spectra or transfer function for the EW direction; hence, they are related only to the NS direction.
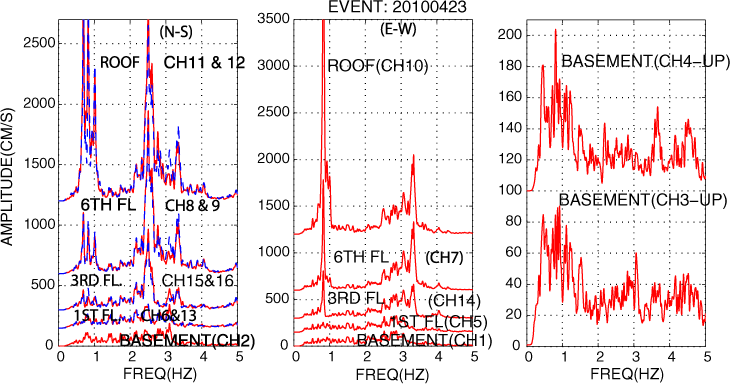
Amplitude spectra computed from accelerations recorded from all channels of the array.
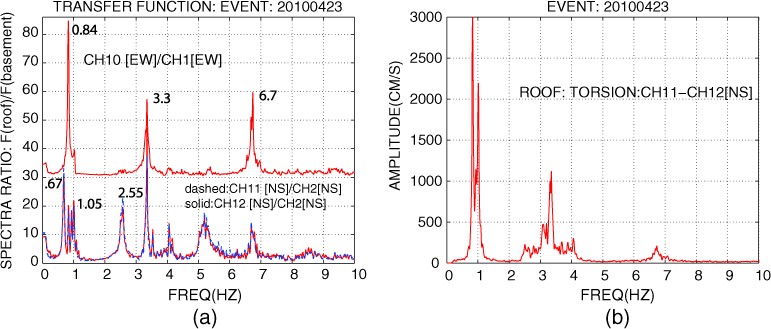
(a) Transfer function of EW and NS records at the roof with respect to corresponding records in the basement. (b) Amplitude spectra of differential acceleration from parallel channels in the NS direction to assess torsional response. Note the linear scaling of the horizontal axes, which is used instead of logarithmic scaling to better resolve higher mode frequencies in the 0–10 Hz range.
Figure 10 displays cross-spectrum, phase and coherency between CH12 (NS) at the roof and CH9 (NS) at the sixth floor. The three frequencies (0.67, 0.84, and 1.05 Hz) in the NS direction are all coherent and in phase. From this, it is difficult to identify the mode that corresponds to each of the three frequencies. However, it is very likely that the frequency at 0.84 Hz is also the rocking frequency for the NS direction, as identified by the auto-spectra, cross-spectrum, phase angle, and coherency plots in the left frame of Figure 11 for the roof CH12 (NS), as compared to CH4 (UP) in the basement. This key figure illuminates for the NS direction the closely spaced frequency peaks that are about 1 Hz or less. The right frame in Figure 11 shows the auto-spectra, cross-spectrum, phase angle and coherency plots for the roof CH10 (EW) as compared to CH4 (UP) in the basement. They appear in phase at 0.84 Hz because this frequency is the same frequency as the coupled translational-torsional EW frequency and also the rocking frequency in the NS direction (and therefore appears in the vertical motions of the basement). While other examples may exist, recently, rocking was also observed in the low amplitude ambient shaking data from a recently instrumented building in Boston, MA (Çelebi et al. 2011).
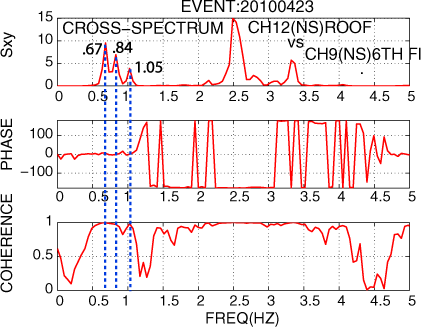
Cross-spectrum, phase angle and coherency plots of acceleration recorded by CH12 (NS) at the roof and CH9 (NS) recorded at the sixth floor.
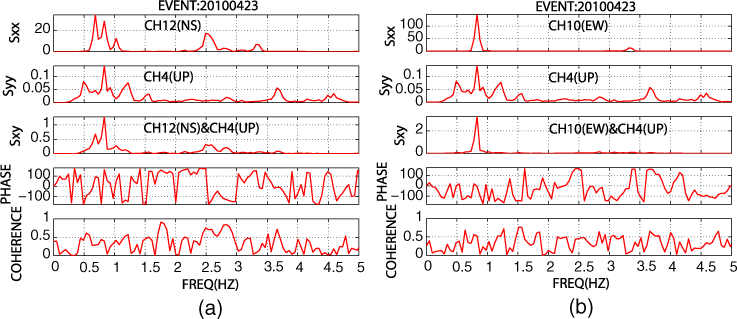
Auto (Sxx, Syy) and cross (Sxy) spectra, phase angle, and coherency plots for vertical motion (CH4) in the basement paired with horizontal motions: (a) CH12 (NS) at the roof and (b) CH10 (EW) at the roof.
In order to further explain such close frequencies in the NS direction, the relationship for “apparent frequency” is used. Originally, in the classical textbook by Jacobsen and Ayre (1958) and later in studies by Trifunac et al. (2001a and b), to differentiate frequencies that are lower than fixed-based lateral structural frequencies (ff) due to contributions of (fr for rigid-body rocking and fh for horizontal translational) soil-structure interaction (SSI), the relationship for “apparent frequency (fa)” was formulated as:


Beating, which is clearly visible in the roof accelerations shown in the center frame of Figure 7, is another important response characteristic of this building. As observed in other structures (Boroschek and Mahin 1991, Çelebi 2004), low damping and nearly identical translational and torsional frequencies in structural system causes coupling and beating with a period:

System Identification (Sid) - Single-Input Single Output (Siso)
System identification analysis was performed using the aftershock data to identify and/or validate key frequencies and compare them with those determined by spectral analyses. A model is estimated using appropriate pairs of recorded acceleration responses as single-input, single-output (SISO). The auto-regressive extra input (ARX) model based on least squares method is used in this analysis. The reader is referred to Ljung (1987) and Matlab User's Guide (1988 and newer versions) for detailed formulations of the ARX and other system identification models. In this paper, for SISO analyses, input-output pairs are: (EW) CH1 and CH10, (NS) CH2 and CH11, and (torsion) CH6-CH13 and CH11-CH12. Key frequencies for four of the important modes identified by spectral methods and by SISO system identification method compare well (are within a few percent). These values, along with modal damping ratios derived from the SISO analysis, are summarized later in Table 2.
System Identification (Sid) - Multiple-Input Multiple Output (Mimo)
Modal parameters during the same seismic event were also identified using a combination of the parametric Multiple-Input Multiple-Output (MIMO) identification algorithms developed by Beck (1976), Mau and Li (1991), and a recent version by Carreño and Boroschek (2010). Channels 1 to 4 at the base of the building and channels 7 to 12 located on the two highest instrumented floors (Figure 6) were used as input and output respectively. Before using the identification algorithm, all output records were converted from original absolute accelerations to relative accelerations by subtracting the horizontal records at the base and the estimated output response due to base rocking.
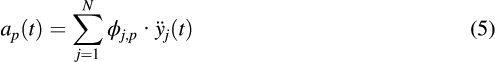
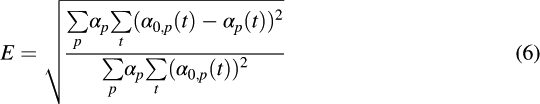
First, the entire seismic record is used to identify an average value for each modal parameter. For comparison, these are included in the summary Table 2 later in the paper. Although not summarized or plotted, two points of mode shapes are computed using basement as “zero” and two points defined by the channels in a vertical line-up of the accelerometers and orientations as depicted in Figure 6 (e.g., CH7 and CH10 in EW direction, CH8 and CH11 in NS direction and CH9 and CH12 in NS direction again). Figure 12 compares the relative acceleration time-series obtained from the records for channels 10 to 12 (16th floor) with the response estimated by the MIMO algorithm for the same locations. Each frame in Figure 12 also indicates the goodness of fit error for the estimated modal parameters, namely the target function of the optimization process in the MIMO algorithm, as a weighted least-square-error function, (6), between the recorded accelerations and the corresponding response estimations for all instrumented points.

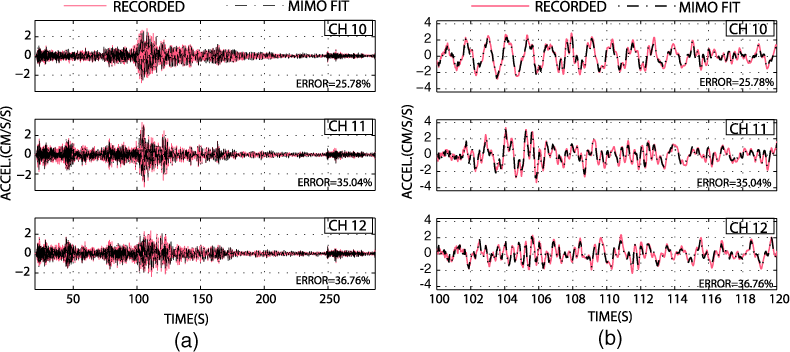
(a) Measured relative acceleration time-series vs. MIMO fit for channels 10 to 12. (b) Expanded view (100–200 s) of measured relative acceleration time-series vs. MIMO fit for channels 10 to 12.
Second, the seismic record was divided into successive 5-s intervals (periodograms) with a 2.5 s overlap. From each periodogram, one modal parameter is identified so that temporal variations of such parameters due to nonlinear behavior can be investigated. However, in a more practical way, this is accomplished by adopting an equivalent linear model for each window. In Figure 13, variations of the first two principal modal frequencies during the seismic event illustrate the elastic nonlinear behavior of the building. Modal frequencies decrease during the strong shaking stage and then, by the end of the event, return to near their original values. This type of observation may be significant in some cases. For example, if, following strong shaking, there are permanent shifts in key frequencies, it may prompt further investigations for damage assessment (e.g., intrusive inspections and other methods).

Variation of frequencies for Modes 1 and 2 over the duration of the record.
Repeatability
In order to test whether these results are repeatable, we analyzed the data for the two additional aftershocks listed in Table 1 (2 May 2010 and 11 February 2011). For sake of brevity, only selected figures are shown for comparison. Figure 14 shows, for the 2 May 2010 event, the acceleration time histories at the roof and the spectral ratios of the roof accelerations with respect to the basement. Figure 15 shows the same for the 11 February 2011 event. These results show that the frequencies of major spectral peaks are repeatable to within about 2%, although the relative amplitudes may vary considerably more.
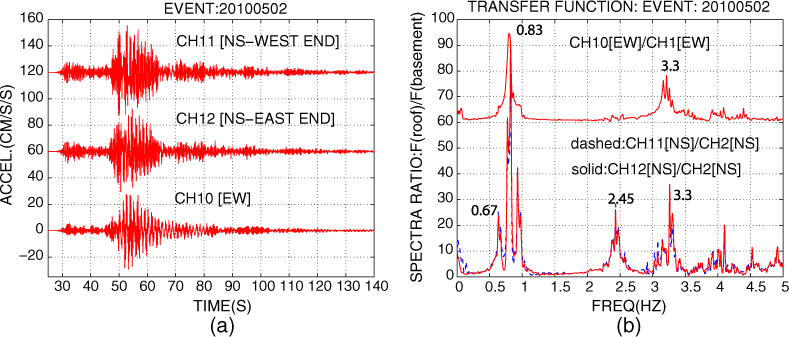
(a) Acceleration time histories recorded at the roof level of the building during the 2 May 2010 event. (b) Transfer functions of EW and NS motions at the roof with respect to corresponding records in the basement. The transfer functions are plotted for 0–5 Hz horizontal axes.
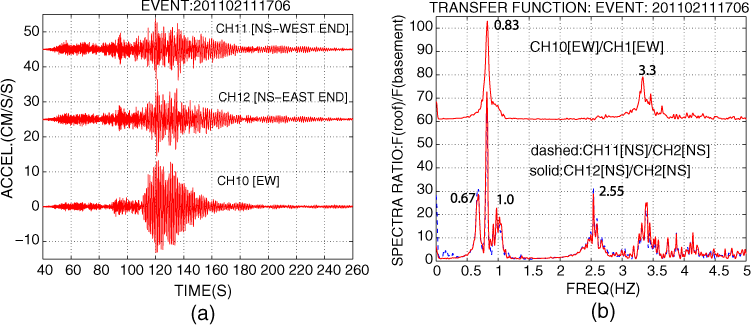
(a) Acceleration time histories recorded at the roof level of the building during the 11 February 2011 event. (b) Transfer functions of EW and NS motions at the roof with respect to corresponding records in the basement. The transfer functions are plotted for 0–5 Hz horizontal axes.
Comparison with Code Formulas and Discussion
In Table 2, the periods (or frequencies) and applicable critical damping percentages determined by different methods (spectral, SISO, and MIMO system identification techniques) using recorded response data from the 23 April 2010 event are summarized and compared with those obtained by modal analysis using the modified FEM model without live loads. Results compare well with each other as they all are representative of the realistic condition of the building without live loads. Furthermore, as presented, results from response data from the 23 April 2010 (analyses with which are presented in detail) and the other two events (with limited analyses presented) are also comparable.
That stated, and aware of the effect of absence of live loads, the fundamental periods identified from analyses of recorded data provides an opportunity to compare them with available empirical code formulas in the U.S and Europe. Such comparisons help to assess the applicability of available empirical code formulas to estimate fundamental periods of such structural systems. As stated earlier, Chilean code NCh433 (1996) does not have approximate empirical formulas to estimate fundamental periods of buildings and therefore recommends modal analyses. Such empirical formulas obtained from data from buildings (that had live loads) are permitted in U.S. and European codes and standards for most building systems primarily as a starting point during design process. However, no such direct formulas are provided or used for dual systems similar to that studied in this paper. With this in mind, we discuss the possibilities in using formulas. First, in the most recent standard in the United States, ASCE7-10 recommends:

For moment-resisting frames, x = 0.9 and C
t
is 0.016 when hn is in feet or 0.0466 when in meters. For shear wall structures, use of approximate formula 12.8-9 in ASCE7-10 is permitted:

To use Formula 7 for all other structural systems, x = 0.75 and Ct is 0.02 when hn is in feet or 0.0488 when in meters. Thus, using Equation 7, it is only possible to bracket the fundamental period of the subject building identified both by recorded response data and by FEM modal analyses. Since the height of the building is 61.38 meters from the basement to roof level, considering the building as moment resisting frame, T = 0.0466hn0.9 for concrete moment resisting frames, which yields T = 1.90 s (0.52 Hz) for the subject building. Considering the building as one belonging to “all other structural system” category, T = 0.0488(61.38)0.75 = 1.07 s, or a frequency of 0.93 Hz.
In addition, computation of the fundamental periods of the structure as a shear wall system is also possible and is performed in online Appendix A using Equation 8 and applying actual parameters obtained from Figure 2. This formula yields unrealistic fundamental periods T = 5.58 s (or f = 0.18 Hz) and 2.49 s (or f = 0.40 Hz) for NS and EW directions respectively and hence does not also apply to this dual-system. One possible explanation is that in the NS direction the shear walls are closer to center whereas in the EW direction, they are wider apart (at the column line 6, Figure 2) which very likely affect the modal behavior of the building by increasing the bending stiffness in that direction. Furthermore, the percentage of shear walls to the gross floor area is approximately ~1.3% in both directions. This percentage is considerably higher than most buildings in the US and contributes to the stiffness of the building. The formulas do not distinguish such stiffness distributions that may affect modal behavior.
Eurocode 8 (2003) also provides an alternative formula for estimating the fundamental period of a shear wall building that is less than 40.0 m high. Accordingly, similarly as in ASCE7-10, the fundamental period can be estimated by

For structures with concrete or masonry shear walls the value Ct in expression (9) may be taken as being


Applying these formulas to the subject building, as detailed in online Appendix B, better comparison of fundamental period of the building with original FEM results are achieved.
Considering that the empirical code formulas are based on data compiled from building responses including actual live loads, the fundamental period computed from code formula would have produced even lower periods (higher frequencies) if the code formula was based on data without live loads—admittedly, it is unrealistic to gather such data. Note that in a detailed study of the formulas for fundamental periods for concrete shear wall buildings, Goel and Chopra (1998) include no specific discussion related to dual systems that is characteristic of the building herein. Since such systems are being designed more and more, perhaps it is necessary to collect data and address the issue. As noted in Table 2, FEM analysis with live loads results do not match well with the code formulas either.
Another possible explanation for the difference between the empirical and observed fundamental frequencies is that the ASCE7-10 formula is a function of only the height of the building, and therefore does not take into account either the different stiffnesses of the NS and EW directions the building suggested in the typical plan view (Figure 2) and observed in spectral analyses, nor the shortening in the fundamental frequency by possible rocking, as identified by spectral analyses.
It is interesting, and perhaps important, to note that in Chile, where the practice of using extensive shear walls is common, a general relationship used to estimate the fundamental frequency of a building is 14/N–20/N, where N is the number of stories; in contrast, in areas where buildings with moment resistant frames are more common, the relationship is 10/N. One possible reason for this difference is that the dual lateral force resisting system, as opposed to an all–shear wall system, which would possibly make it stiffer, results in shorter periods.
Conclusions
Fundamental periods are an integral part of seismic design processes in Chile, United States, and other countries. The Chilean Code for Earthquake Resistant Design of Buildings (NCh433.Of96 1996) does not provide any specific formula for estimating modal fundamental periods of buildings, but instead recommends using modal analyses or other validated procedures to estimate the fundamental period. Thus, it is important that modal analyses provide results that are as accurate as possible. This study, in general, validates the use of FEM methods for determining fundamental periods of buildings with a design similar to that considered here by demonstrating good correspondence to dynamic characteristics determined from low-amplitude response data. In addition, the results reaffirm that, in absence of widespread permanent accelerometer arrays in structures with representative structural systems as is the case in Chile, the utility of rapidly deploying temporary arrays in buildings and other structures to capture low-amplitude responses during periods of elevated seismicity, such as during aftershock sequences, is an effective, non-destructive approach for extracting critical information on dynamic characteristics This approach allows assessment of actual dynamic characteristics and significant modal behaviors that may not always be identified or accurately determined by mathematical models.
In this study, the building response exhibits frequencies attributable to translational, torsional, and rocking modes that are similar to those extracted from mathematical models. It can be concluded that FEM models did provide accurate modal dynamic characteristics that here are confirmed by recorded response data.
There are no empirical fundamental period formulas in ASCE7-10 Standard (2010) for dual system buildings similar to the one studied in this paper. Furthermore, the available formulas are derived from empirical data acquired from buildings with live loads. Therefore, although a direct comparison is not possible, comparison of the fundamental period from original FEM analysis that included live loads indicates that the empirical U.S. ASCE7-10 Standard (2010) formulas are not good estimators for such a dual system. On the other hand, Eurocode 8 formula proves to be a better estimator of the fundamental period of the building.
To the best knowledge of the authors, there are no published formulas to estimate fundamental periods of buildings with dual lateral force resisting systems comprising structural walls and moment frames. Clearly, the analyses using earthquake response data and the modal analyses using the FEM model presented in this paper point out that, in future, realistic incorporation of dual lateral force resisting systems must be considered when developing empirical formulas to estimate their fundamental frequencies. Better yet, perhaps a solution is to use only modal analyses with FEM models similarly to that recommended by Chilean Code.
Rocking and beating effects are observed in the low-amplitude recorded responses of the building. Rocking alters the fundamental frequency of the building at the low-amplitude shaking reported in this paper. Beating effect is attributed to both close translational and torsional frequencies and also due to low critical damping percentages as identified by system identification and summarized in Table 2.
Note that modal frequencies identified from recorded responses change during shaking levels higher than those reported in this study. To the extent that trends observed in past studies (e.g., Çelebi 2007, 2008) are examples, the periods further increase during stronger shaking.
It is expected that it will be possible to revisit this building after it is occupied with live loads to collect appropriate response data for further comparison of frequencies from modal analyses with live loads.
Appendices a and B
Please refer to the electronic supplements in the online version of this paper.
References
Supplementary Material
Please find the following supplemental material available below.
For Open Access articles published under a Creative Commons License, all supplemental material carries the same license as the article it is associated with.
For non-Open Access articles published, all supplemental material carries a non-exclusive license, and permission requests for re-use of supplemental material or any part of supplemental material shall be sent directly to the copyright owner as specified in the copyright notice associated with the article.