





Abstract
This study develops a probabilistic tsunami loss estimation methodology for enhancing community resilience against tsunami disasters. The method is based on novel stochastic earthquake source modeling and state-of-the-art tsunami fragility modeling. It facilitates the quantitative evaluation of tsunami loss for coastal community by accounting for uncertainties of earthquake occurrence and rupture characteristics. A case study is set up to illustrate an application of the developed method to the Sendai Plain area by focusing on possible tsunami events in the Tohoku region of Japan. The quantitative tsunami hazard as well as risk assessment results serve as effective means to make decisions regarding tsunami disaster risk reduction.
Introduction
A comprehensive risk assessment framework for catastrophic events is a pre-requisite for achieving effective disaster risk reduction and building resilient community against mega-thrust subduction earthquakes (UNISDR 2015). The complex, large-scale nature of cascading risks (e.g., a sequence of main shock shaking, tsunami, geo-hazard, and numerous aftershocks) causes a great number of fatalities and destroys existing infrastructure, resulting in huge economic loss (Kajitani et al. 2013). To mitigate ground shaking and tsunami risks for coastal community, reliable tools for simulating strong motion and tsunami are needed. To evaluate the impact due to major earthquakes quantitatively, a performance-based earthquake engineering (PBEE) framework was developed by Cornell and Krawinkler (2000), and has been implemented in various studies (e.g., Porter et al. 2006, Goulet et al. 2007). The key ideas for adopting PBEE are to quantify uncertainties associated with individual model components (e.g., hazard, exposure, vulnerability, and loss) and to obtain risk outputs with meaningful estimates of their uncertainties. The framework is particularly useful for defining the long-term objectives in reducing consequences of future natural disasters and for promoting risk-based management decisions (Liel and Deierlein 2013, Yoshikawa and Goda 2014).
As exemplified by recent devastating events in Indonesia, Chile, and Japan, global tsunami exposure is not negligible and coastal communities are vulnerable to infrequent, catastrophic tsunamis (Løvholt et al. 2014). To improve the tsunami preparedness for these locations, integrated tsunami risk mitigation strategies are necessary by combining physical protection measures and emergency response/evacuation measures (FEMA 2008), both of which should be informed by accurate tsunami hazard and risk assessments.
Recent investigations of tsunami impact assessment incorporate the uncertainty associated with earthquake source characteristics (e.g., occurrence, location, magnitude, and fault geometry) through probabilistic tsunami hazard analysis (PTHA; e.g., Geist and Parsons 2006, Burbidge et al. 2008, Horspool et al. 2014). PTHA enables us to identify tsunami source regions and corresponding scenarios that have major impact to a site or region of interest. Moreover, PTHA can be used as the basis of engineering design of coastal structures (e.g., Chock 2016). On the other hand, several stochastic random-field methods have been developed and applied to probabilistic tsunami hazard and risk assessments (Goda et al. 2014, Fukutani et al. 2015, Mueller et al. 2015, Goda and Song 2016). In these methods, slip heterogeneity over the earthquake rupture plane is characterized by wavenumber spectra or some probability density functions, and numerous stochastic source models are generated to assess the variability of the tsunami hazard and risk parameters through Monte Carlo tsunami simulations. Using such stochastic scenario approaches, a set of tsunami inundation hazard maps for coastal cities and towns, corresponding to different tsunami behavior and consequences, can be obtained, which is particularly useful for planning tsunami evacuation and long-term adaptation. At present, integration of PTHA and stochastic scenario approaches has been considered by De Risi and Goda (2016) only, whereas extension of stochastic-scenario-based PTHA to tsunami risk assessment has not been implemented. Such an integrated/extended risk assessment framework can form the fundamental computational framework for performance-based tsunami engineering (PBTE). The above-mentioned method is in sharp contrast with the state-of-the-practice worst credible scenario approach for tsunami hazard mapping (e.g., Cheung et al. 2011) with regard to uncertainty modeling and quantification.
This study presents a novel stochastic-scenario-based tsunami hazard and risk assessment methodology for PBTE. The concept of PBTE is not entirely new (Attary et al. 2017); however, it has not been fully developed nor rigorously implemented in tsunami engineering. Given the similarity and commonality of earthquake and tsunami hazards (i.e., low-probability high-consequence geological events), it is straightforward to apply the PBEE-based mathematical formulation to the tsunami impact assessment (Goda and Song 2016). Indeed, modern PTHA (e.g., Geist and Parsons 2006, Burbidge et al. 2008, Horspool et al. 2014, De Risi and Goda 2016) adopts essentially an identical formulation as probabilistic seismic hazard analysis (PSHA), and such hazard assessment can be extended to probabilistic tsunami risk analysis by incorporating tsunami vulnerability assessment (Wiebe and Cox 2014). One notable difference between earthquake and tsunami hazard-risk analyses is that typically tsunami simulation is performed by solving the governing equations of wave propagation for given initial conditions of sea surface, unlike the use of statistical ground motion prediction models in seismic hazard-risk analysis. The wave simulation requires more detailed information of earthquake rupture processes, such as heterogeneous earthquake slip and scaling of earthquake characteristics as a function of moment magnitude M. Therefore, more accurate estimates of tsunami hazard parameters can be obtained at multiple sites of interest, reducing the uncertainty in hazard components. This also facilitates the realistic and accurate estimation of spatially distributed tsunami hazard parameters (e.g., inundation depth) at building locations, which is different from the seismic hazard counterpart (i.e., spatial correlation models of the ground motion prediction equations are necessary to account for realistic spatial distribution of seismic hazard parameters; see Yoshikawa and Goda 2014). On the other hand, current tsunami vulnerability assessment is largely empirical (Tarbotton et al. 2015, Macabuag et al. 2016), resulting in difficulties when the PBTE framework is applied to geographical regions where empirical tsunami damage data (and thus relevant tsunami fragility models) are lacking. This limitation can be overcome by developing analytical tsunami fragility models (Park et al. 2012, Attary et al. 2016, Petrone et al. 2017), similarly to the seismic vulnerability counterpart. Importantly, one of the goals of this work is to bring both PBEE and PBTE on the coherent computational framework (De Risi and Goda 2016). This will eventually facilitate the development of a performance-based engineering framework for cascading earthquake-tsunami multi-hazards.
To demonstrate the tsunami loss estimation methodology, a case study, focusing upon the Tohoku region of Japan, is presented. The tsunami sources in the off-shore Tohoku region, which correspond to a wide range of earthquake magnitudes from M7.5 to M9.1, are considered. Note that the set-up of the case study considers near-field sources only and ignores far-field sources; the latter sources may have large influence on the tsunami loss estimation. The uncertainties of the source geometry and rupture characteristics are fully taken into account by using new probabilistic scaling relationships of earthquake source parameters and stochastic synthesis of heterogeneous earthquake slip (Goda et al. 2014, 2016). These uncertainties are propagated through tsunami wave modeling and fragility assessment via Monte Caro simulations. As outputs of the numerical example, single-location as well as spatially-aggregated parameters for multiple locations are considered for tsunami hazard assessment, while tsunami loss to a building portfolio in Natori and Iwanuma Cities is evaluated. Moreover, critical hazard scenarios corresponding to the selected percentiles of the tsunami risk curves (e.g., 1 in 1,000 years tsunami loss event) are derived to demonstrate how additional results can be obtained from the developed stochastic-scenario-based PBTE method.
Probabilistic Tsunami Loss Estimation Framework
Formulation
A generic equation for probabilistic tsunami risk assessment can be expressed as

Moreover, key model components in Equation 1 are defined as follow:
λ
Mmin
is the annual occurrence rate of tsunamigenic earthquakes having magnitudes greater than or equal to Mmin, while f
f f f P(
Although all variables in Equation 1, i.e.,
In evaluating Equation 1, it is important to choose an efficient
Figure 1 shows the computational procedure for carrying out probabilistic tsunami risk assessment based on stochastic earthquake scenarios. The Monte Carlo simulations are employed to evaluate the tsunami risk equation shown in Equation 1. It is noteworthy that the computational framework shown in Equation 1 and Figure 1 are versatile and therefore, the model components described below can be changed and refined, depending on the specific requirements and constraints of the tsunami impact assessment. More details of the model components for the earthquake occurrence, stochastic earthquake source, tsunami inundation, and tsunami damage-loss, as implemented in this study, are given in the following subsections. The models discussed are developed for the Sendai Plain area in the Tohoku region of Japan, and have been compared with various observations from the 2011 Tohoku tsunami. For instance, sensitivity of offshore and onshore tsunami waves to earthquake ruptures has been investigated by Goda et al. (2014, 2015); their results indicate that stochastic tsunami simulations encompass the observed tsunami inundation and damage during the 2011 Tohoku event. Furthermore, tsunami fragility models that are used in this study have been developed by De Risi et al. (2017) based on extensive tsunami damage data compiled by the MLIT (2014), whereas assumed building exposure models are consistent with actual building stock and cost information in the Tohoku region. Based on these, developed tsunami risk models are considered to produce realistic results with respect to the 2011 Tohoku tsunami damage and loss.
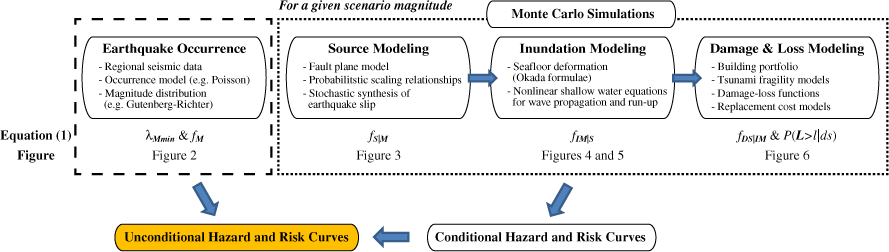
Probabilistic tsunami risk assessment procedure.
Earthquake Occurrence Model
The model components of the earthquake occurrence (i.e., λ
Mmin
and f

(a) Regional seismicity in the Tohoku region based on the NEIC catalog, (b) Gutenberg-Richter models for the off-shore Tohoku region based on the Harvard-CMT (HCMT) and the NEIC catalogs, and (c) conditional distribution of earthquake magnitude for the off-shore Tohoku region.
The regional seismicity is characterized based on the GR relationship by analyzing seismic data obtained from the Harvard CMT catalog (http://www.globalcmt.org/CMTsearch.html) and the NEIC catalog (http://seisan.ird.nc/USGS/mirror/neic.usgs.gov/neis/epic/code_catalog.html). Figure 2a shows the seismicity data in the offshore Tohoku region from the NEIC catalog. The magnitude-recurrence plots of the earthquake data from the two catalogs are shown in Figure 2b; the GR relationship is fitted to the data by considering the magnitude cut-off of 6. The fitted GR models indicate that the annual rate of earthquakes with M ≥ 7.5 can be estimated to be 0.08 per year (i.e., λ
Mmin
). Note that the fitted GR models shown in Figure 2b are similar to the magnitude-recurrence model adopted by the HERP (2013). Subsequently, the conditional probability distribution function is derived by discretizing the magnitude range that is relevant for tsunami generation triggered by off-shore earthquakes (M7.5 to M9.1) into eight bins with 0.2 interval. This is shown in Figure 2c (i.e., discrete version of f
Earthquake Source Model
The next step of the tsunami hazard-risk assessment is to generate numerous earthquake source models stochastically (i.e., f
Firstly, the fault model is developed by referring to the rupture plane geometry, such as the top-fault depth, strike, and dip, considered by Satake et al. (2013). The fault model, i.e., extended version of the Satake et al. fault plane model, covers a 650 km by 250 km area and has a constant strike of 193° along the Japan Trench and variable dip angles, gradually steepening from 8° to 16° along the down-dip direction. The surface projection of the fault plane model is shown as a grey rectangle in Figure 2a. The adopted fault model essentially reflects the current seismological knowledge of earthquake rupture in the target region. To characterize heterogeneous earthquake slip over the fault plane (see below), the source region is discretized into sub-faults having a size of 10 km by 10 km.
Secondly, earthquake source parameters, such as fault width (W), fault length (L), mean slip (D a ), maximum slip (D m ), power transformation parameter for marginal slip distribution (λ), correlation length along dip (A d ), correlation length along strike (A s ), and Hurst number (H), are generated using probabilistic prediction models of these parameters developed by Goda et al. (2016) based on 226 finite-fault models of the past earthquakes. W and L determine the size of the fault rupture as a function of earthquake magnitude. D a and D m specify the earthquake slip statistics over the fault plane, whilst λ determines how the slip values are marginally distributed over the fault plane. For example, different values of λ correspond to the normal distribution (λ = 1, symmetrical bell-shape) and the lognormal distribution (λ = 0, positively skewed shape). Typically, values of λ fall between 0 and 1 (see Goda et al. 2016 for more details). A d , A s , and H are used to characterize the spatial distribution of earthquake slip and are the model parameters for von Kármán wavenumber spectra (Mai and Beroza 2002, Goda et al. 2014). Essentially, the wavenumber spectra specify how slip values are spatially correlated over the fault plane. In evaluating uncertainties (i.e., errors of the prediction equations), correlation of the error terms among different source parameters is taken into account to generate more realistic stochastic earthquake source models. In the simulation, random numbers for the error terms are sampled from the multivariate lognormal distribution.
Thirdly, using the simulated spatial slip distribution parameters (i.e., A d , A s , and H), a random slip field is generated using a Fourier integral method (Pardo-Iguzquiza and Chica-Olmo 1993). To achieve slip distribution with realistic positive skewness, the synthesized slip distribution is converted via Box-Cox power transformation using the simulated value of λ. The transformed slip distribution is then adjusted to achieve the target mean slip D a and to avoid very large slip values exceeding the target maximum slip D m . Subsequently, the position of the synthesized fault plane is determined randomly within the source region. Due to the uncertainty in the source parameters, random sampling of W, L, and D a may result in a seismic moment Mo (=μWLD a where μ is the rock rigidity) that is very different from the target moment magnitude (as specified by the scenario magnitude). To avoid such an inadequate combination of W, L, and D a , sampling of these three parameters is repeated until the calculated seismic moment falls within a certain range. In this study, the target moment magnitudes minus/plus 0.1 units are considered for such a range (to be consistent with the bin size of the discretized magnitude distribution, shown in Figure 2c). Further details of the stochastic synthesis can be found in Goda et al. (2014, 2016).
In this study, to capture the uncertain earthquake sources for a given scenario magnitude, 500 stochastic models are generated, and the same procedure is followed for eight magnitude ranges (in total 4,000 source models). The synthesized earthquake source models, which reflect possible variability of tsunami-triggering seismic events in terms of geometry, fault location, and slip distribution, are then used in Monte Carlo tsunami simulations. It is noteworthy that the number of simulated source models (i.e., 500 models) is sufficiently large to obtain stable tsunami hazard results at the sites of interest (see De Risi and Goda [2016]).
To illustrate the stochastic modeling of earthquake sources, simulated values of the fault length and mean slip of the 4,000 stochastic source models are compared in Figures 3a and 3b, respectively, with the corresponding scaling relationships for the fault length and mean slip by Goda et al. (2016). For the fault length (Figure 3a), it can be observed that the upper limit of 650 km (i.e., maximum length of the target source region) is reached for the M9.0 scenario. Due to the trade-off between the fault length and the mean slip in conserving the total seismic moment, simulated values of the mean slip tend to increase for the M9.0 scenario (see Figure 3b). Similarly, sampling of six other source parameters is carried out. Subsequently, based on the simulated source parameters, stochastic synthesis of earthquake slip is performed and the simulated source model is positioned within the target source region. Figure 3c shows four realizations of the synthesized source models for the M9.0 scenario. It can be observed that the geometry, location, and slip distribution of the source models vary significantly.
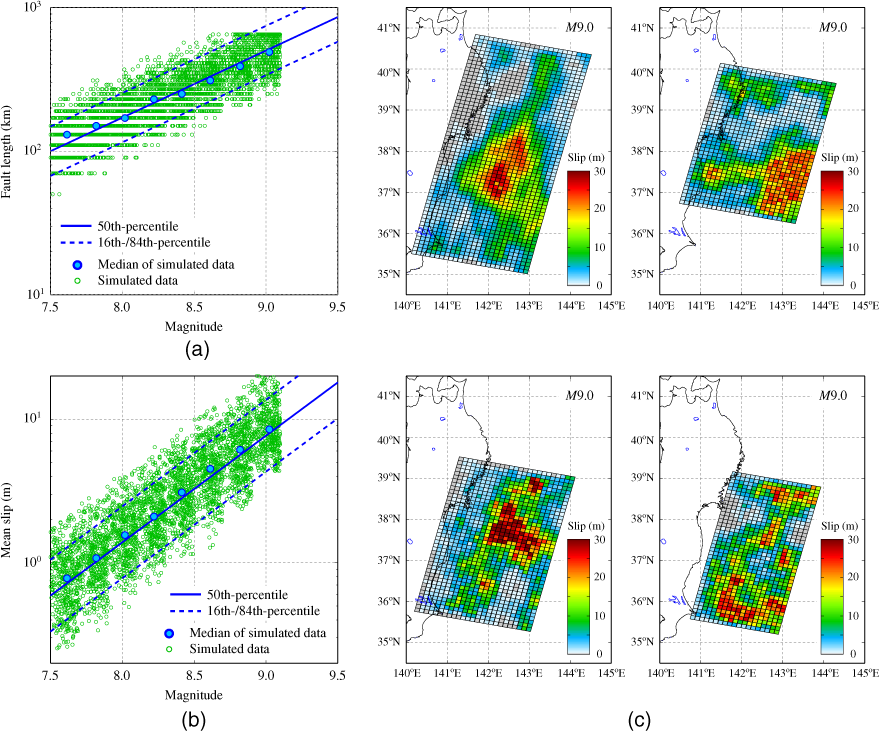
(a, b) Scaling relationships for fault length and mean slip by Goda et al. (2016), in comparison with the simulated fault length and mean slip of the 4,000 stochastic source models, and (c) four realizations of the stochastic source models for the M9.0 scenario.
Tsunami Inundation Model
For each of the stochastic source models, tsunami inundation simulation is performed. The initial water surface elevation is evaluated based on formulae by Okada (1985) and Tanioka and Satake (1996). Tsunami wave propagation is evaluated by solving nonlinear shallow water equations with run-up (Goto et al. 1997). The computational domains are nested following a 1/3 ratio rule at four resolutions (i.e., 1,350-m, 450-m, 150-m, and 50-m domains). A complete dataset of bathymetry/elevation, coastal/riverside structures, and surface roughness is obtained from the Miyagi Prefectural Government. All bathymetry, elevation, and structural height data are defined with respect to Tokyo Peil, which is the standard mean sea level in Japan. In the tsunami simulation, the coastal/riverside structures are represented by a vertical wall at one or two sides of the computational cells. To evaluate the volume of water that overpasses these walls, Honma's weir formulae are employed (JSCE 2002). The bottom friction is evaluated using Manning's formula following the Japan Society of Civil Engineers standard (JSCE 2002). The fault rupture is assumed to occur instantaneously, and numerical tsunami calculation is performed for duration of 2 hours with an integration time step of 0.5 s. The tidal fluctuation is not taken into account in this study because regional-scale tide models which capture realistic fluctuations at different locations were not available, while the effect of instantaneous ground deformation due to the fault movement is taken into consideration.
For the tsunami hazard and risk assessment in this study, coastal areas of Natori and Iwanuma Cities (the Sendai Plain) are focused upon. The topography of the areas is the low-lying coastal plain; see the elevation map shown in Figure 4. During the 2011 Tohoku tsunami, the areas were inundated completely and the majority of the buildings near the coast were destroyed (Fraser et al. 2013). A zoomed map of Figure 4 shows the spatial distribution of buildings located in Natori and Iwanuma. The building dataset considered in this study is obtained from the Ministry of Land Infrastructure and Transportation (MLIT 2014). The building dataset contains 6,791 low-rise structures (one to four stories), consisting of three structural/material types, that is, reinforced concrete (RC), steel, and wood. The number of RC, steel and wooden structures is 137, 558, and 6,096, respectively, and the majority of the buildings in Natori and Iwanuma are residential. To discuss the tsunami hazard results at a single location later, three points A to C are selected along the coastal line. The water depths at Points A and C (in sea) are 2 m, while the elevation at Point B (inland) is 3.9 m above mean sea level.
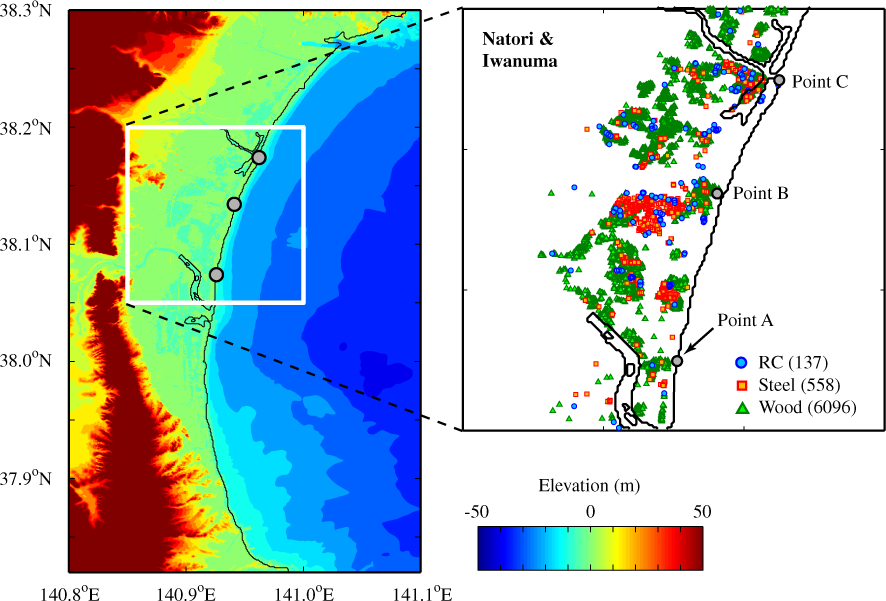
Elevation model and building portfolio in Natori and Iwanuma Cities, the Sendai Plain, Japan.
Figure 5 illustrates the Monte Carlo tsunami simulations for two stochastic sources (M8.4 and M9.0 events). For different magnitude scenarios, tsunami inundation simulations are conducted in the areas of interest, and relevant tsunami hazard parameters (e.g., maximum wave height and depth) are obtained. Using the inundation maps, spatially-aggregated tsunami hazard parameters, such as inundation areas above a certain depth, can be calculated. Subsequently, the computed tsunami hazard parameters (i.e.,
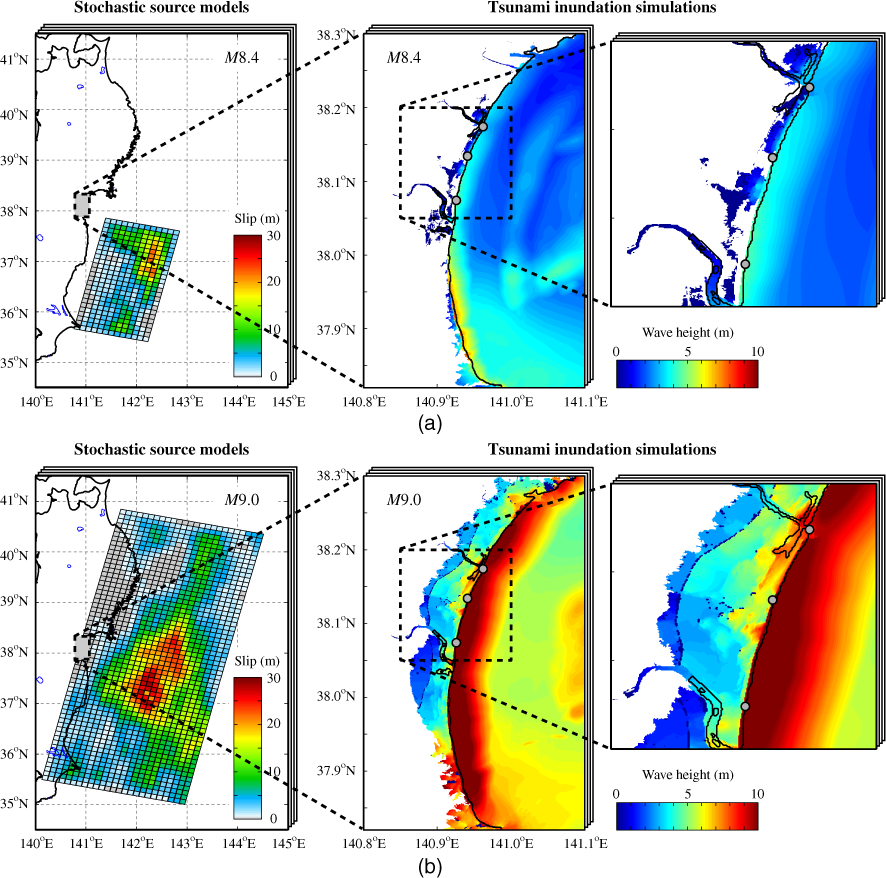
Stochastic earthquake source models and tsunami inundation results: (a) M8.4 scenario and (b) M9.0 scenario.
Building Portfolio and Tsunami Damage-Loss Estimation
To evaluate the tsunami damage (i.e., f
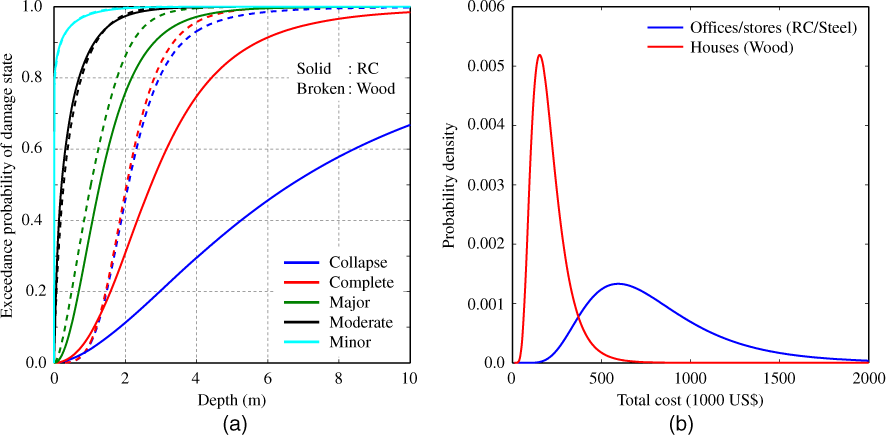
(a) Tsunami fragility curves for RC and wooden structures and (b) probabilistic models for the total building cost for offices/stores and residential houses.
After applying the fragility models and taking differences of the estimated exceedance probabilities for two adjacent damage states, discrete probabilities can be obtained for minor, moderate, extensive, complete, and collapse damage states. Subsequently, for each structure, a random number from the standard uniform distribution is generated and is compared with the damage state probabilities. This determines the realized damage state for this structure during the considered tsunami event. Each damage state is associated with a range of loss ratios. More specifically, loss ratio ranges for minor, moderate, extensive, complete, and collapse damage states are defined as 0.0–0.1, 0.1–0.3, 0.3–0.5, 0.5–1.0, and 1.0 (deterministic), respectively. The uniform distribution is assumed for the loss ratios. Note that the loss ratios are applied to the total cost of a building (see below), which includes both structural and non-structural elements.
By sampling the total buildings cost of stores/offices and houses (Figure 6b), which is considered to be lognormally distributed, the tsunami damage cost can be estimated (i.e., P(
Numerical Evaluation of Tsunami Risk Equation
As the results of the preceding probabilistic tsunami risk assessment, tsunami loss samples for 6,791 structures are obtained for 4,000 stochastic source models. These loss samples, together with λ
Mmin
and f
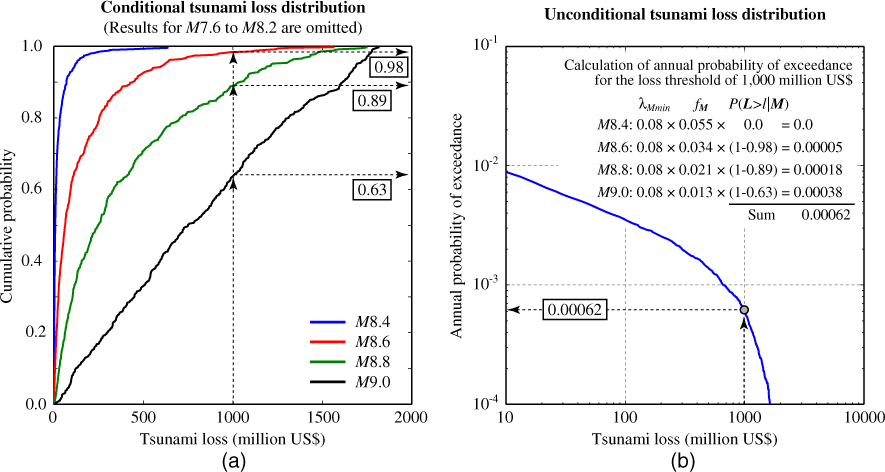
Numerical evaluation of unconditional tsunami loss distribution based on conditional tsunami loss distributions and occurrence probabilities of events having specific scenario magnitudes.
It is important to investigate the effects of the number of simulations (i.e., stochastic sources) per magnitude on the tsunami loss results because the Monte Carlo methods are adopted to evaluate the tsunami risk equation. Figure 8a shows the conditional tsunami loss percentiles (2.5th, 16th, 50th, 84th, and 97.5th) for the M9.0 scenario as a function of the simulation number, which is varied from 50 to 500. The results indicate that the conditional tsunami loss curves are stable when a sufficient number of stochastic source models (a few hundreds) are used for the conditional tsunami loss distributions. Although individual results for other scenario magnitudes are not shown, similar conclusions can be obtained, with tendency that tsunami loss percentiles fluctuate more when magnitudes are smaller (but the absolute values of tsunami loss percentiles become smaller at the same time). This trend can be explained by noting that the location of the fault plane with respect to the building portfolio varies more significantly when a smaller scenario magnitude is considered. Moreover, Figure 8b compares the unconditional tsunami loss curves that are obtained based on different numbers of stochastic source models per magnitude. When the number of simulations is relatively small (50 or 100), the tsunami loss curves are more jagged, whilst increasing the number of simulations results in more stable and smooth tsunami loss curves. Overall, it can be concluded that using 4,000 stochastic source models (i.e., 500 rupture cases per magnitude) produces stable tsunami loss results for the tsunami loss estimation conducted in this study.
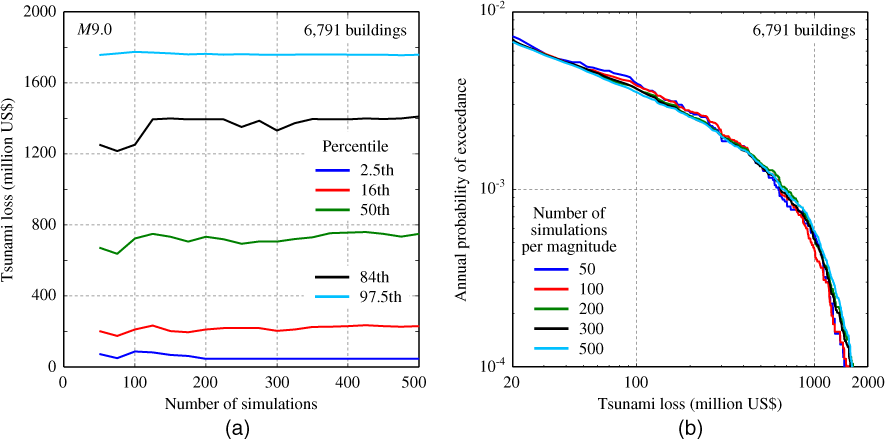
Sensitivity of the tsunami loss estimates to the number of simulations per magnitude: (a) conditional tsunami loss percentiles for the M9.0 scenario and (b) unconditional tsunami loss curves.
Illustration
In this section, results from the probabilistic tsunami hazard and risk assessments of the buildings in Natori and Iwanuma Cities in the Sendai Plain area are presented. Firstly, tsunami hazard estimates for single locations as well as areas in Natori and Iwanuma are discussed. Secondly, tsunami loss results for the building portfolio located in Natori and Iwanuma are discussed by emphasizing issues related to tsunami risk management.
Tsunami Hazard Analysis
The probabilistic estimates of the maximum tsunami wave height (which is measured from mean sea level) at a near-shore location are the fundamental input for designing coastal structures and developing an effective risk management plan (e.g., Chock 2016). To illustrate the stochastic-scenario-based PTHA, tsunami wave-height hazard curves for Points A to C (see Figure 4) are evaluated and the results are shown in Figure 9. Figure 9a presents the conditional tsunami wave-height hazard curves for Point A, whilst Figure 9b shows the unconditional tsunami wave-height hazard curves for Points A to C. The integration of the conditional hazard curves for different magnitude ranges into the unconditional hazard curve is carried out by following a similar procedure explained in Figure 7 (but focusing on tsunami wave height at a single location, rather than tsunami loss for the building portfolio). The conditional hazard curves for Point A (Figure 9a) clearly show that tsunami intensity increases significantly with the earthquake magnitude (noting that the horizontal axis is logarithmic). The unconditional hazard curve for Point A, shown in Figure 9b, indicates that the expected tsunami wave height for Point A at the 1,000-year return period level reaches 10 m, whereas the corresponding hazard value for Point B is only 6.3 m (note: the differences of the hazard values for Points A and C are mainly attributed to the existence of local tsunami barrier at the mouth of Natori River near Point C). These hazard values may be relevant to engineering design when coastal defense structures are to be constructed at these locations. It can also be seen that the unconditional hazard curve for Point B has a flat part (which is shown with a broken line) – this is because Point B is an onshore site at 3.9 m altitude. Only relatively large earthquakes cause tsunami waves that reach Point B; the annual probability of such inundation events can be estimated to be 0.0034 ≈ 300 years return period.
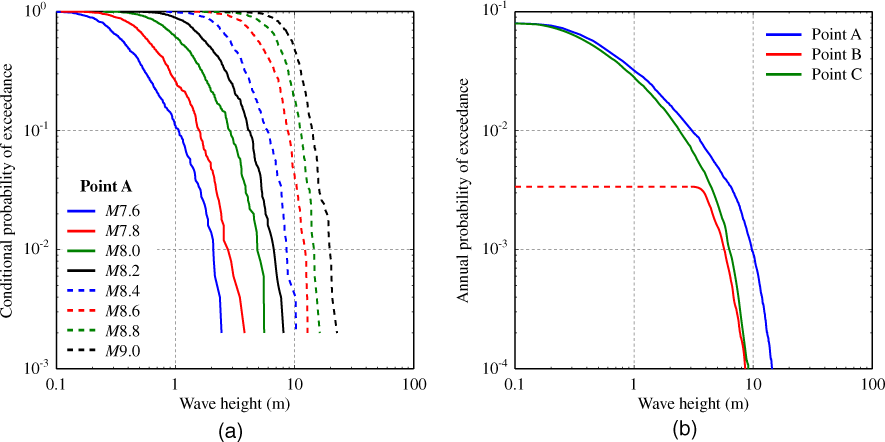
Tsunami wave-height hazard curves: (a) conditional curves for Point A and (b) unconditional curves for Points A, B, and C.
A notable advantage of the proposed stochastic tsunami simulation method is that accurate tsunami inundation modeling is performed; therefore, detailed inundation results for all stochastic source scenarios are available for post-processing. In such a case, inundation areas above a certain depth can be used as tsunami hazard parameters, facilitating tsunami hazard assessment and mapping for seaside areas of cities and towns. To demonstrate this, inundation areas above 1 m, 2 m, 3 m, and 5 m depth in Natori and Iwanuma are calculated. Figure 10a shows eight conditional inundation-area hazard curves for the 1 m threshold value, while Figure 10b shows the unconditional inundation-area hazard curves for the four depth threshold values. It is noted that the inundation-area hazards are significantly affected by the local terrain characteristics (e.g., Figure 4). The unconditional hazard curves corresponding to the four depth thresholds indicate that inundation areas at the 1,000-year return period level decrease significantly from about 30 km2 (1 m depth) to about 2 km2 (5 m depth). Typically, in the alluvial plain region, inundation areas with large depths are confined to seaside areas along the coast.

Tsunami inundation-area hazard curves for Natori and Iwanuma: (a) conditional curves for inundation areas above 1 m depth and (b) unconditional curves for inundation areas above 1, 2, 3, and 5 m depth.
Moreover, the Monte Carlo tsunami simulations facilitate the generation of stochastic tsunami wave profiles at locations of interest. Such tsunami wave profiles for Point B are shown in Figure 11 for three magnitude ranges. The tsunami wave profiles shown in Figure 11 are adjusted for land elevation, thus the wave amplitudes correspond to inundation depths, rather than wave heights (as shown in Figure 9b). Note that tsunami flow velocity profiles, although not shown in this study, can be generated, and some other tsunami hazard parameters, such as Froude number and momentum flux, can be evaluated in a similar manner (Macabuag et al. 2016, Petrone et al. 2017). The results shown in Figure 11 highlight that the tsunami wave amplitudes increase significantly with the earthquake magnitude, and that approximately 55 to 60 minutes are available at this location for evacuation prior to the arrival of major tsunami waves. It is also clear that inspection of the average trend as well as variability of the key tsunami hazard parameters provides valuable insight in developing local tsunami evacuation strategies. From a tsunami engineering perspective, simulated tsunami waveforms are particularly useful for carrying out advanced structural analyses subjected to tsunami wave loading to develop analytical tsunami fragility models (Attary et al. 2016; Petrone et al. 2017).

Tsunami wave profiles for Point B (elevation = 3.9 m): (a) Mw8.6 scenario, (b) M8.8 scenario, and (c) M9.0 scenario.
Tsunami Loss Estimation
As already demonstrated in Figures 7 and 8, the stochastic-scenario-based tsunami risk analysis procedure can be used to obtain a robust estimate of the tsunami loss curve for the building portfolio. It is noteworthy that although detailed results are not shown in this study, similar tsunami loss calculations have been carried out for the entire coast of Miyagi Prefecture; the considered building dataset includes more than 150,000 structures for the tsunami loss estimation. This clearly demonstrates high potential for implementing the developed tsunami risk methodology at regional and national levels. In fact, the most computationally extensive aspects of the method are Monte Carlo tsunami simulations, and the computational efforts required for the tsunami damage and loss assessments are relatively minor.
Figure 12a shows the conditional tsunami loss curves for all buildings in Natori and Iwanuma for the eight magnitude ranges. It can be seen that for extreme cases of the M8.8 and M9.0 scenarios, the tsunami loss values tend to be saturated because almost all buildings are in the complete damage or collapse damage state. This can happen because the majority of the buildings in Natori and Iwanuma are wooden residential houses (Figure 4), which will be washed away when the tsunami depth exceeds 4 m (Figure 6a). Figure 12b shows the unconditional tsunami loss curves for all buildings as well as three individual building types (RC, steel, and wood). The results shown in Figure 12b indicate that the majority of the tsunami loss in Natori and Iwanuma is concentrated in the residential sector. Figure 12b also provides quantitative information related to the current tsunami risk exposure for the building portfolio. For instance, the expected tsunami losses at the 500 and 1,000 years return period levels are about US$300 and 670 million, respectively. Although detailed results are not discussed further in this study, various risk metrics, such as annual expected loss (AEL), value at risk (VaR), and tail value at risk (TVaR), which are popular in financial industry, can be computed and used for disaster risk management decisions (Yoshikawa and Goda 2014).
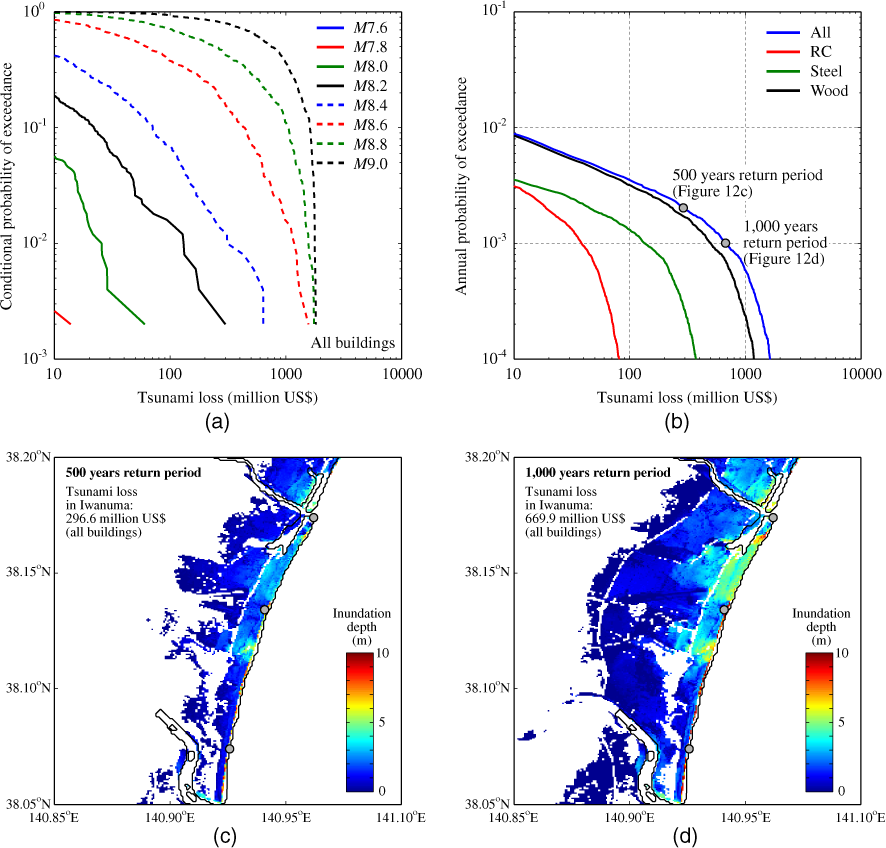
Tsunami loss results for Natori and Iwanuma: (a) conditional loss curves for all buildings, (b) unconditional loss curves for all, RC, steel, and wooden buildings, (c) inundation depth map for the 500 years return period, and (d) inundation depth map for the 1,000 years return period.
One of the advantages of the proposed tsunami risk assessment method is that tsunami loss results and corresponding tsunami hazard scenarios (in terms of inundation maps as well as earthquake source models) can be related directly. For illustration, two inundation depth maps that correspond to tsunami loss fractiles at the 500 and 1,000 years return period levels are shown in Figure 12c and Figure 12d, respectively. It can be clearly observed that with the increase of the return period level, inundation areas in Natori and Iwanuma increase significantly, thus damaging more buildings in these coastal communities. Importantly, presenting both tsunami loss curves and critical hazard maps will facilitate the risk communication among various stakeholders who have different technical background and capability in understanding probabilistic tsunami risk results and different interests (e.g., expected fatality, financial risk, and tsunami evacuation). Furthermore, from retrospective viewpoints, the tsunami loss curves can be compared with the actual tsunami loss caused by the 2011 Tohoku event. By considering the observed tsunami damage states compiled by the MLIT (2014) and the same information on loss ratio and building cost, the tsunami damage loss for the building portfolio is evaluated as US$1,043 million. This approximately corresponds to the return period of 1,850 years. Indeed, the observed tsunami inundation areas in Natori and Iwanuma (Goda et al. 2015) are larger than the inundation areas shown in Figure 12d (i.e., 1,000 years return period). These comparisons will be useful for communicating probabilistic tsunami loss results with non-technical stakeholders.
As the last remark, although detailed investigations are not carried out in this study, an effective way to utilize the tsunami loss results in tsunami risk management is to perform similar tsunami risk assessments by implementing risk mitigation measures in the numerical models and to compare the loss curves. For instance, heights of tsunami defense structures (e.g., revetments and walls along coast and rivers) may be varied to investigate the cost-effectiveness of the mitigation measures. To achieve such goals, tsunami fragility models for different structural configurations and corresponding cost models are needed. Alternatively, different plans for land use and building zonation can be implemented. Essentially, such investigations will facilitate quantitative cost-benefit analysis of tsunami disaster risk mitigation measures for coastal community.
Conclusions
This study developed a probabilistic tsunami risk assessment methodology for promoting the performance-based tsunami engineering (PBTE). The method is innovative in that uncertainties associated with earthquake source modeling are fully taken into account by integrating new prediction models of earthquake source parameters and stochastic synthesis of heterogeneous earthquake slip. The uncertainties in tsunami generation are propagated through Monte Carlo tsunami simulations including inland tsunami inundation. This facilitates the generation of various tsunami hazard parameters and outputs at different spatial scales (local, regional, and national). Through the post-processing of the tsunami simulation results and the tsunami fragility analysis, tsunami hazard and loss curves can be derived, which incorporate uncertainties related to earthquake occurrence, earthquake source rupture, tsunami propagation, building damage, and damage cost estimation. Most importantly, the proposed PBTE framework can be used for quantitative cost-benefit analysis of tsunami risk mitigation measures and will promote risk-informed management as well as financial decisions related to tsunami disaster risk reduction. It is also highlighted that the proposed method is compatible with the performance-based earthquake engineering (PBEE), and thus it can be used as the fundamental computational framework for assessing cascading earthquake-tsunami hazards and risks caused by the common earthquake rupture sources in the future.
Footnotes
Acknowledgments
This work was supported by the Engineering and Physical Sciences Research Council (EP/M001067/1).