
Abstract
A reduced beam section with a bolted web (RBS-B) connection is permitted for use only in intermediate moment frames (IMF) according to the ANSI/AISC 358-05. This is because some RBS-B test specimens failed to achieve 4% total rotation capacity, which is the minimum story drift angle required for special moment frames (SMF). Several studies reported that some RBS-B connections could experience brittle connection fracture during earthquakes, which can also be detrimental to the seismic performance of IMF systems with RBS-B connections. For investigating whether IMFs with RBS-B connections provide a satisfactory seismic performance, this study evaluated the seismic performance of IMFs with pre-qualified RBS-B connections following the ATC-63 procedure. Twenty-four model buildings were designed according to current seismic design provisions. Several IMFs with RBS-B connections do not satisfy the acceptance criteria specified in ATC-63.
Introduction
The reduced beam section (RBS) moment connection limits the amount of moment demand transferred to the column face by selectively trimming portions of the beam flanges. This promotes the formation of a plastic hinge at the location where the beam section is reduced thereby protecting the beam-column connection, and increasing the moment frame ductility and energy dissipation capacity. Depending on the type of beam web attachment to the column flange, RBS moment connections are classified into two types: RBS-bolted web (RBS-B) and RBS-welded web (RBS-W) connections.
Tests have shown that RBS-W connections can develop a total of 0.04 rad with high confidence, sufficient for the special moment frames (SMF) to repeatedly achieve a 4% story-drift angle during a design-level earthquake without connection fracture (FEMA 350 2000a). Engelhardt et al. (2000), however, reported that there is a higher incidence of brittle beam flange weld fracture in RBS-B connections than in RBS-W connections. ANSI/AISC 358-05 (2005) allows the RBS-B connection to be used as a prequalified moment connection for intermediate moment frame (IMF) systems that are expected to withstand limited inelastic deformations in their members and connections during the design earthquake (ANSI/AISC 341-05 2005, Chapter 10). IMF is not permitted to be used for seismic design categories (SDC) E and F. For SDC D, the building height must be less than 11 m (35 ft; AISC 7–10 2010).
Lee et al. (2005), however, reported that one RBS-B specimen, DB700-SB, failed before reaching a drift angle of 2%. Han et al. (2009) investigated the cause of fracture in RBS-B connections designed according to FEMA 350 (2000a) and found that the connection moment strength equation specified in FEMA 350 (2000a) overestimates the actual moment strength of RBS-B connections, leading to connection failure before the plastic moment capacity is reached at reduced beam sections. Han et al. (2012) reported that fractured RBS-B connections might provide only post-fracture limited rotation capacities.
When a moment frame experiences brittle connection fracture, the seismic response demands on the remaining frame element increase substantially (Luco and Cornell 2000), increasing the probability of an undesirable seismic response. Therefore, it is necessary to evaluate the seismic performance of IMF buildings with RBS-B connections designed in accordance with current design code requirements (AISC 358, 341, 360 2005a, b, c, b, d).
This study evaluates the seismic performance for IMF systems with RBS-B connections. The seismic performance evaluation is conducted based on the procedure specified in ATC-63 (2009). Four 3-, 6-, 9-, and 20-story model buildings with RBS-B connections are designed in accordance with current design code requirements (AISC 358, 341, 360 2005; ASCE 7 2005) considering different bay widths (6.0 m, 7.6 m, and 9.1 m) and seismic design categories (the lower- and upper-bounds of SDC C).
Prediction of Fracture of Rbs-B Connections
ANSI/AISC 358-05 (2005) and ANSI/AISC 341-05 (2005) specify an equation (Equation 1) to ensure that the connection moment strength (Mn) is larger than the probable maximum moment at the column face (Mf –pr) transferred from the RBS beam when the RBS reaches its maximum probable moment, Mpr (see Figure 1):

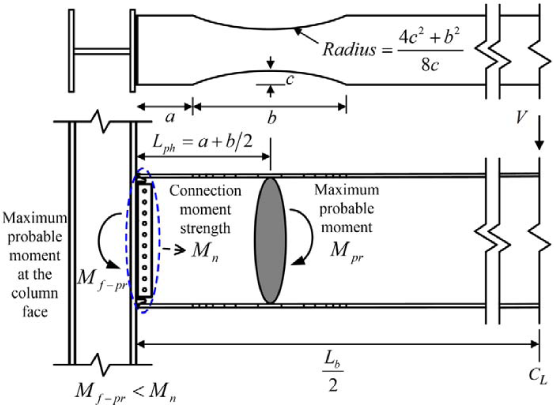
Bolted web reduced beam section (RBS-B) connection.
The connection moment strength is specified as follows (ANSI/AISC 358 2005):

Figure 2 shows the Mf –pr/Mn ratio for 18 fracture-resistant (Engelhardt et al. 2000, Tremblay et al. 1997, Iwankiw and Carter 1996) and 12 fracture-prone RBS-B connection specimens (Lee et al. 2005, Iwankiw and Carter 1996, Chen et al. 1996, Anderson and Duan 1998, Tsai and Chen 1996). The fracture-prone connection is defined as a connection experiencing fracture near the beam flange groove welds, whereas the fracture-resistant connection fails in ways other than fracturing near the beam flange groove welds. In this study, Mf –pr is calculated as Pmax × Lb (Pmax is the maximum actuator load obtained from the test, and Lb is distance between the column face and the actuator axis). Ideally, when Mf –pr/Mn is larger than 1, the connection is expected to fracture near the beam flange groove welds; otherwise the fracture occurs at the reduced beam section. To plot the Mf –pr/Mn ratio as in Figures 2a and 2b, Mn is calculated using Equation 2. As shown in Figure 2a, Mf –pr/Mn for all fracture-resistant connections is less than 1, which indicates that Equations 1 and 2 perfectly predict no occurrence of connection fracture near the beam groove welds for fracture-resistant specimens. In contrast, Figure 2b shows that only 6 of 12 specimens have an Mf –pr/Mn ratio greater than 1, which indicates Equation 2 may overestimate the moment strength (Mn) of some RBS-B connections. Therefore, for fracture-prone RBS-B connections, Equations 1 and 2 do not indicate the occurrence of fracture with acceptable confidence.
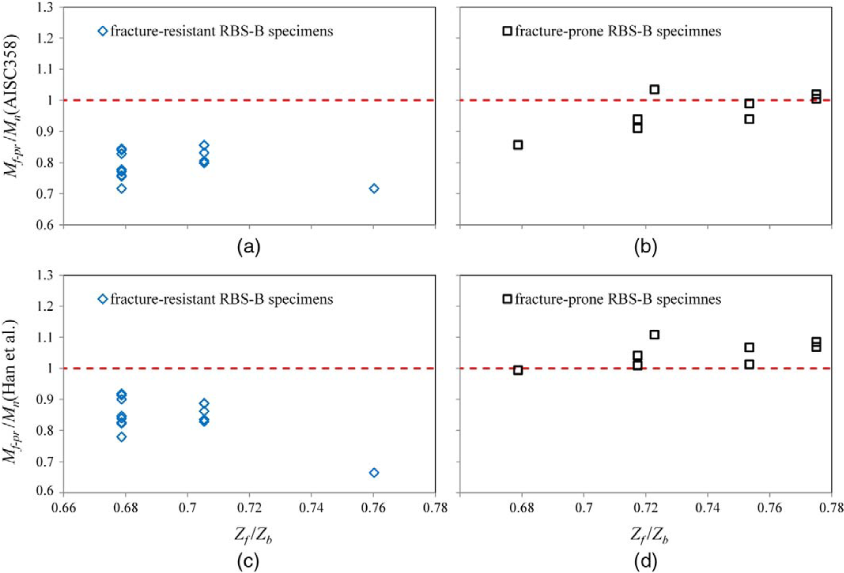
Mf –pr/Mn values for RBS-B specimens: Mn is computed using the equation specified in AISC 358 for (a) and (b), and using the equation proposed by Han et al. (2009) for (c) and (d).
The overestimate of the nominal moment strength can be attributed to bolt slip at the shear tab of the RBS-B connections. Such bolt slip increases the stress demands at the flange weld and may cause early weld fracture. In Equation 2, the effect of the bolt slip on the connection moment strength (Mn) is not explicitly considered. In addition, Equation 2 calculates the connection moment strength based on the unreduced beam section irrespective of the type of beam web attachment to the column flange.
To more accurately predict the connection fracture, Han et al. (2009) proposed an empirical equation for computing the moment strength (Mn) for RBS-B connections. The equations explicitly reflect the contributions of the bolted web connection (Mn–bolt) and the welded flange connections (Mn–flange) to the moment strength of the RBS-B connection (Mn) as follows:

Detailed information about computing connection moment strength using Equation 3 is summarized in Han et al. (2009). Figures 2c and 2d show Mf –pr/Mn for the fracture-resistant and fracture-prone specimens, respectively, where Mn is calculated using Equation 3. As shown in Figure 2c, Mf –pr/Mn is less than 1 for all 19 fracture-resistant connection specimens, which indicates that Equations 1 and 3 perfectly predict no occurrence of connection fracture for the fracture-resistant specimens. As seen in Figure 2d, fracture-prone specimens have Mf –pr/Mn values greater than 1, except for one specimen (DBT-2B). Note that the Mf –pr/Mn ratio for specimen DBT-2B is very close to 1 (= 0.99).
Analytic Model for Imf Systems with Rbs-B Moment Connetions
Hysteretic Behavior of Rbs-B Moment Connections
The moment strength of fracture-resistant RBS-B connections gradually deteriorates due to the local buckling after the peak moment strength is attained, as shown in Figure 3a (Tremblay et al. 1997), whereas the fracture-prone RBS-B connections (Figure 3b) experience connection fractures prior to the gradual deterioration of moment strength, causing a sharp decrease in moment strength (Lee et al. 2005). Figure 4 shows the conceptual backbone curves for the fracture-resistant and fracture-prone RBS-B connections. For fracture-resistant RBS-B connections, the connection moment strength, Mn, is larger than the moment demand at the column face, Mf –pr, corresponding to the probable maximum moment at the center of the reduced beam section. The connections, therefore, behave in a ductile manner when they experience significant strength degradation beyond Mf –pr due to local buckling. In contrast, the moment demand on the fracture-prone RBS-B connections (Figure 4b) exceeds the connection moment strength capacity, which leads to connection fracture. In order to predict the incidence of connection fracture, we use Equation 1 with Equation 3, as proposed by Han et al. (2009).
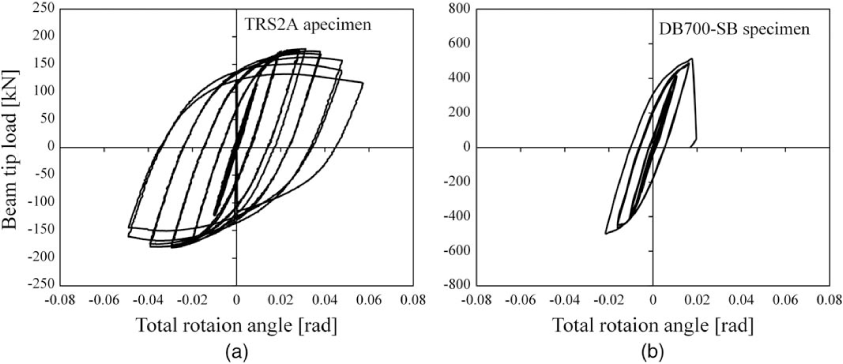
Cyclic behavior of RBS-B connection specimens: (a) Fracture-resistant RBS-B specimen (Tremblay et al. 1997), (b) fracture-prone RBS-B specimen (Lee et al. 2005).
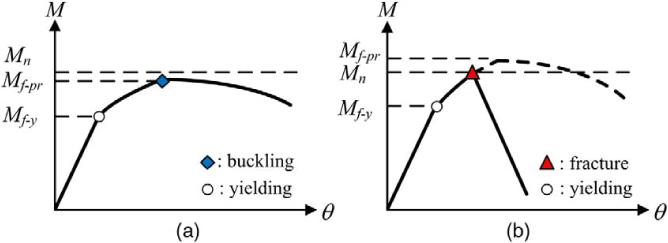
Conceptual backbone curves of (a) fracture-resistant RBS-B connection, (b) fracture-prone RBS-B connection.
Analytical Model for Rbs-B Moment Connections
An analytical model for RBS-B connections is proposed based on an the M2 model (Guptan and Krawinkler 1999, Krawinkler 2000), which can reflect clear lengths for beams and columns with explicit modeling of the panel zone as shown in Figure 5. Columns are modeled using a fiber section model consisting of steel material with a strain-hardening ratio of 3% (Figure 5a). To represent the hysteretic behavior of the panel zone, two spring elements are placed to simulate the tri-linear force-deformation relationship as shown in Figure 5b, including the contribution of post-yield stiffness and the strength of column flanges after the column web yields. The RBS is modeled with an inelastic rotational spring element (Lignos 2008), placed at the center of the RBS (Figure 5c) to simulate the strength and the stiffness deterioration using a tri-linear backbone curve. In Figure 5c, My (= SRBSFy) and Mc (= CprZRBSFy) denote the yield and maximum moment strengths, respectively, and θp and θpc are the plastic rotation and post-capping rotation capacities at the reduced beam section in the beam, respectively. Here, SRBS and ZRBS are the elastic section modulus and effective plastic section modulus of the reduced beam section, respectively, and Cpr is the peak connection strength coefficient. For the beam-column connection, a fracture spring is installed (Figure 5d) to fail when the moment demand at the connection reaches the connection moment strength (Han et al. 2009). After the connection fracture occurs, the residual strength of the connection spring (Figure 5d) is assumed as zero, which represents the test results conducted by Lee et al. (2005; Figure 3b).
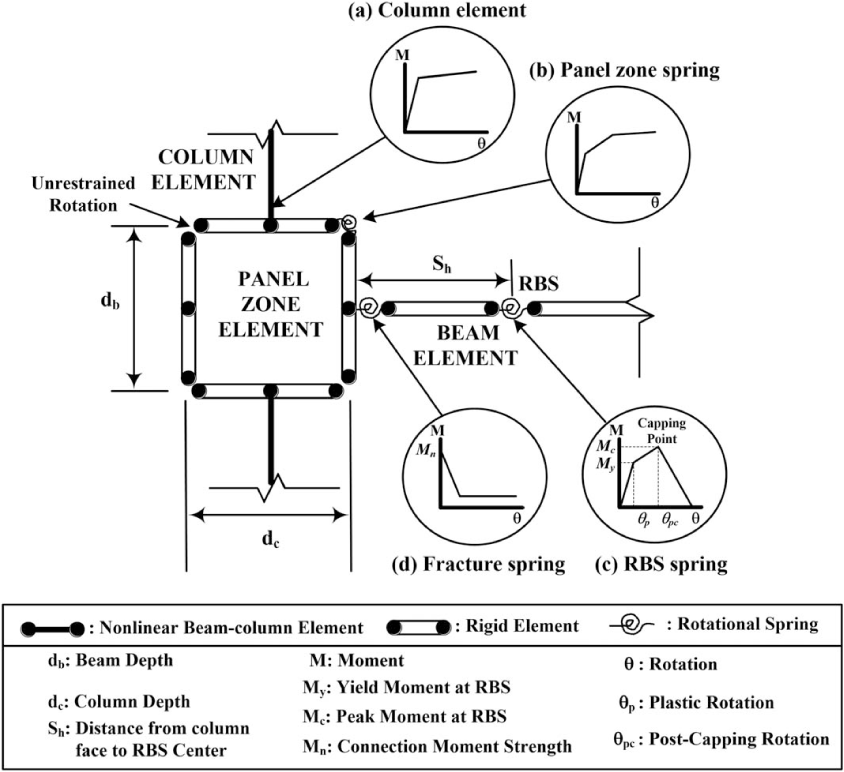
Analytic model for the RBS-B connections.
In order to verify the accuracy of the proposed analytical model, two fracture-resistant specimens and two fracture-prone specimens are examined. The hysteretic curves recorded during the tests of those specimens are plotted in Figure 6. To simulate those hysteretic curves, nonlinear static analyses are conducted using Opensees software (Mazzoni et al. 2005) with the proposed analytical model (Figure 5). Figure 6 shows actual and simulated hysteretic curves for the fracture-resistant and fracture-prone connection specimens. It is evident that the proposed analytical connection model satisfactorily predicts the actual hysteretic curves of the RBS-B connections, including their plastic rotation capacity, their strength and stiffness degradation due to cyclic loading, and the occurrence of connection fracture. The intermediate moment frame is modeled as two-dimensional (2-D) frames using the nonlinear analysis software OpenSees (Mazzoni et al. 2005). The P-Δ effect is included.
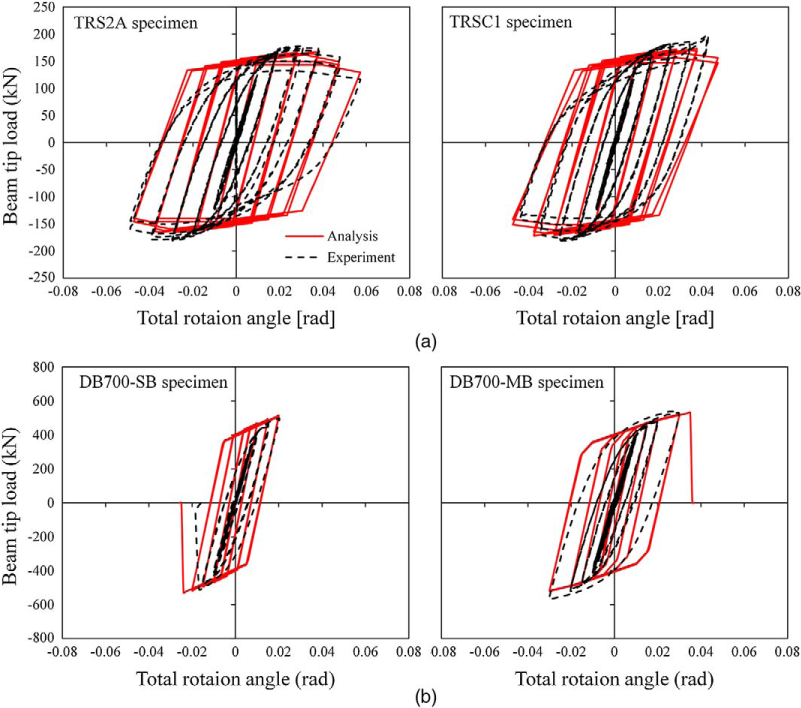
Hysteretic curves for fracture-resistant and fracture-prone RBS-B connection specimens: (a) Fracture-resistant RBS-B connection specimens (Tremblay et al. 1997), (b) fracture-prone RBS-B connection specimens (Lee et al. 2005).
Summary of the Atc-63 PROCEDURE FOR SEISMIC PERFORMANCE EVALUATION
ATC-63 (2009) provided a methodology for quantifying system performance and response parameters for use in seismic design. The two performance objectives used in ATC-63 are: (1) The probability of collapse for the maximum considered earthquake (MCE) ground motions is recommended to be 10% or lower, on average, across a performance group that contains model frames having a specific seismic force resisting system with different configurations, and (2) for an individual model frame, the probability of collapse is 20%, or less. To achieve those objectives, the adjusted collapse margin ratio (ACMR) is estimated, and compared with limiting values of ACMR as follows:
The average value ( The individual value (ACMRi) of the adjusted collapse margin ratios of model frames in a performance group exceeds ACMR20%:


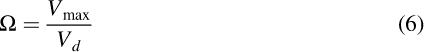
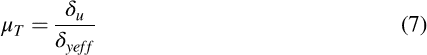
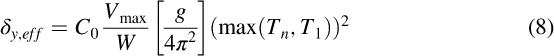
The values of ACMR10% and ACMR20% correspond to collapse probabilities of 10% and 20%, respectively. A step-by-step procedure to determine Select the model frames having a specific seismic force–resisting system of interest that reflects the range of design variables, such as number of stories, bay lengths, and seismic design categories (SDCs), and then design the selected frames according to current seismic design provisions. Divide the model frames into performance groups that share a common set of features and behavorial characteristics. Idealize the model frame using a proper analytical model. Conduct nonlinear static analysis to determine the overstrength factor, Ω, and period-based ductility, μT (= δu/δyef f) using Equations 6 and 7 with Equation 8, respectively. (Figure 7a)
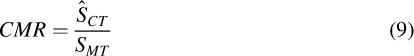
Conduct the incremental dynamic analysis (IDA) for computing median collapse capacity, ŜCT (Han and Chopra 2006, Vamvatsikos and Cornell 2002), and calculate the collapse margin ratio, CMR, for each model frame. Collapse is defined as the global dynamic instability as specified in ATC-63. When the frame reaches the dynamic instability state, deformation (e.g., story drift) increases without bound, according to the slight increase in ground motion intensity, which can be represented by pseudo-spectral acceleration [PSA(Tn, 5%)] at the fundamental period (Tn) of a 5%-damped SDF system. Figure 7b visualizes 44 IDA curves for a model frame subjected to 44 ground motions in which solid circles denotes collapse capacities. The CMR is calculated using Equation 9:
Calculate the spectral shape factor (SSF) that accounts for the spectral shape of rare ground motions as depicted in Figure 7c (Baker and Cornell 2006) and adjust the CMR.
The ACMR is then calculated as (Figure 7d):
Calculate ACMR10% and ACMR20%:
Determine whether individual model frames and the performance group satisfy the acceptable performance criteria specified in Equations 4 and 5.


Model Performance Groups and Ground Motions
This study adopts the seismic performance evaluation procedure prescribed by ATC-63 (2009). Six performance groups comprising model frames with varying number of stories, bay widths, and different seismic design categories (SDC) are considered. The seismic force resisting system for the model frame is the IMF with RBS-B connections. Frames with 3, 6, 9, and 20 stories are considered. The bay widths considered are 6.0 m (20 ft), 7.6 m (25 ft), and 9.1 m (30 ft). It is noted that a bay size of 6 m is not commonly used in practice. Two seismic design categories are considered: the lower and upper bounds of SDC C, SDC Cmin and SDC Cmax. Note that the SDC C building height is not limited by ASCE/SEI 7 (2005) for IMF systems. Table 1 summarizes the 24 different model frames considered in this study, grouped into six ATC-63 performance groups.
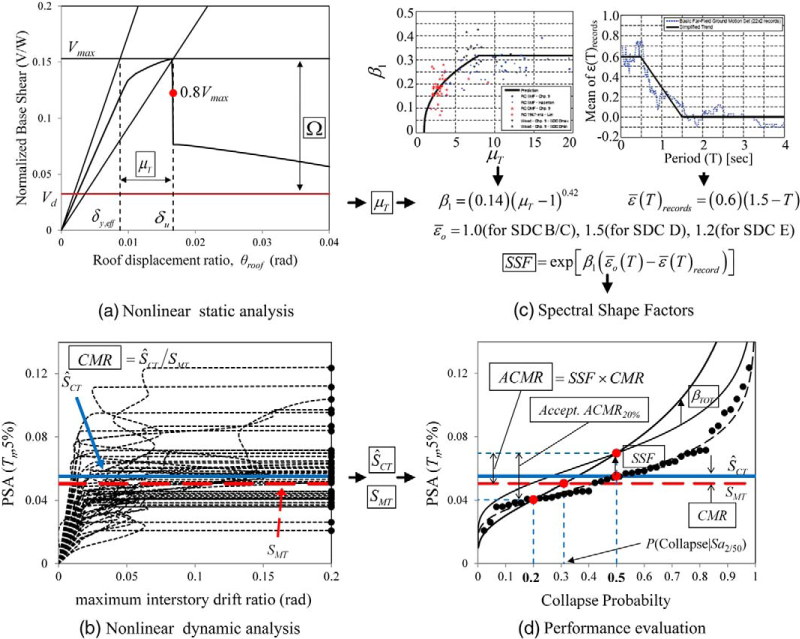
The summarized procedure for seismic performance evaluation in ATC-63 (2009).
The properties of IMFs and the ATC-63 performance groups
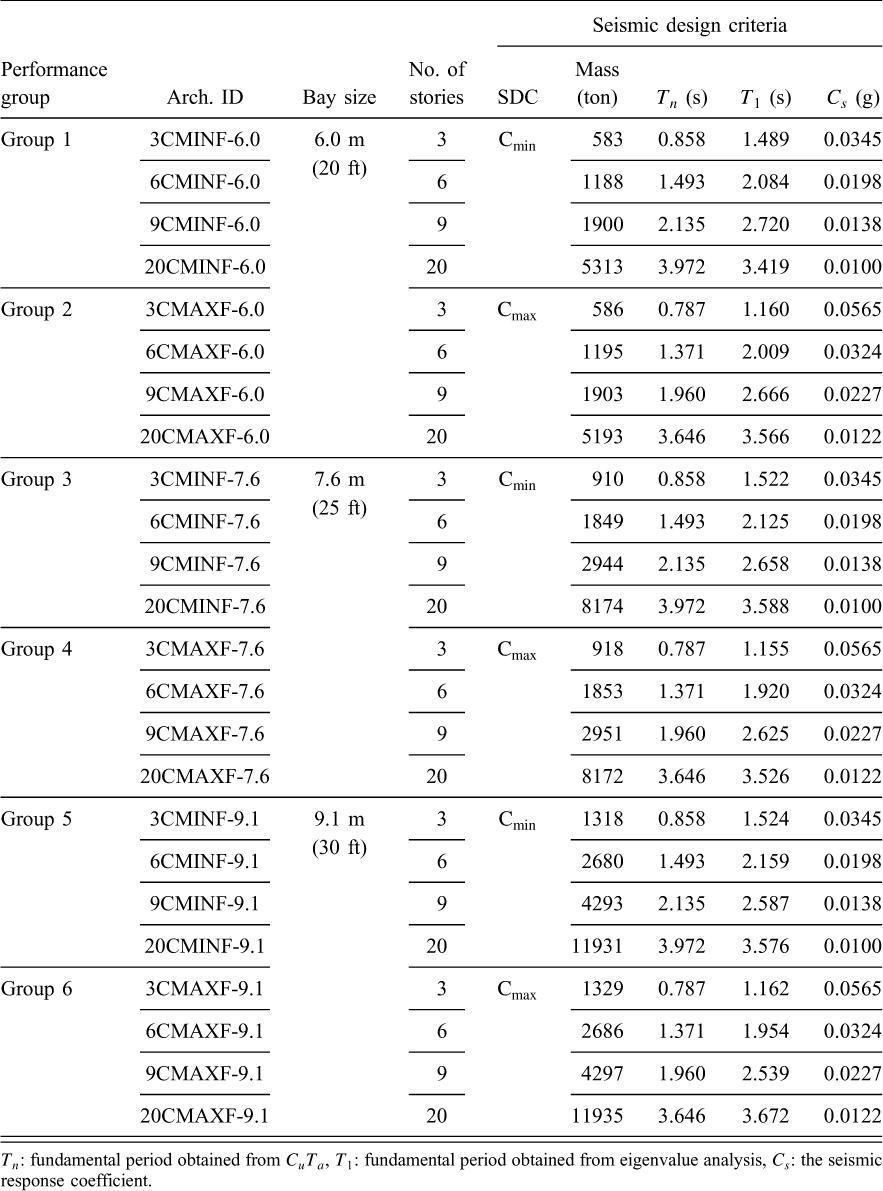
T n : fundamental period obtained from C u T a , T1: fundamental period obtained from eigenvalue analysis, C s : the seismic response coefficient.
All model buildings have a symmetric floor plan as shown in Figure 8. The perimeter frames are the seismic load–bearing IMFs denoted by the bold lines in Figure 8. All columns of the IMFs are assumed as fixed at the base. Corner columns are fixed only in the plane of the IMF they belong to prevent bi-axial weak-axis bending. The buildings in Figure 8 are assumed to be standard office buildings (occupancy category II) located on sites classified as site class D. For IMF systems, the response modification coefficient (R) is 4.5, system over-strength factor (Ω0) is 3, and deflection amplification factor (Cd) is 4 (Table 12.2-1 in ASCE/SEI 7 2010). The gravity dead and live loads for design are 4.12 kPa and 0.96 kPa, respectively. The basic wind speeds for wind loads is assumed as 51 m/s, which can be applied for the buildings (occupancy category II) located in most regions of the United States. Surface Roughness of B is used, which is specified for office building located in urban cities (ASCE/SEI 7 2010; Chapters 26 and 27).
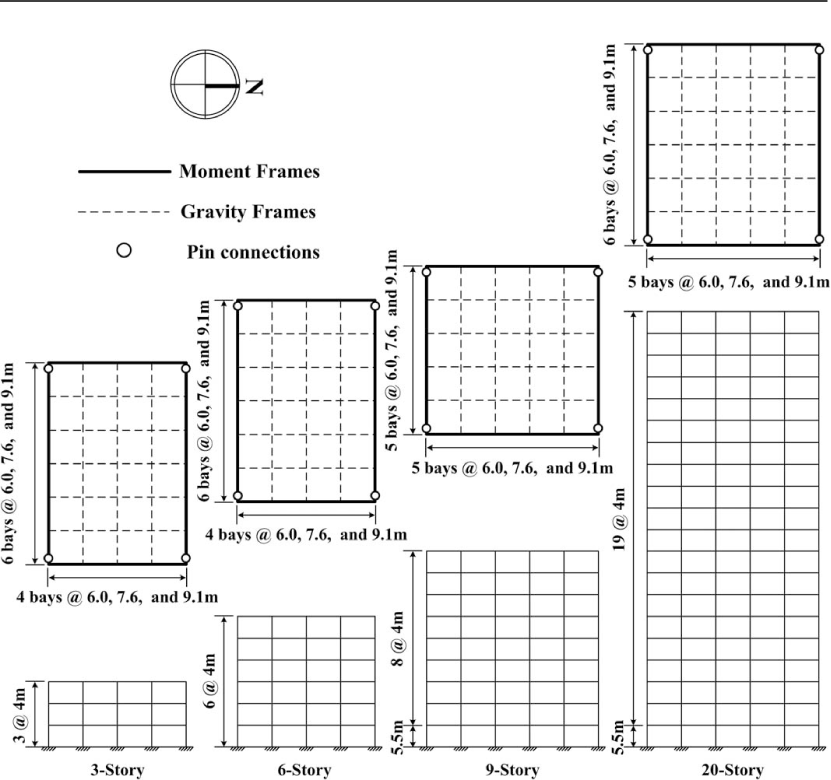
Plans and elevation of the building.
For determining the base shear force for IMFs, pseudo-acceleration response spectrum curves are constructed for SDC Cmax and SDC Cmin corresponding to the maximum considered earthquake (MCE) and the design earthquake (DE), based on ASCE/SEI 7 (2010), and shown in Figure 9. The fundamental periods of all model frames are calculated using the empirical equation prescribed in ASCE/SEI 7 (2010), marked in Figure 9.
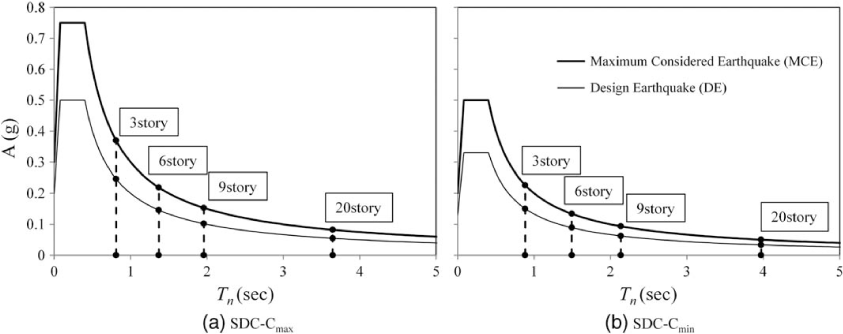
Acceleration response spectrum curves for maximum considered earthquake (MCE) and design earthquake (DE) corresponding to SDC Cmax and SDC Cmin.
The IMFs are designed according to ASCE/SEI 7 (2010) to satisfy the strength requirements specified in ASCE Chapter 10 (2010) and ANSI/AISC-341 Section 12.1.2 (2005), and drift requirements (ASCE 7 (2010), Sections 12.8.6 and 12.12). RBS connections are designed according to the procedures specified in ANSI/AISC 358 Chapter 5 (2005). To determine the dimensions for the RBS section (Figure 1a, 1b, and 1c), the Mf –pr/Mn ratio is set to 0.95, where Mn is calculated using Equation 2.
To conduct the incremental dynamic analysis, 44 far-field ground motions, obtained by ATC-63 (2009) from the PEER NGA database, considering earthquake magnitudes ranging from 6.5 to 7.6 and site classes C and D, are used.
Atc-63 Seismic Collapse Evaluation of the Model Buildings
Seismic performance evaluation is conducted for the 24 model frames shown in Table 1 using the procedure prescribed in ATC-63 (2009). Table 2 summarizes the evaluation results for each model frame. Eight of the 24 model frames and two of the six performance groups fail to meet the ATC-63 acceptance criteria. The failed eight model frames are 20CMAX-9.1, 20CMAX-7.6, 20CMAX-6.0 and 9CMAX-6.0 designed for SDC Cmax, and 20CMIN-9.1, 20CMIN-7.6, 20CMIN-6.0 and 9CMIN-6.0 designed for SDC Cmin. The failed performance groups are Group 1 and Group 2 that contain model frames with a bay length of 6 m designed for SDC Cmin and Cmax.
Summary of collapse margin parameters and acceptance check

In order to investigate the effects of the design variables—namely, the number of stories, the bay size, and the SDC—on the probability of collapse subjected to the maximum considered earthquake, the probability of collapse [P(collapse|SMT)] for each model frame is calculated using Equation 17:

Figure 10 shows the probability of collapse with respect to different design variables. The probability of collapse becomes higher with an increase in the number of stories. The median collapse probability for 20-story model frames is 0.287, whereas that for 3-story model frames is 0.010. The probability of collapse for all three- and six-story model frames is less than 0.200, which is the acceptance probability for individual model frames specified by ATC-63 (2009). No 20-story model frames satisfy this criterion. The effect of bay size on the seismic performance of the model frames is also significant. The median collapse probability for model frames with a bay width of 6.0 m is 0.174, seven times higher than that for the model frames with a bay width of 9.1 m (0.024). As shown in Figure 10b, the median collapse probability decreases with an increase of bay size. Regarding the SDC, the median collapse probability for the model frames designed for SDC Cmax (SM1 = 0.2 g) is 0.097, whereas the median collapse probability for the model frames designed for SDC Cmin (SM1 = 0.1 g) is 0.056. Thus, median collapse probability increases with a higher SDC, as shown in Figure 10c. However, this is only valid for the systems and SDC values considered in this study and cannot be generalized without further investigation.
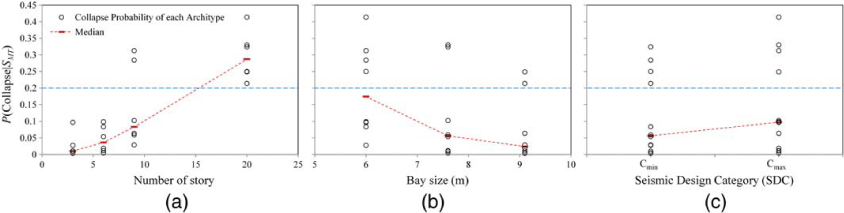
Probability of collapse for MCE earthquake with respect to (a) number of stories, (b) bay length, and (c) seismic design category.
Liu and Astaneh (2004) reported that shear tab connections, acting compositely with the floor slab, are capable of providing some lateral resistance in steel frame. FEMA 356 (2000b) recommended that the residual moment capacity for RBS connections be 20% of the connection strength. However, the residual strength may be very uncertain. As shown in Figure 3b, the strength suddenly dropped to zero after the connection fractured (Lee et al. 2005). Since this study develops an analytical model for fractured connection to accurately simulate the cyclic behavior shown in Figure 3b, the residual strength was assumed as zero. To investigate the effect of the residual connection moment strength, the probability of collapse is re-estimated for the 20 story model frames designed for SDC Cmax. A residual connection moment capacity is assumed as 0% or 20% of the connection moment strength. Figure 11 shows that the probability of collapse decreases with an increase in residual strength. The probability of collapse of the 20-story frames is, however, still greater than 0.2 (allowable collapse probability for an individual model frame according to ATC-63) irrespective of residual connection strength.
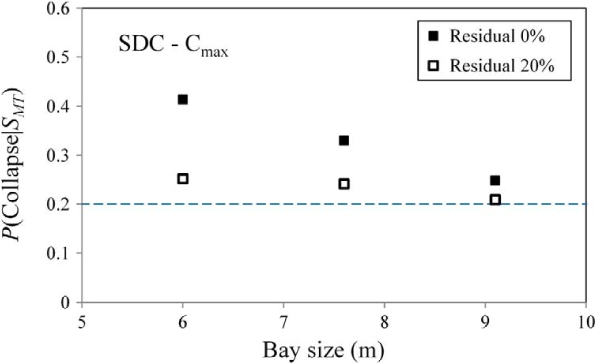
Probability of collapse for the 20-story model frames designed for SDC Cmax before and after considering 20% residual connection moment strength.
Seismic Behavior of the Model Frames
An investigation of the seismic performance of the model buildings in detail is conducted using nonlinear static (pushover) and nonlinear dynamic (incremental dynamic analysis) analysis methods.
Pushover Response Curves
The pushover response curves are constructed by conducting a nonlinear static response analysis of the model frames. Figure 12 shows the pushover response curves for the model frames in which the abscissa and ordinate represent maximum story drift ratio [θmax(= story drif/story height)] and base shear force (V) normalized by the building seismic weight (W), respectively. Maximum story drift ratio (θmax) is the largest story drift ratio among story drift ratios calculated for all stories in the frame.
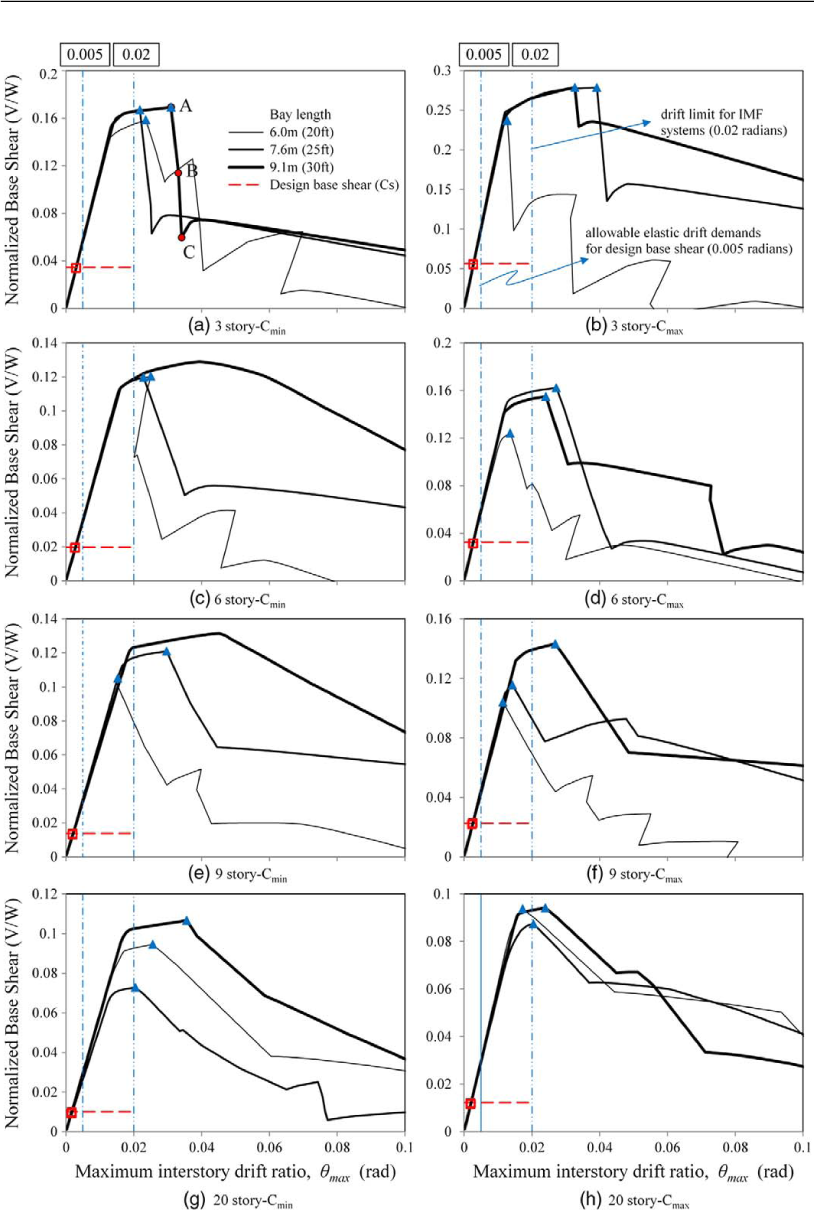
Pushover curves for model frames.
In Figure 12, hollow squares denote elastic story drift demand corresponding to a design base shear (Vd). ASCE/SEI 7-05 (2005) specifies the allowable inelastic story drift ratio (θa). Elastic story drift demand is then compared with allowable elastic story drift ratio (= θaI/Cd, where Cd is the deflection amplification factor, and I is the importance factor). In ASCE/SEI 7 (2010), θa and Cd for the IMF are 0.02 and 4, respectively, and the value of the importance factor, I, for a standard office building (occupancy category II) is 1.0. As shown in Figure 12, elastic drift demands for all model frame ratios are less than 0.005 (= 0.02 × 1/4), which indicates that all model frames satisfy the requirement for the allowable story drift ratio in ASCE/SEI 7 (2010).
In Figure 12, solid triangles represent the maximum story drift ratio of the model frames at the point where the first connection fracture occurs. Except for the six-story and nine-story model frames with bay widths of 9.1 m designed for SDC Cmin (6CMIN-9.1 and 9CMIN-9.1), all model frames experience a sharp strength decrease after connection fracture.
In order to investigate the effect of connection fractures on the seismic behavior of the IMFs with RBS-B connections, the change of member forces in model frame 3CMIN-9.1 after connection fracture is examined. Figure 13 shows column and beam moment demands normalized by the column plastic moment capacity (Mp) and the connection moment strength (Mn), respectively, corresponding to the states marked by A, B, and C in Figure 12a. Point A indicates a point just prior to connection fracture, when the moment demands of the first floor beams nearly achieve the connection moment strength (see Figure 13a). Point B is a point shortly after connection fracture occurs at the exterior first floor connection in column line C and D (Figure 13b). A fractured connection behaves as a pined connection. Point C in Figure 12a is the state when fracture occurs at RBS-B connections of all bay in the first floor and the inflection point in almost columns (column line B–E) in the first and second stories move to the location of the fractured connections (see Figure 13c). By equilibrium, the moment carried by the column at the location with the fractured beam connection becomes negligible. In other words, the column inflection point moves from approximately column mid-height to the location of the fractured connection after connection fracture, as evidenced by the moment distribution of the first and second story columns (column line D and E) in Figure 13c. The change in column moment distribution significantly affects the buckling strength of the column due to the increased column effective length (KL). This may induce a story mechanism in the frame at the story where all moment connection fracture.
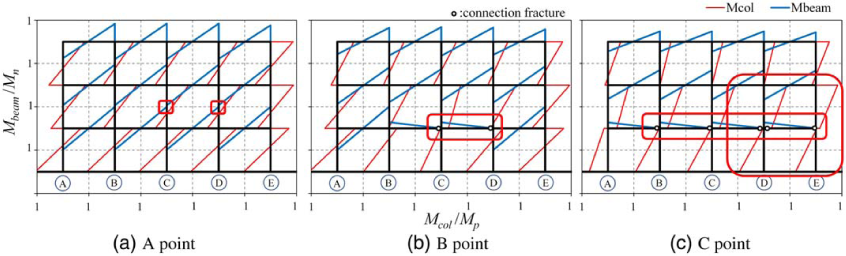
Member forces of beams and columns for a 3CMIN-9.1 frame.
The effects of design variables on story drift ratio at connection fracture (θF), marked by solid triangles in Figure 12, was also investigated. In Figure 14, θF is plotted with respect to the number of stories, bay size, and SDC. As shown in Figure 14a, the scatterness of θF is large in Figure 14a. Median θF (
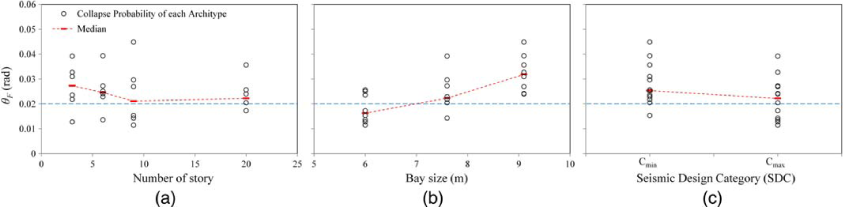
Story drift ratio at fracture (θF) for (a) number of stories, (b) bay length, and (c) seismic design category.
As shown in Figure 14b,
For the frames designed for SDC Cmin and Cmax,
Ida Curves
IDA curves are obtained from incremental dynamic analysis (IDA), requiring repeated nonlinear response history analyses of the structure for an ensemble of ground motions, each scaled to many intensity levels, selected to cover the entire range of structural response from elastic behavior to global dynamic instability. The IDA curves for the model frames are examined to evaluate the effects of connection fractures and the influence of design variables. The abscissa and ordinate of IDA curves are θmax and pseudo-spectral acceleration at the fundamental period (Tn) of a 5%-damped system [PSA(Tn, 5%)], respectively. Figure 15a shows median IDA curve for model frame 3CMAX-9.1 extracted from 44-IDA curves (one for each of the 44 ground motions considered in this study). In this figure, the median IDA curve for the ductile moment frame is included, which has the properties identical to those of model frame 3CMAX-9.1, except that it has connections that do not fracture. The occurrences of yielding, connection fracture, and collapse are also marked in Figure 15. In Figure 15b, the pushover curves of the two frames are plotted. Comparing the IDA and pushover curves, it is evident that the drift ratios at yielding and connection fracture obtained from the IDA curves are almost identical to those obtained from the pushover curves. The IDA curve of the model frame deviates from that of the ductile frame after connections start to fracture. The slope of the IDA curves in the elastic response range of the frames is similar to that in the hardening response range. In the post-fracture response range, the slope of the IDA curves for the model frame decreases significantly, whereas the slope of the IDA curve for the corresponding ductile frame does not deteriorate until the slope of its pushover response curve becomes negative.
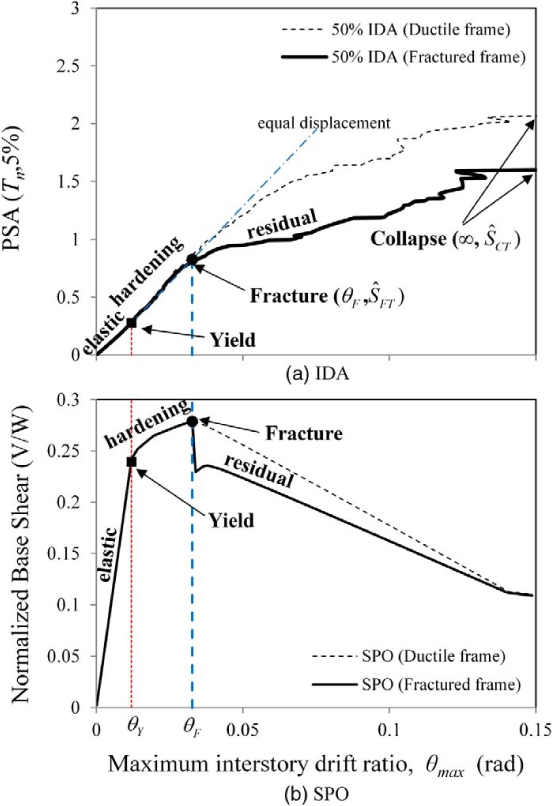
Relationship between IDA and pushover curves.
Such phenomena in IDA curves can be observed in all model frames (not presented in this paper). Figure 16 shows median IDA curves for the model frames. Solid triangles represent the point where connection fracture occurs for the first time for the model frames with bay sizes of 6.0 m, 7.6 m, and 9.1 m. The strength and drift at connection fracture are denoted by ŜFT [the median strength, PSA(Tn, 5%)] and θF, respectively. Median collapse strength (ŜCT) increases with an increase in θF.
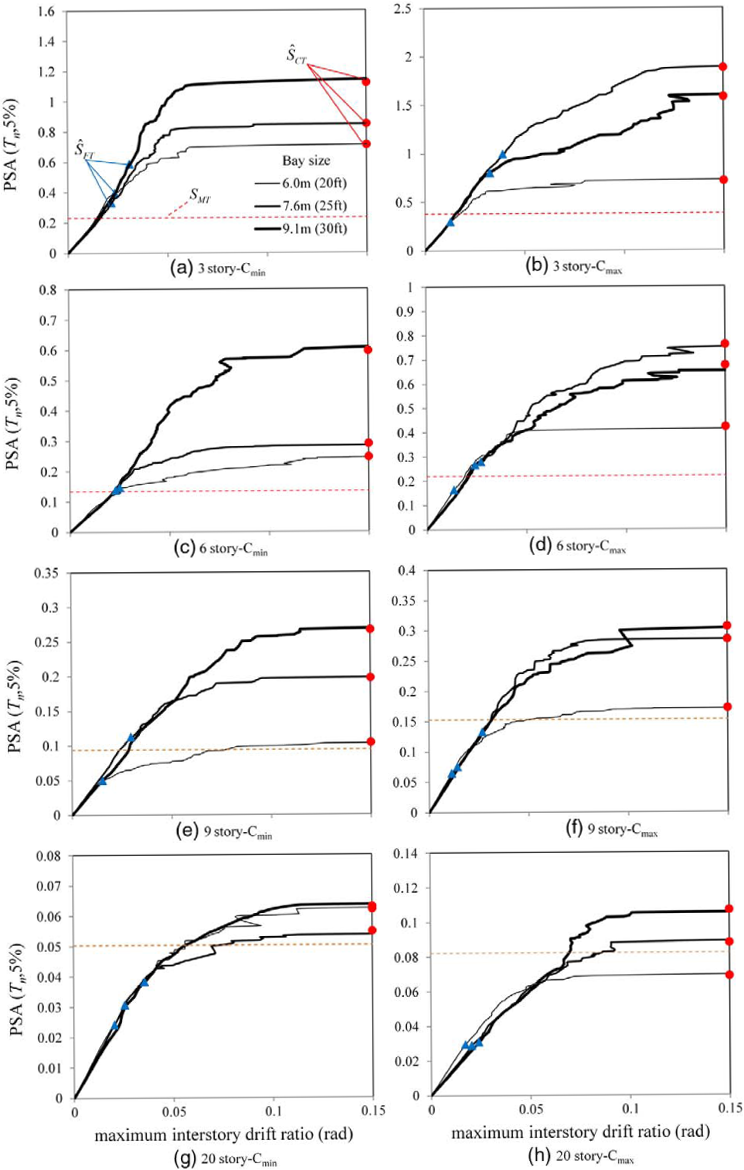
IDA curves for the model frames.
Comparing ŜFT and SMT [PSA(Tn, 5%)corresponding to maximum considered earthquake specified in ASCE 7 2010], the likelihood of ŜFT less than SMT is higher for the model frames designed for SDC Cmax than for those designed for SDC Cmin. As the number of stories increases, the likelihood of ŜFT less than SMT is higher. The 20-story model frames designed for SDC Cmax has the lowest ŜFT compared with SMT (Figure 16).
Figure 17 shows the values of the ŜCT /ŜFT ratio for the model frames with respect to all three design variables. The ŜCT /ŜFT ratio represents the reserve strength in frames after connection fracture. It is observed that ŜCT /ŜFT decreases with increasing bay size, whereas ŜCT /ŜFT increases with an increase of SDC level and the number of stories. The trends of ŜCT /ŜFT shown in Figure 17 are somewhat consistent with those in Figures 10 and 14. With an increase in the number of stories and SDC level (from SDC Cmin to SDC Cmax), decreases, but increases. (Figures 14 and 17) This indicates that the probability of collapse is higher for taller frames designed for higher SDC levels. Regarding the effect of bay size, and decrease with a decrease in bay size (Figures 14 and 17), resulting in an increase in collapse probability (Figure 10).
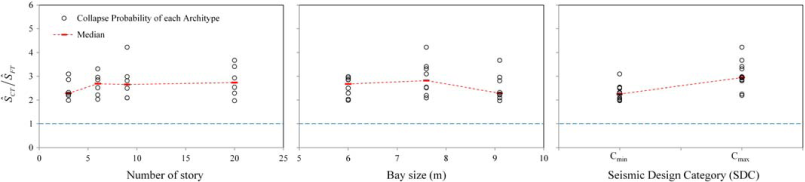
ŜCT /ŜFT values according to three different designs variables.
To conduct more complete investigations on the effect of the number of stories and the bay size on the probability of collapse, one 16-story frame with a bay size of 7.6 m is designed for SDC Cmax considering wind loads. Seismic performance evaluation is conducted for this frame according to ATC-63. The probability of collapse is 0.21, slightly exceeding the acceptance criteria (0.2) specified in ATC-63. In Figure 18, the probability of collapse is plotted for the frames with a bay size of 7.6 m designed for SDC Cmax with respect to the number of stories. The probability of collapse increases with an increase in the number of stories. When the number of stories for the frames with a bay size of 7.6 m is greater than 15, the frames do not meet the acceptance criteria specified in ATC-63 (Figure 18).
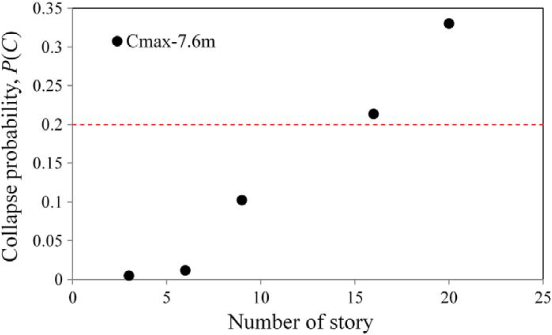
Probability of collapse for MCE earthquake with respect to number of stories for 7.6 m bay size and SDC Cmax.
Conclusion
This study evaluated the seismic performance of intermediate moment frames with RBS-B connections designed according to current seismic design provisions. The procedure for seismic performance evaluation prescribed in ATC-63 (2009) was used. An analytical model for RBS-B connections was developed to emulate the hysteretic behaviors of fracture-resistant and fracture-prone RBS-B connection specimens. Twenty-four model frames and six performance groups with different numbers of stories, bay size, and SDC values were considered. Eight of 24 model frames and two of six performance groups failed to meet acceptable performance levels against collapse according to ATC-63 (2009). It is observed that the probability of collapse for the model frames increases with an increase of the number of stories and SDC level, and a decrease in bay size.
In order to conduct a more thorough investigation of the seismic behavior of intermediate moment frames with RBS-B connections, pushover and IDA curves were examined. These curves of IMFs with RBS-B connections deviate from those of corresponding frames with ductile connections after connection fracture. With an increase in the number of stories and a decrease in bay size, ŜCT /ŜFT and θF become smaller, where ŜCT /ŜFT represents the safety margin between the first connection fracture and the collapse of the system. As expected, the collapse probability increases accordingly. Conversely, a higher SDC (increasing SDC Cmin to SDC Cmax), results in an increase in ŜCT /ŜFT and θF, and a decrease in the collapse probability of the system. Thus, an increase in story height and a decrease in bay width lead to a higher probability of system collapse. In summary, the collapse performance of IMFs with RBS-B connections evaluated using the ATC-63 procedure is not satisfactory for the taller frames with a small bay size. Based on the results of this study, IMFs with RBS-B connections is applicable to buildings having 15 stories or fewer, and a bay size of 7.6 m or longer.
Footnotes
Acknowledgements
Authors acknowledge the financial supports provided by National Research Foundation of Korea (No. 2014R1A2A1A11049488). The valuable comments offered by three anonymous reviewers are greatly appreciated.