
Abstract
This study introduces an attenuation model based on the strain energy approach for estimating earthquake demand energy (EDE) to evaluate soil liquefaction potential. A new method is presented to estimate the EDE at a free-field site when only one record of the ground surface acceleration is available. This method was generated after analyzing the earthquake data of 18 downhole arrays in California. The developed method was later employed for calculating the EDE values of 328 earthquake records worldwide. Results showed that several parameters affected the EDE amount, including earthquake magnitude, faulting mechanism, site-to-source distance, shear wave velocity, and peak ground acceleration (PGA). These parameters were categorized by three main functions including source, distance, and site effect functions. An attenuation model was incorporated as a result of these three functions. Finally, the demand energy of two liquefaction array sites—Port Island (PI) site in Japan and Wildlife Liquefaction Array (WLA) site in California—were predicted by the proposed attenuation model and compared to the calculated capacity energies of these sites with satisfactory results.
Introduction
Since the 1970s, researchers (e.g., Trifunac 1976, Abrahamson and Shedlock 1997, Abrahamson et al. 2008, Gregor et al. 2014, Travasarou et al. 2003) have proposed many attenuation relationships for estimating ground motion parameters, such as peak ground acceleration (PGA), peak ground velocity (PGV), response spectra, and Arias intensity.
Earthquake energy is also attenuated from source to site, and can be implemented to evaluate the liquefaction potential of a soil layer based on the energy approach. Theoretically, the energy approach method is more sound compared to the other methods. Kokusho (2013) conducted a comparative study between energy-based and stress-based methods to show the importance of the energy approach. While the stress method also has been successful to model pore pressure build-up (Baziar et al. 2011a), the energy approach has been, for various reasons, the focus of many research projects in recent years, some of which are listed below.
Energy released from the earthquake source is quantified and estimated by seismological parameters (Richter 1936; Gutenberg and Richter 1954, 1956).
There is a strong relationship between energy loss during cyclic loading and generated pore water pressure. The amount of energy loss is independent of the loading and stress path amplitudes (Nemat-Nasser and Shokooh 1979, Towhata and Ishihara 1985, Baziar and Sharafi 2011).
The main advantage of the strain energy approach, compared to previous methods, is the manner in which it considers the effects of the entire shear stress and shear strain time histories simultaneously (Towhata 2008).
The earthquake energy reaching a soil element consists of both strain energy and kinetic energy (Kokusho and Suzuki 2011, 2012). Recently, the kinetic energy concept has also been employed for assessing soil liquefaction potential (Jafarian et al. 2014). In this alternative method, the amount of earthquake kinetic energy, estimated by soil particle velocity, is considered as a replacement for strain energy to determine the earthquake demand energy (EDE) value. However, the strain energy method has always been more popular among liquefaction researchers due to its increased compatibility with the unit of energy and direct relationship with pore pressure build-up.
In contrast to surface ground motion parameters (e.g., PGA and PGV), which can be recorded directly by instruments, the amount of EDE at any site needs to be calculated. Some researchers (Zeghal and Elgamal 1993, Davis and Berrill 1998) have proposed a series of linear and nonlinear methods that help determine the shear stress-strain behavior of the soil layer at the downhole array site during an earthquake, when at least two recorded accelerations are available. Since the downhole array sites are not common in different parts of the world, researchers have not been able to study the strain demand energy based on a reasonable amount of actual data. In this study, a new method is introduced to estimate the amount of EDE at a site using only surface recorded acceleration. Using this method, EDE values at wide-ranging sites are calculated, and the effect of several parameters, such as earthquake magnitude, faulting mechanism, site-to-source distance, average shear wave velocity, and PGA on the EDE are assessed. Additionally, to account for the near-field effect in EDE values, a threshold distance R th , proportional to earthquake magnitude is introduced, and the collected databank is divided into near-field and far-field data. Eventually, an attenuation model for estimating EDE at a site is proposed based on the categorized databank.
Definition of Demand Energy
The main concept of the energy method is to determine the values of capacity and demand. The ratio of capacity and demand, like stress or strain methods, defines the safety factor against liquefaction potential. The capacity energy, studied experimentally by many researchers (Law et al. 1990, Figueroa et al. 1994, Green et al. 2000, Baziar and Jafarian 2007, Baziar and Sharafi 2011, Jafarian et al. 2012), is the minimum required energy for liquefying a soil element, and can be determined by the cumulating area of hysteresis loops up to liquefaction triggering. Contrary to capacity energy, determining the demand energy requires seismological and field study. The amount of demand energy can be calculated using the cumulating area of hysteresis loops during the shaking period, if the soil element has enough capacity to withstand the earthquake motion and does not liquefy.
Richter (1936) related the earthquake released energy at a source to earthquake magnitude. Later, Gutenberg and Richter (1954, 1956) developed the following relations in linear and nonlinear forms:


Overall, the empirical equations proposed by researchers for estimating the strain demand energy are based on simplified assumptions or numerical modeling. In other words, there is no comprehensive study on the evaluation of strain demand energy based on a wide range of actual strong motion data.
Downhole Array Database
In this section, an attempt is made to develop a new method that estimates the shear stress and shear strain time histories caused by an earthquake motion, when only one accelerometer on the ground surface is available. Earthquake data from 18 downhole arrays in Northern and Southern California were utilized. Table 1 presents these earthquakes with relevant information.
List of downhole array events used in this study (data source: CESMD)
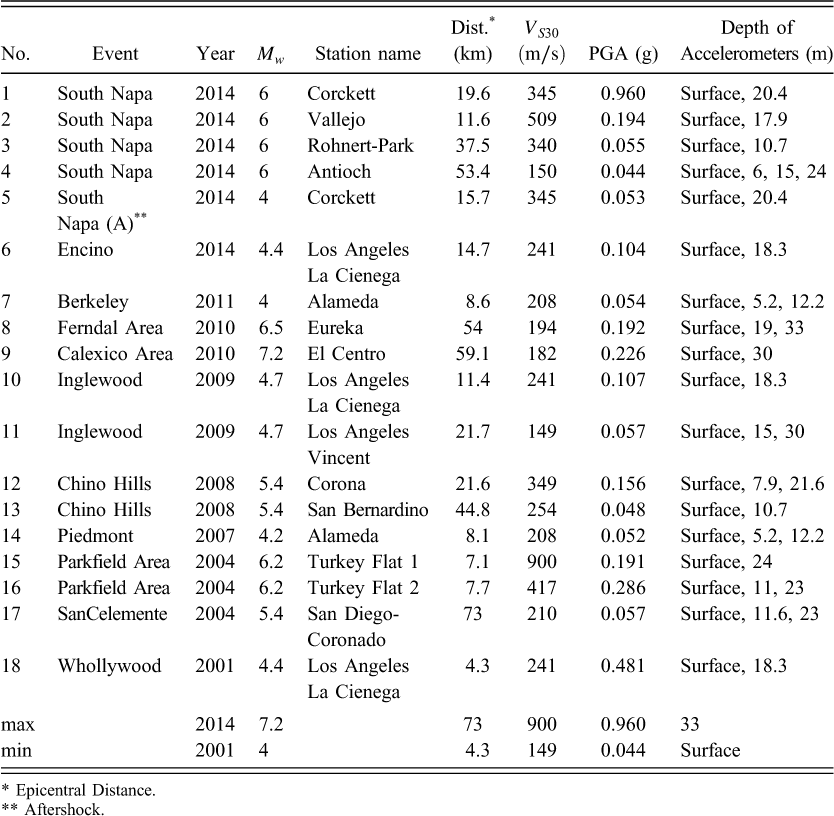
Epicentral Distance.
Aftershock.
Using the trigonometric interpolation method (Davis and Berrill 1998), the shear stress-strain hysteresis loops were extracted in two horizontal directions (E-W and N-S components) for different depths of downhole array sites between the surface and downhole accelerometer levels. Figure 1 depicts the E-W component of the Corona site hysteresis loops at a depth of 3.95 m, obtained by the trigonometric interpolation method. The cumulative area bounded by the hysteresis loops was later calculated using the Trapezoidal method (see Green et al. 2000). Figure 2 illustrates the EDE values, which are calculated from various depth hysteresis loops of downhole array sites. The EDE value increases with increasing depth for all downhole array sites, as seen in Figure 2. This behavior is justifiable as more energy is needed to overcome the friction between soil particles under higher confining pressure; EDE is therefore, expected to increase with increasing depth.
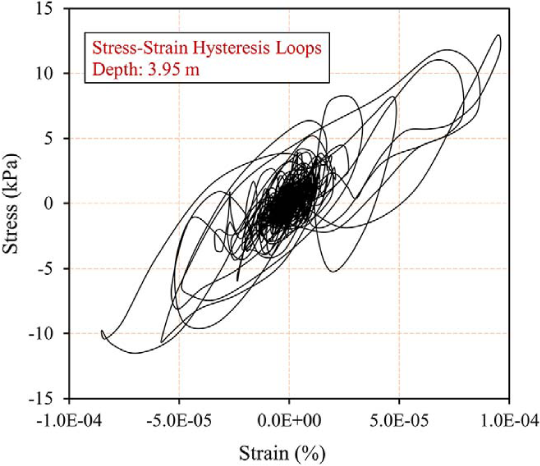
Shear stress-strain hysteresis loops at a depth of 3.95 m for the Corona site during the 2008 Chino Hills earthquake.
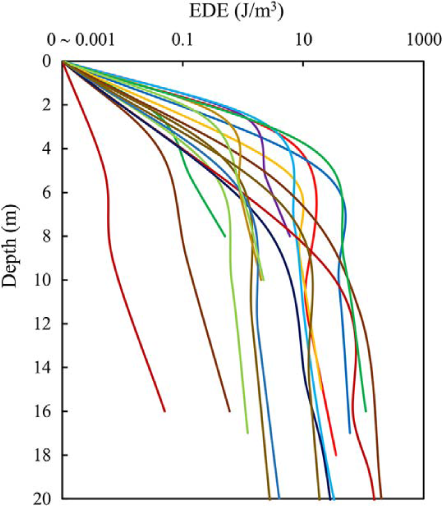
Earthquake demand energy (EDE) versus depth for the 18 downhole arrays.
Estimation of Shear Stress Time History
Seed and Idriss (1971) proposed a simplified procedure to assess the induced cyclic shear stress at depth (see Figure 3). They assumed a rigid behavior for the soil column above an element of soil at depth h, and obtained the maximum shear stress on a horizontal plane by the following equation:

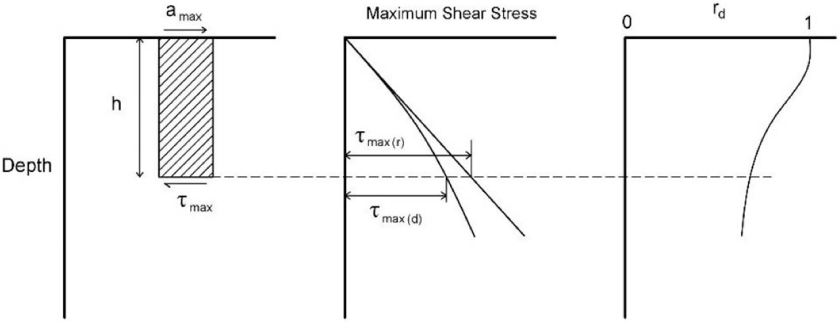
A schematic illustration for determining maximum shear stress, τ max , at depth and stress reduction coefficient, r d (after Seed and Idriss 1971).
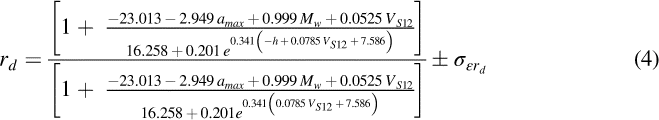
In the present study, the authors employed Equation 4 and replaced the maximum surface ground acceleration, a
max
, with the acceleration time history, a(t). This modified coefficient was referred to as the nonlinear time series factor, rd*(t), and was used to estimate the shear stress time history at a depth of h, based on Equation 3:

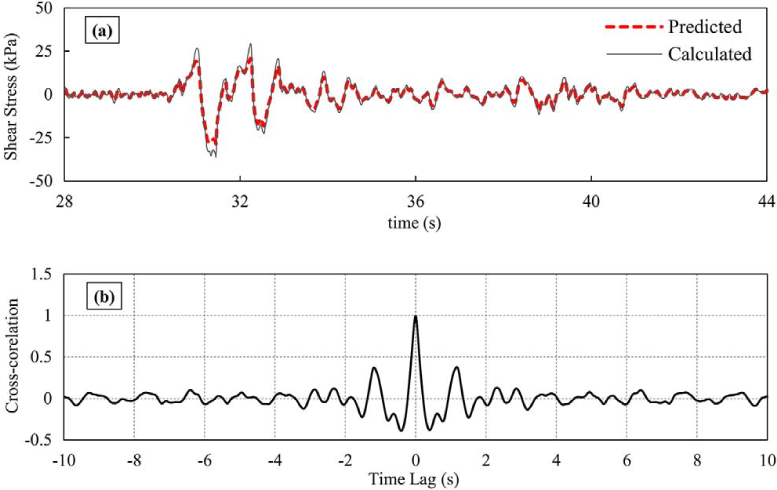
Comparison between calculated, using measured vertical array records, and predicted shear stress time histories at a depth of 9.5 m for the Eureka site during the 2010 Ferndale Area earthquake: (a) Shear stress, (b) Cross-correlation between calculated and predicted time series.
Estimation of Shear Strain Time History
In this study, it was observed that the time histories of displacement differences between the surface and shallow depths of the sites in all downhole array data were greatly related to the combination of the smoothed acceleration time history and the velocity time history at ground surface. Figure 5 illustrates the differences between the displacement time histories at the ground surface and at a depth of 21.6 m for the Corona downhole array site during the 2008 Chino Hills earthquake. In addition, this figure shows the surface acceleration, smoothed using the LOESS method, and the surface velocity time histories of the site during the earthquake. As seen in this figure, the waveforms of these time series are largely similar, which was almost true for all the events in Table 1. The following relation was thus suggested to estimate differences in the displacement of time histories:


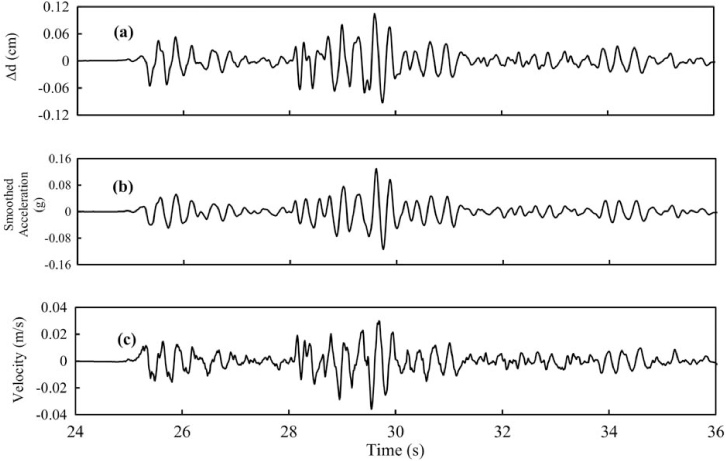
Comparison between time histories of displacement difference, surface acceleration, and surface velocity of the Corona site during the 2008 Chino Hills earthquake: (a) displacement difference between the surface and the depth of 21.6 m, (b) smoothed surface acceleration, (c) surface velocity.
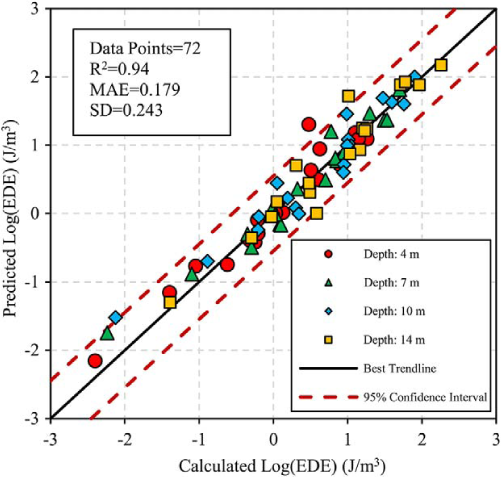
As evident in Figures 6a and 6b, Equations 7–10 are well suitable for estimating the shear strain time history. Figure 7 illustrates the predicted EDE using the proposed simplified method versus the calculated values, for 18 vertical arrays. In addition, Figure 8 demonstrates the degree of coincidence between the predicted and calculated results of 72 points (four different depths of 4, 7, 10, and 14 m for 18 vertical arrays).

Comparison between calculated, using measured vertical array records, and predicted shear strain time histories at a depth of 9.5 m for the Eureka site during the 2010 Ferndale Area earthquake: (a) Shear strain, (b) cross-correlation between calculated and predicted time series.
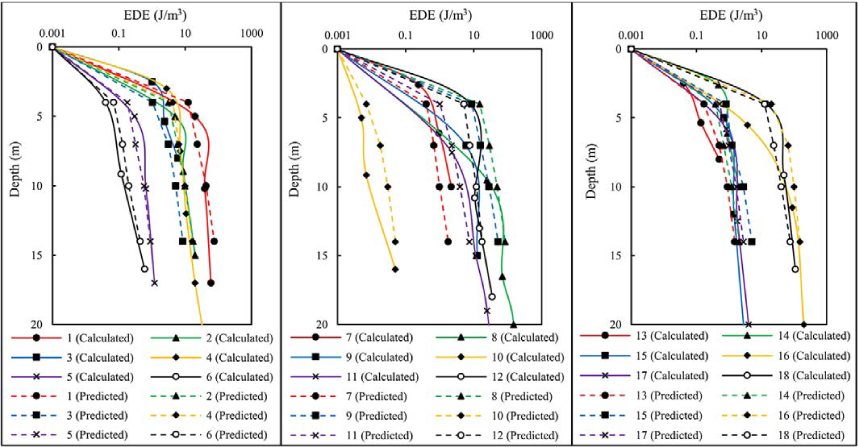
Calculated EDE, using measured vertical array records (presented in Figure 1), and predicted EDE, by simplified method, for 18 vertical arrays.
Predicted EDE, using simplified method (with only surface acceleration), against calculated EDE for different depths of 18 vertical arrays (with accelerations in depth and surface).
Ground Motion Database
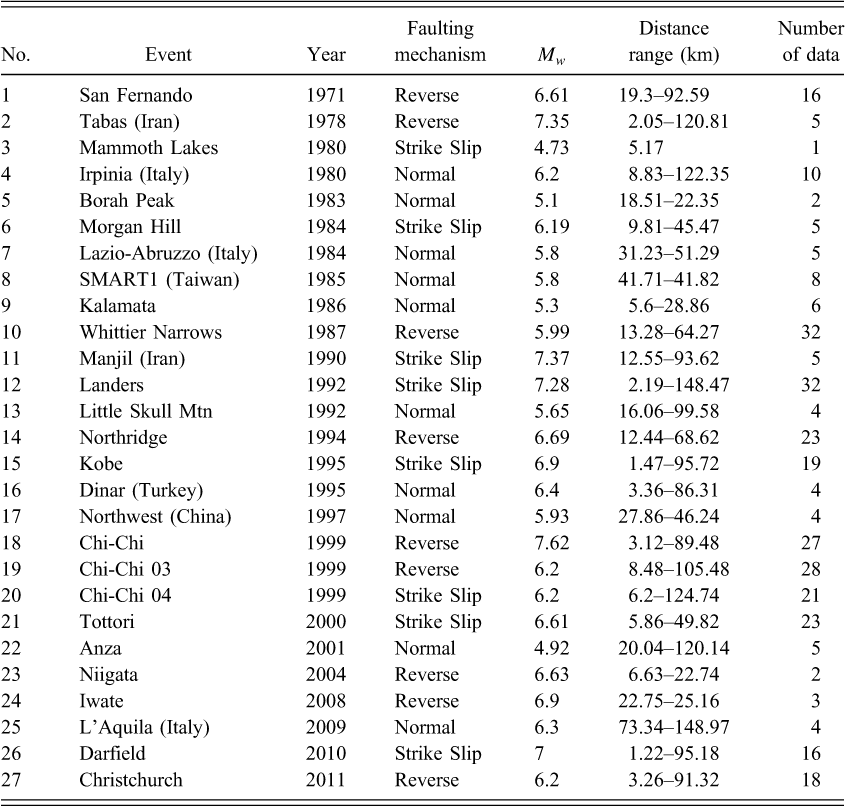
In this study, 328 records of ground motion events from 27 shallow crustal earthquakes were utilized. These data were extracted from the Pacific Earthquake Engineering Research Center (PEER), and recorded in free-field stations, mainly in California, Japan, New Zealand, Taiwan, Iran, Italy, and Turkey. In addition, the database was collected so that the records for each faulting mechanism (reverse, normal, and strike slip) cover uniformly a wide range of parameters such as magnitude, distance, shear wave velocity, and PGA. Furthermore, these ground motion data should be recorded before soil liquefaction occurs during the same motion. Table 2 presents relevant information pertaining the earthquakes. The three types of data, categorized according to fault mechanism, were normal events (52 records), reverse events (154 records), and strike-slip events (122 records). According to the 1997 UBC (Dobry et al. 2000), the sites corresponding to these data have been classified into class C, D, and E. Figure 9 shows the distribution of earthquake data with respect to moment magnitude and PGA against the closest distance to the rupture plane.
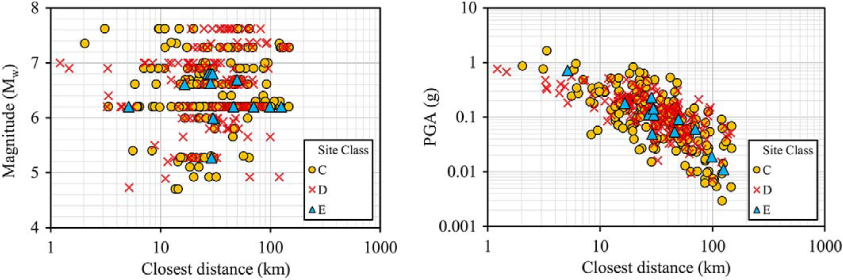
Distribution of earthquake data with respect to magnitude (left) and PGA (right).
List of earthquakes used in development of attenuation model (data source: PEER)
Development of Attenuation Model
The proposed method was employed to estimate the amount of EDE at different depths for the 328 ground motion records. Because the 10 m-interval (4–14 m) is usually the most important depth for a liquefaction study, the depths selected for this study were 4, 7, 10, and 14 m.
Effective Parameters
In this study, moment magnitude (M w ) was used to define the earthquake magnitude. Figure 10 illustrates the calculated EDE of several sites at a depth of 10 m for the earthquakes with different magnitudes. These sites have been located at approximately the same distance from the rupture plane, and all the earthquakes were generated from the reverse fault type. As shown in this figure, the EDE for all the soil site classes increases as the moment magnitude of earthquakes increases.
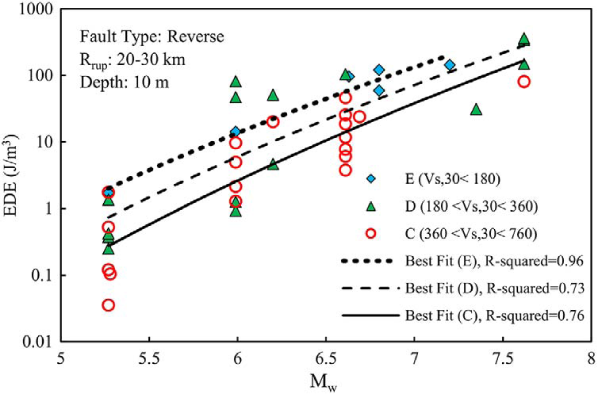
Variation in earthquake demand energy (EDE) with earthquake magnitude, M w , for different site classes.
In the present study, the closest distance to the rupture plane (R rup ) was selected as the site-to-source distance. Figure 11 depicts the calculated EDE at a depth of 10 m for the sites with the different site-to-source distances. In this figure, all the sites were subjected to the earthquakes with the same magnitude and the same fault mechanism. This figure indicates that the EDE at any site decreases with increasing distance between the source and the site for all the soil site classes. In addition, Figure 11 shows that VS30 also has an effect on the amount of EDE. According to this figure, dense soils, with higher shear wave velocities, are able to transmit more seismic energy, and less input energy is dissipated through these soils compared to looser soils.
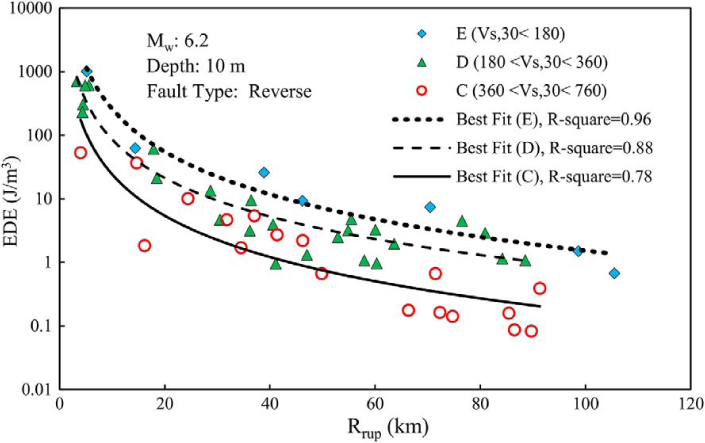
Earthquake demand energy (EDE) versus closest distance, R rup , for different site classes.
The effects of faulting mechanism on the amount of EDE for a constant earthquake magnitude within the same site class are presented in Figure 12. From this figure, it can be understood that reverse mechanism produces and propagates more seismic energy than normal and strike-slip mechanisms. McGarr (1984) used theoretical and empirical studies to conclude that since strike-slip and reverse-faulting are in the compressional stress tectonic regime, they are associated with higher ground motion, rather than normal-faulting earthquakes located in the extensional stress tectonic regime. His findings are consistent with Figure 12 results.
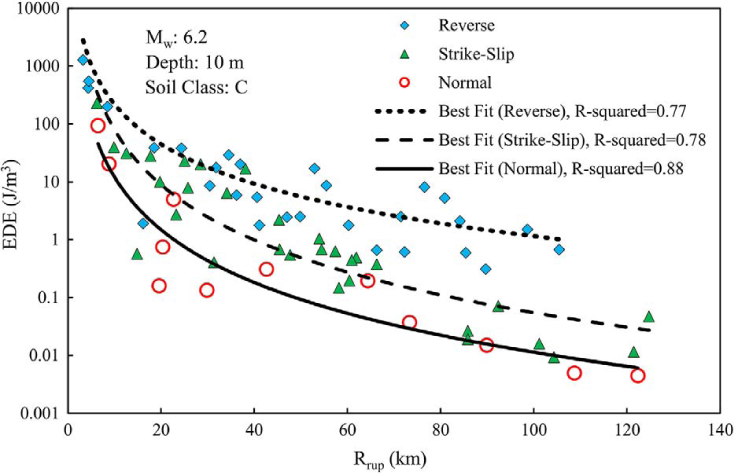
Earthquake demand energy (EDE) versus closest distance, R rup , for different faulting mechanisms.
In addition to the parameters discussed above, the PGA was selected as the surface amplitude of seismic waves, which represent subsurface conditions in the attenuation model. Figure 13 illustrates the relationship between EDE and PGA of 23 sites in California and Japan. This figure shows that despite having similar characteristics (M w , R rup , VS30, and fault type), the PGA and the corresponding EDE of the 23 sites have different values. Thus, since the PGA is affected by the site condition, it can also be a significant parameter for estimating EDE at a site.
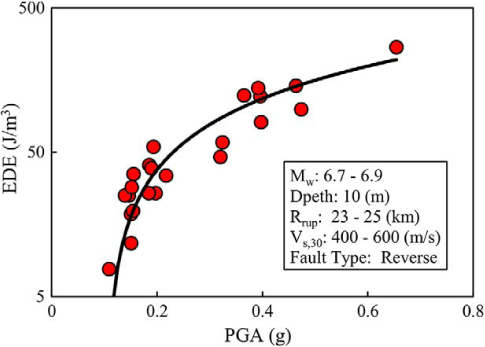
Earthquake demand energy (EDE) versus PGA for 23 sites, related to the 1971 San Fernando and 1994 Northridge earthquakes in California, and the 2004 Niigata, 2007 Chuetsu-oki, and 2008 Iwate earthquakes in Japan.
Proposed Attenuation Model
A simple attenuation model was proposed to estimate earthquake demand energy using regression analysis of 1,312 data points (four different depths for 328 earthquake records). This model includes three main functions and the model error, εlog(EDE), as follows:

Source function:

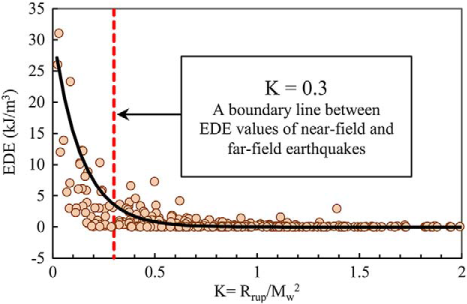
Distance function:

Site effect functions:

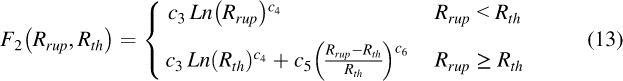
Earthquake demand energy (EDE) versus an empirical parameter, K (ratio of closest distance (km) and magnitude-squared).
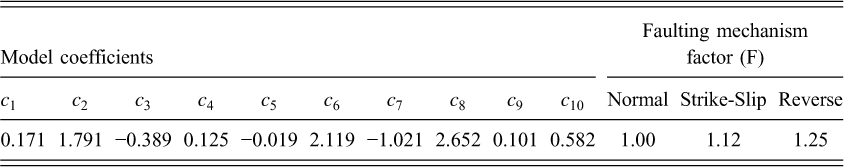
The coefficients c1 to c10 are defined for three functions as shown in Table 3. The regression procedure for determining these coefficients included three steps. In the first step, the data points were categorized by fault mechanism, and the logarithm of EDE was estimated by incorporating source and distance functions for any mechanism. Then, the coefficient c1, which was obtained using normal mechanism data, was selected for other mechanisms, and the coefficient c2 and the faulting mechanism factor were determined for each of the three faulting mechanisms. In this step, the effect of near-field ground motions was ignored. In the second step, c1 and c2 were fixed and the coefficients of the near and far distance functions were estimated. In the third step, all coefficients, except the coefficient of the site effect function were fixed, and the amounts of c7 to c10 were estimated.
Regression coefficients and faulting mechanism factors for attenuation model
Since the input energy values, used in the regression model, are associated with some degree of uncertainty, the uncertainty propagation in the model error must be considered. The standard deviation of the proposed simplified method was estimated using results of the predicted energy values of 18 vertical arrays (see Figure 8). Because the standard deviation, 0.243, is completely uncorrelated with the independent variables of the model, it cannot influence the model parameters, and only affects the standard deviation of the regression model, which is calculated to be 0.635. Eventually, the total model error is obtained from the square root of the sum of variances:

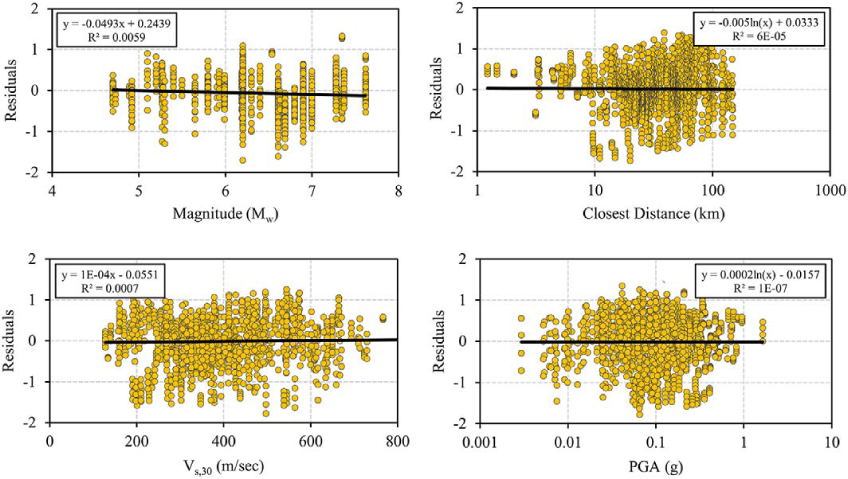
Distribution of estimation residuals with respect to magnitude, closest distance, VS30, and PGA.
Model Predictions
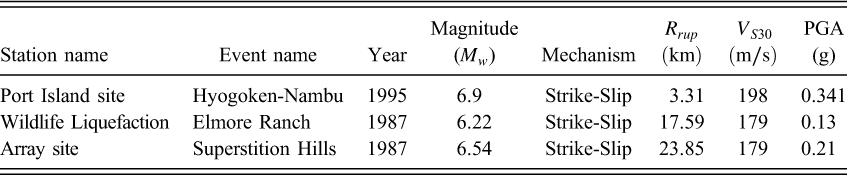
To assess the accuracy of the proposed attenuation model, two liquefied downhole array sites were selected (see Table 4), and their computed capacity energies were compared with the predicted demand energies (when the recorded accelerations from these two sites were not included in the databank, and implemented for the model).
Information of two liquefied downhole array sites used for validation of the EDE model
Port Island Site, Japan
The Port Island (PI) is a reclaimed island on the South West coast of Kobe, Japan. In August 1991, several instruments including accelerometers at the ground surface and at the depths of 16, 32, and 83 m were installed to record future earthquakes (Iwasaki 1995).
On January 17, 1995, the PI site was severely shaken by the Hyogoken-Nambu earthquake, M w = 6.9, and shallow layers were liquefied during this earthquake. The surface evidences of liquefaction such as ground settlement, lateral spreading, and ground fissures were observed after the earthquake (O'Rourke 1995). The recorded acceleration of the earthquake site at four different depths are illustrated in Figure 16. This figure also illustrates the computed cumulative dissipated energies at the depths of 4, 7, 10, and 14 m, using a nonlinear interpolation method. Zeghal and Elgamal (1996) characterized these recorded accelerations in three stages: (1) an initial phase of low amplitude vibration, (2) a strong shaking phase, and (3) low amplitude vibration at the surface. Using finite element analyses, they showed that an abrupt rise in excess pore pressure occurred mainly during stage 2.
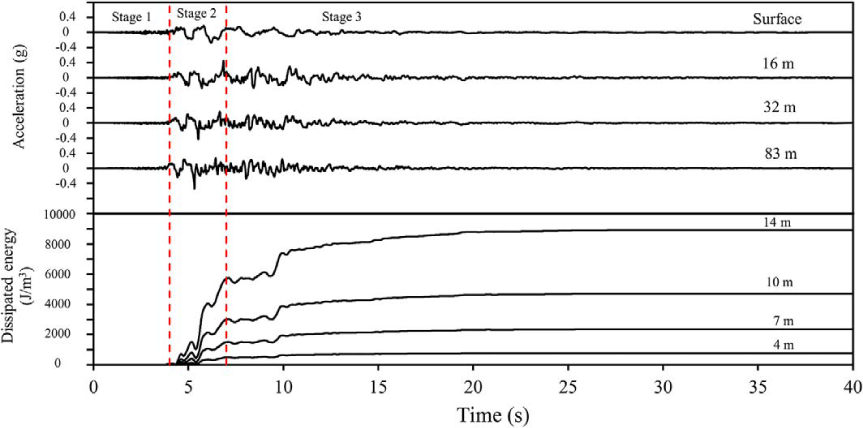
Horizontal (N-S) accelerations of Hyogoken-Nambu earthquake recorded at different depths of the PI site (Zeghal and Elgamal 1996), and computed cumulative dissipated energy at different depths during the earthquake.
In this study, it was assumed that the liquefaction triggering point falls into stage 3, and that the amount of cumulative dissipated energy at 7 s and 40 s were considered for the lower and the upper bounds of capacity energy for this soil layer, respectively. Figure 17 illustrates the capacity energy bounds, calculated using the nonlinear interpolation method, along the top 14 m of the site. As seen in Figure 17, the profile of the predicted demand energy falls on the right side of the upper bound, indicating liquefaction occurrence at this site. It should be mentioned that the closest distance of this site (3.31 km), which was considered a near-field site, was smaller than the threshold distance of the Hyogoken-Nambu earthquake (14.28 km).
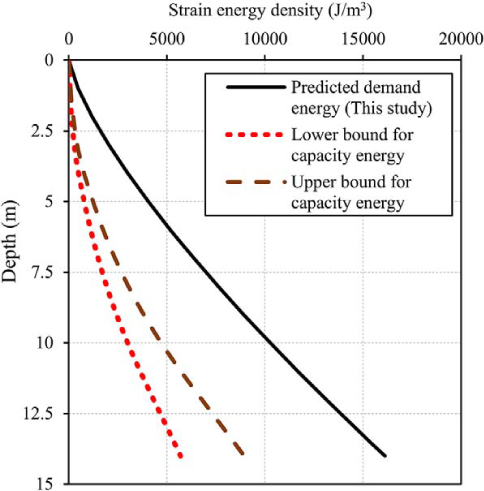
Calculated capacity energy region and predicted demand energy for Hyogoken-Nambu earthquake along the top 14 m of the PI site.
Wildlife Liquefaction Array Site, California
The Wildlife Liquefaction Array (WLA) site was established in 1982 on the plains of the Alamo River in the Imperial Valley desert of Southern California (Holzer and Youd 2007). The United States Geological Survey (USGS) instrumented this site with two triaxial accelerometers and six piezometers (Youd and Wieczorek 1984).
On 24 November 1987, two significant earthquakes occurred along the southern San Jacinto fault zone and the related structural elements in Southern California (Hanks and Allen 1989). The first event was the Elmore Ranch earthquake, M = 6.2, and was followed by the Superstition Hills earthquake, M = 6.6, which occurred approximately 12 hours later. Holzer et al. (1989) reported the occurrence of liquefaction at the Wildlife site during the Superstition Hills earthquake in the sandy silt and silty sand layers (2.5–6.8 m). In addition, other researchers (e.g., Dobry et al. 1989, Hushmand et al. 1992, Matasovic and Vucetic 1994) conducted various studies on the Wildlife site after the 1987 earthquakes, and reached a consensus that while the Superstition Hills earthquake did cause liquefaction at the Wildlife site, the Elmore Ranch earthquake did not cause liquefaction. Figure 18 depicts the recorded downhole array accelerations, excess pore pressure ratio, and the cumulative dissipated energy of the WLA site during the Superstition Hills earthquake. Zeghal and Elgamal (1996) characterized these recorded downhole array accelerations in four stages (stage 1: 0–13.7 s; stage 2: 13.7–20.6 s; stage 3: 20.6–40 s; and stage 4: 40–97 s). Stage 4 was selected to calculate the possible amounts of capacity energy at the WLA site. Figure 19 illustrates the lower and upper bounds of the capacity energy area and the energy demand amount of the Elmore Ranch and Superstition Hills events. These demand energies were predicted using the EDE attenuation model along the top 6.6 m of the WLA site. Since the threshold distances of the Elmore Ranch and Superstition Hills earthquakes (11.61 and 12.83 km, respectively) were smaller than the site-to-source distances (17.59 and 23.85 km, respectively), the motions were not considered near-field.
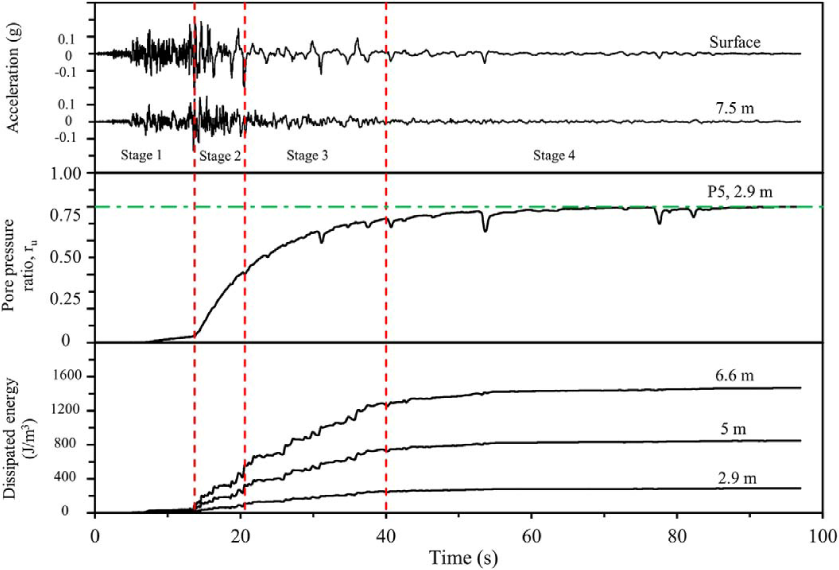
Horizontal (N-S) accelerations and pore pressure ratio at 2.9 m (Zeghal and Elgamal 1996), besides cumulative dissipated energy at different depths of the WLA site during the Superstition Hills earthquake.
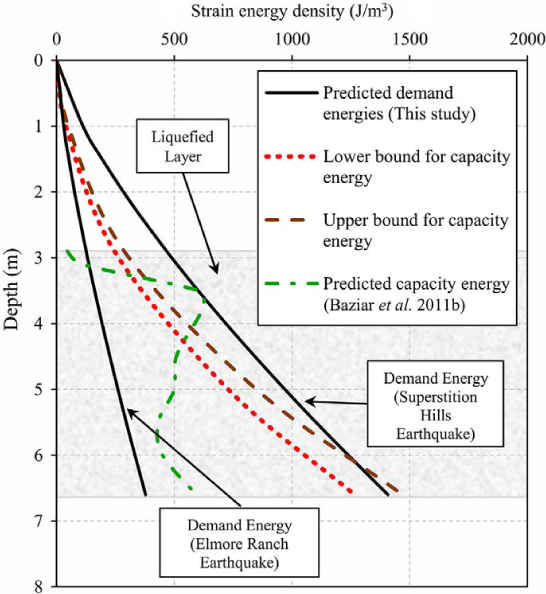
Calculated capacity energy region and predicted demand energies for the Elmore Ranch and Superstition Hills earthquakes along the top 6.6 m of the WLA site.
Using a wide-range of experimental database, Baziar et al. (2011b), proposed an equation to calculate the amount of capacity energy by soil parameters, including initial mean effective confining pressure, relative density, fine content, uniformity coefficient, and mean grain size. They calculated the capacity energy of the liquefied layer of the WLA site using their equation (see Figure 19). According to the findings, namely the comparison of the two predicted demand energies with the calculated capacity energy region and the empirical study of Baziar et al. (2011b), it can be concluded that this site did indeed liquefy during the Superstition Hills earthquake, but did not liquefy during the Elmore Ranch earthquake.
Conclusions
In this research, an attenuation model was developed to estimate earthquake demand energy (EDE) at a site. This research was conducted in two parts: (1) providing a new method for determining shear stress and shear strain time histories at shallow depth of a site when only one surface accelerometer is available; (2) using the obtained method to calculate the demand energy for the wide-ranging ground motion events, and creating a suitable database for developing a rigorous relationship among EDE, earthquake parameters, and soil characteristics.
Initially, recorded data from 18 downhole arrays in California were analyzed, and several semi-empirical equations for estimating shear stress and shear strain time histories due to earthquake loading at the shallow depth of a site were generated. The demand energies of 328 worldwide earthquake records at various depths of the free-field sites (4, 7, 10, and 14 m) were then calculated using the new method. Subsequently, an attenuation model was proposed using a nonlinear regression analysis. The obtained EDE values were based on the source mechanism, the distance, and the site effect functions. Finally, the proposed attenuation model was used to predict the demand energies at two well-known liquefied sites.
The developed method to calculate EDE using only one recorded acceleration at the surface sites, referred to in the first part of this study, can largely remove the limitation of the required two recorded surface and downhole accelerations. Also, analyzing downhole array records showed that the demand energy increases with increasing depth at 18 downhole arrays. The proposed attenuation model takes into consideration all the following, namely the role of source mechanism, distance and site effects. In the source function, the faulting mechanism factor (F) was considered as a constant factor, and the amount of F was determined using regression analysis. In the distance function, a simple energy-based criterion was used to consider the effects of near-field area on the EDE value. In the site effects function, besides the VS30, the PGA was used as representative of subsurface characteristics. The presented attenuation model is suitable for predicting the EDE at the top 15 m of free-field sites and earthquakes with M w > 4.5 and R rup < 150 km.
Footnotes
Acknowledgments
The downhole array data were provided by the Center for Engineering Strong Motion Data (CESMD). Furthermore, the worldwide ground motion data was made available by the Pacific Earthquake Engineering Research Center (PEER). In addition, the Wildlife Liquefaction Array (WLA) data were obtained through the Network for Engineering Earthquake Simulation (NEES) at the University of California Santa Barbara. The authors also thank Professor I. Towhata, University of Tokyo, for providing data of the Port Island (PI) site in Japan. Useful comments provided by Dr. H. Shahnazari and Dr. H. Sharafi are also gratefully acknowledged.